Massive-Star Supernovae as Major Dust Factories
Ben E. K. Sugerman1∗, Barbara Ercolano2, M. J. Barlow2, A. G. G. M. Tielens3, Geoffrey C. Clayton4, Albert A. Zijlstra5 Margaret Meixner1, Angela Speck6, Tim M. Gledhill7, Nino Panagia1, Martin Cohen8, Karl D. Gordon9, Martin Meyer1, Joanna Fabbri2, Janet E. Bowey2, Douglas L. Welch10, Michael W. Regan1, Robert C. Kennicutt, Jr.11
1Space Telescope Science Institute, 3700 San Martin Dr., Baltimore, MD 21218, USA
2Department of Physics and Astronomy, University College London, Gower Street, London WC1E 6BT, UK
3Kapteyn Astronomical Institute, P.O. Box 800, 9700 AV Groningen, Netherlands
4Dept. of Physics & Astronomy, Louisiana State University, Baton Rouge, LA 70803, USA
5School of Physics and Astronomy, University of Manchester, P.O. Box 88, Manchester M60 1QD, UK
6Dept. of Physics & Astronomy, University of Missouri, 316 Physics, Columbia, MO 65211, USA
7Dept. of Physics, Astronomy, and Maths, University of Hertfordshire, College Lane, Hatfield AL10 9AB, UK
8Monterey Institute for Research in Astronomy, 200 Eighth Street, Marina, CA 93933, USA
9Steward Observatory, University of Arizona, 933 North Cherry Avenue, Tucson, AZ 85721, USA
10Dept. of Physics and Astronomy, McMaster University, Hamilton, Ontario L8S 4M1, Canada
11Institute of Astronomy, University of Cambridge, Madingley Road, Cambridge, CB3 0HA, UK
∗To whom correspondence should be addressed; E-mail: sugerman@stsci.edu.
We present late-time optical and mid-infrared observations of the Type-II supernova 2003gd in NGC 628. Mid-infrared excesses consistent with cooling dust in the ejecta are observed 499-678 days after outburst, and are accompanied by increasing optical extinction and growing asymmetries in the emission-line profiles. Radiative-transfer models show that up to 0.02 solar masses of dust has formed within the ejecta, beginning as early as 250 days after outburst. These observations show that dust formation in supernova ejecta can be efficient and that massive-star supernovae can be major dust producers throughout the history of the Universe.
Introduction
Millimeter observations of high-redshift () quasars have revealed the presence of copious amounts of dust when the Universe was as young as 700 million years (1). At the present day, dust in the interstellar medium of the Milky Way and other galaxies is generally thought to be injected mainly by the gentle winds of low mass stars when they evolve onto the Asymptotic Giant Branch (2). However, stellar-evolution timescales of these low-to-intermediate mass stars are too long for them to be a major contributor to the dust budget in the early universe (3). Instead, dust in the early universe must reflect the contribution from rapidly-evolving (1-10 million years) massive stars which return their nuclear ashes in explosive type II supernova (SN) events. Theoretical studies have long suggested that dust can condense in the ejecta from core collapse (e.g. type II) SNe (4) and calculations predict condensation of 0.08–1 of dust within a few years, depending on metallicity and progenitor mass (5, 6, 7). There is also evidence for the origin of some dust in type II SNe based on isotopic composition of stardust isolated in meteorites (8).
Direct observational evidence for efficient dust formation in SN ejecta is, however, lacking, largely because SN explosions are rare and far apart. Dust formation was detected in the ejecta of SNe 1987A and 1999em, but only some were inferred for each (9, 10, 11), a factor up to smaller than typical SNe would have had to produce in order to contribute efficiently to the early-Universe dust budget (12). Similarly low dust masses have been measured in evolving SN remnants using the recently-launched Spitzer Space Telescope (13), however its mid-infrared (IR) instruments are most sensitive to warm (50–500 K) material, while dust in these remnants has almost certainly cooled to K. Cold dust has been detected in remnants in the far-IR and sub-mm, however such observations risk strong contamination by cold, unrelated dust clouds along the line of sight (14). As such, the best way to demonstrate dust condensation in SN ejecta is to study them within a few years of their explosion, during the epoch of condensation when the ejecta are much hotter than interstellar dust. The high sensitivity of the Spitzer’s mid-IR detectors allows us to sample very young core collapse SNe within 20 Mpc and opens up the whole nearby Universe for such studies. Here we report on such a study of the type II-P SN 2003gd in the galaxy NGC 628. A rare combination of contemporaneous optical and mid-IR observations of this well-studied SN with a known stellar progenitor mass of (15, 16) provides an excellent test case for the efficiency of dust formation in SN ejecta.
Data in Support of Dust Production
As dust condenses in SN ejecta, it increases the internal optical depth of the expanding ejecta, producing three observable phenomena: (1) a mid-IR excess; (2) asymmetric blue-shifted emission lines, since the dust obscures more emission from receding gas; and (3) an increase in optical extinction. All of these were observed from one to three years after outburst in SN 1987A (9, 10). In this section, we present or confirm all three phenomena from SN 2003gd.
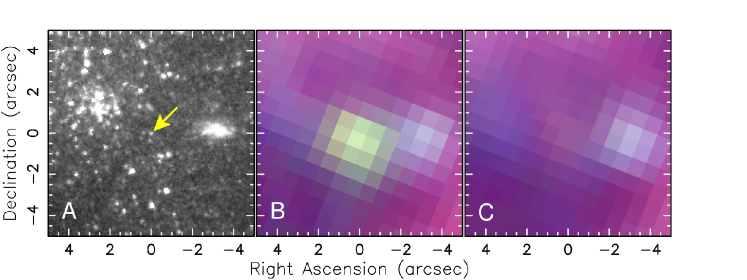
NGC 628 was observed by the Spitzer Infrared Nearby Galaxies Survey (SINGS) Legacy program (17) with Spitzer Space Telescope’s Infrared Array Camera (IRAC) at 3.6, 4.5, 5.8, and 8.0 m on 2004 Jul 28, or day 499 after outburst (18), and with the Multiband Imaging Spectrometer for Spitzer (MIPS) on 2005 Jan 23 (day 678) at 24 m; the SN was also observed with IRAC as part of GO-3248 (P.I. W. P. Meikle) on 2005 Jan 15 (day 670). All data were acquired from the Spitzer archive, then spatially enhanced using the SINGS data pipelines to a final resolution of 075 pix-1. A point source identified in all four IRAC bands from day 499 is consistent to within 017 (0.2 IRAC pixels) with the position of the SN progenitor (Fig. 1), as measured via careful absolute and differential astrometry between the 3.6 m IRAC image and the archival Hubble Space Telescope (HST) Wide Field and Planetary Camera 2 (WFPC2) data in which the progenitor was identified (16).
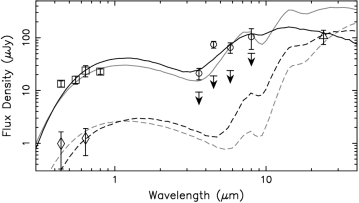
Photometry of the Spitzer data was performed using point-spread-function fitting techniques (19). The resulting flux densities are Jy at 3.6 m, at 4.5 m, Jy at 5.8 m, and Jy at 8.0 m on day 499, and Jy at 24 m on day 678; the SN is nearly undetectable in IRAC on day 670, with upper limits of 6.0, 10.6, 13.5, and 26.6 Jy at 3.6, 4.5, 5.8, and 8.0 m, respectively (Fig. 2). An excess at 4.5 m could be due to CO emitting at 4.6 m (10). Otherwise, the rising 5.8–24 m flux densities are not expected from the gaseous ejecta, which typically have temperatures of K at these late times (10). It is unlikely that this emission is a thermal light echo, since the time variability of the IRAC fluxes is significantly faster than that expected for a typical circumstellar dust shell (20). Assuming that the mid-IR emission can be modeled with a single blackbody, the best fit to the 5.8–8.0 m data from day 499 has a temperature of 480 K, which for an adopted distance to the SN of 9.3 Mpc (18), yields an integrated luminosity of and an equivalent radius of cm. The size, temperature, and variability implied by the spectral-energy distributions (SEDs), are thus consistent with lower temperature ( K) dust that is cooling within the SN ejecta.
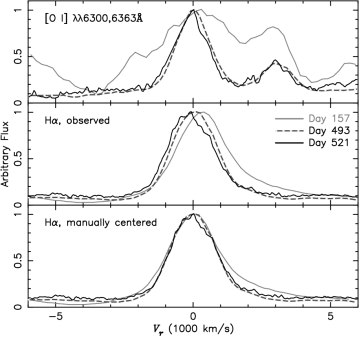
The first indication of such dust formation in SN 2003gd came in a comparison of broad-band photometry and H spectra of the SN between days 124 and 493 (18), in which a small decline in the late-time luminosity was accompanied by a slight blueshift in the emission-line peaks. New spectroscopic observations of SN 2003gd were obtained in long-slit mode, covering 4500–7000 Å with a spectral resolution of 7 Å using the Gemini Multi-Object Spectrograph (GMOS) on Gemini North on 2004 August 19 (day 521). Two spectra of SN 2003gd were obtained, which have been de-biased, flattened, wavelength-calibrated, sky-subtracted, extracted and then combined. The wavelength calibration is accurate to about 2 Å. The H and [O I] spectra from days 157 and 493 (18) are compared to the newer data in Fig. 3. Inspection of the lines confirms that the emission peak is indeed blueshifting, while the red high-velocity wing seen at the earliest epoch has diminished. Additionally, the most recent spectra show a clear asymmetry in the first few hundred redward of each line peak. These blueshifted peaks and asymmetric profiles are consistent with a simple model in which dust with an increasing optical depth is located within an expanding sphere of uniform emission (11); in particular, the day 521 profiles suggest an optical extinction .
The , , and light curves of SN 2003gd through day 493 (18) have been combined with the and -band photometry from day 632 (21) in Fig. 4. Over this 500-day period, the SN is evolving almost identically to SN 1987A, with the exception that SN 2003gd is slightly subluminous in and around day 493. The close match between the light curves of these two SNe implies an increase in optical extinction of SN 2003gd as well.
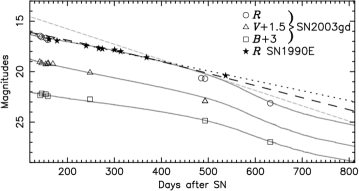
The observed dust extinction is measured by comparing the change in photometry over time to a standard intrinsic luminosity. The internal extinction in SN 1987A is believed to have increased by mag between days 525 and 700, as determined in broad-band photometry by comparing the light curve after day 525 to the best-fit line through the data from days 450–525 (9). The slope of this line (Fig. 4) is extremely sensitive to the subset of the SN 1987A light curve used, and the resulting dust extinction can vary by over 1 mag depending on the days included in the least-squares fit. Thus we deem this a poor measure of the intrinsic luminosity.
The broad-band evolution of Type II SNe past 500 days is poorly documented, since very few SNe have ever been observed beyond this epoch. At these late times, the light curve is dominated by the energy input of gamma rays from 56Co decay, which decreases with an -folding time of days. The -band photometry of the Type II SN 1990E (22) closely follows this evolution through 540 days (Fig. 4), suggesting simple Co-decay is a good estimate of the unextinguished -band light curve for at least that long. However, as the ejecta expand, their opacity to gamma rays is expected to decrease, which results in a modified light curve (23)
| (1) |
where the term in brackets is the “effective opacity,” with cm2 g-1 the average opacity to 56Co-decay gamma rays, and g cm-2 the column depth at the fiducial time days, chosen to match the bolometric light curve of SN 1987A (23, 24). Note that Eq. (1) begins fading relative to simple 56Co decay around 500 days.
The Co-decay curves, both with and without the effective-opacity correction, are much more luminous than the aforementioned linear fit to SN 1987A at the time of dust formation (Fig. 4). The slopes of these Co-decay curves also closely resemble that of SN 1987A after day 775, when dust production is believed to have ended (10). Thus, Eq. (1) offers a more realistic standard luminosity for the unextinguished -band light curve of SN 1987A. Comparison of to the SN 1987A photometry yields extinctions of 1.5 mags around day 700 when effective opacity is included, and 2.5 mag when it is excluded. Since the evolution of SNe 1987A and 2003gd are so similar, Eq. (1) is also used to estimate the extinction of SN 2003gd at each epoch, as listed in Table 1.
| Day | (mags) | ||
|---|---|---|---|
| average | maximal | error | |
| observed | |||
| 493 | 0.52 | 0.73 | 0.09 |
| 632 | 1.36 | 1.78 | 0.12 |
| extrapolated | |||
| 499 | 0.53 | 0.74 | 0.14 |
| 678 | 1.51 | 2.13 | 0.20 |
Dust-Mass Analysis and Interpretation
The observations presented above overwhelmingly point toward dust forming within the ejecta of SN 2003gd, beginning sometime between 250 and 493 days after outburst. To estimate the mass of dust present, we employ the three-dimensional Monte Carlo radiative-transfer code MOCASSIN (25). Briefly, the paths of photon absorption, scattering and escape are followed from a specified source through a given composition, grain-size distribution, and geometry of dust. The particular choices of these are either constrained a priori or varied until the model emission and extinction match the observed values.
Since our hypothesis is that dust condenses within the ejecta, the radiative-transfer model is constructed under the initial assumption that the dust and source luminosity are mixed within a spherical, expanding shell with inner radius , outer radius , and density profile, and with the illuminating radiation proportional to the dust density. Initial values for the shell size, source luminosity and temperature are guided by the blackbody previously fit to the mid-IR data, and by models of SN 1987A at similar epochs (10). There are numerous models for dust formation within SN ejecta (for a review, see 26), most of which predict grain sizes will remain small. We adopt a standard size distribution (27), with grain radii between m, and the dust composition is taken to be 15% amorphous carbon and 85% silicates (7), with optical constants taken from (28, 29). Finally, since there are very few optical and mid-IR data to constrain a given model, the source luminosity is restricted to evolve according to Eq. (1) while its temperature remains constant (10).
Two dust distributions are considered. In the first, “smooth” model, the dust is uniformly distributed throughout the shell according to the adopted density profile. However, as early as a few hours after outburst, post-shock ejecta become Rayleigh-Taylor unstable (30, 31), forming an inhomogenous or “clumpy” distribution, which we model as a two-phase medium, in which spherical clumps with size , volume filling factor and density contrast are embedded within an interclump medium of density . This is analogous to the mega-grains approximation (32) with the addition of a radial density profile. Only macroscopic mixing has been found in the clumpy ejecta of SN remnant Cas A (33), which suggests elemental ejecta layers remain heterogeneous. We therefore assume the source luminosity is completely separated from the dust clumps. For a given geometry, a clumpy model will always require more mass than a smooth one to fit a given SED, since clumping lowers the overall optical depth for a given mass of dust (32). Rather than explore the extensive parameter space of clumpy models, we study the limiting case where all dust is in clumps, i.e. , which should provide upper mass limits, while the smooth models will provide lower mass limits. Finally, as suggested from hydrodynamic simulations (31), we fix .
| day | Model | () | |
|---|---|---|---|
| 499 | Smooth | 0.40 | |
| 499 | Clumpy | 0.65 | |
| 678 | Smooth | 1.48 | |
| 678 | Clumpy | 1.22 |
Model results are summarized in Fig. 2 and Table 2. A good fit to the day 499 photometric and extinction data was achieved for the smooth model using , cm, , and K, while fitting the day 678 data required changing to cm and to . Clumpy models used these same parameters, with on day 499, and on day 678. A complete exploration of the model parameter space is beyond the scope of this work, and will be presented elsewhere. In general, small changes to the model parameters have only modest effects. For example, including maximum grain sizes up to 0.25 m (typical of dust in the interstellar medium) decreases the dust mass by less than 10%. A 10% change in or results in a 1–5% change in mass for our adopted parameter ranges. Thus, the smooth and clumpy model results shown in Table 2 offer reasonably robust lower and upper mass limits, respectively.
These clumpy-model masses, up to on day 499 and on day 678, are significantly higher than most analytic estimates of the dust mass for SN 2003gd. For example, using the same grain properties as above, and of dust are required to produce the mid-IR emission at days 499 and 678, if all grains are visible and isothermal (34). Using the mega-grains approximation for dust uniformly mixed with diffuse emission within a spherical shell (32), the -band extinction yields masses of only and of smooth dust for days 499 and 678. In contrast, up to of clumpy dust is deduced from the mega-grains model for day 499, which agrees well with our radiative-transfer model. However, once clumps become optically thick, only geometry () determines their extinction, thus an arbitrarily-large mass of clumpy dust reproduces the extinction from day 678. This behavior of the mega-grains model makes it of limited use in determining dust masses when the observed optical depth reaches unity. We conclude that the most-often used analytic approximations can provide unreliable estimates of dust masses.
Observations similar to those presented here have demonstrated the condensation of dust in the ejecta of SN 1987A and 1999em, but the inferred masses for these SNe were only modest, of order (10, 11). Asymmetric H line profiles have been detected for type II SNe 1970G, 1979C and 1980K (35), however this phenomenon on its own is also consistent with an expanding ionization front shell of emission catching up with and passing through a pre-existing dust shell, and does not prove the presence of newly-forming dust. For SN 1998S, asymmetric line profiles and near-IR (m) excess emission also point towards dust condensation in the ejecta (36). In all these cases, the absence of contemporaneous mid-IR observations precluded a quantitative estimate of the condensation efficiency. In the light of our quantitative clumpy-dust analysis, the amounts of dust believed to have formed in the ejecta of SN 1987A and 1999em – which were based upon analytical estimates – are being carefully revisited.
For a progenitor mass for SN 2003gd between 10–12 (18), roughly 0.16–0.42 of refractory elements are expected to form if the progenitor had solar metallicity (37). Assuming dust formation has finished by day 678, our derived dust mass of for this progenitor translates into a condensation efficiency, defined here as (mass of refractory elements condensed into dust)/(mass of refractory elements in ejecta), of for clumpy dust. Having found that analytic analyses of optical and IR observations tend to underestimate the dust mass by an order of magnitude or more, we deem it likely that dust formation in core collapse SNe is significantly more efficient than previously believed. In particular, the effiency implied by SN 2003gd is close to the value of 0.2 needed for SNe to account for the dust content of high redshift galaxies (12). As noted earlier, too few SNe have been followed sufficiently in time and wavelength to establish the frequency with which SNe form dust. We are currently addressing this question through continued, long-term monitoring of a much larger sample of young, type II SNe. If dust formation is found to be common in core collapse SNe, then since a majority of dust is expected to survive later passage through high-velocity SN shocks (38), we can conclude that core collapse SNe played a significant role in the production of dust in the early Universe.
References and Notes
- Bertoldi et al. (2003) F. Bertoldi et al., Astron. Astrophys. , 406, L55 (2003)
- Tielens (1998) A. G. G. M. Tielens, Astrophys. J. 499, 267 (1998)
- Dwek (1998) E. Dwek, Astrophys. J. 501, 643 (1998)
- Cernuschi et al. (1965) F. Cernuschi, F. R. Marsicano, I. Kimel, Annales d’Astrophysiques 28, 860 (1965).
- Dwek (1988) E. Dwek, Astrophys. J. 329 814 (1988).
- Kozasa et al. (1989) T. Kozasa, H. Hasegawa, K. Nomoto, Astrophys. J. 344, 325 (1989).
- Todini & Ferrara (2001) P. Todini, A. Ferrara, Mon. Not. R. Astron. Soc. 325, 726 (2001).
- Clayton et al. (1997) D. D. Clayton, S. Amari, E. Zinner, Astrophys. Space Sci. 251, 355 (1997).
- Lucy et al. (1991) L. B. Lucy, I. J. Danziger, C. Gouiffes, P. Bouchet, in Supernovae. The Tenth Santa Cruz Workshop in Astronomy and Astrophysics, S. E. Woosley, Ed. (Springer-Verlag, New York, 1991), 82.
- Wooden et al. (1993) D. H. Wooden et al., Astrophys. J. Suppl. Ser. 88, 477 (1993).
- Elmhamdi et al. (2003) A. Elmhamdi, et al., Mon. Not. R. Astron. Soc. 338, 939 (2003).
- Morgan & Edmunds (2003) H. L. Morgan, M. G. Edmunds, Mon. Not. R. Astron. Soc. 343, 427 (2003).
- Hines et al. (2004) D. C. Hines, et al., Astrophys. J. Suppl. Ser. , 154, 290 (2004)
- Krause et al. (2004) O. Krause et al., Nature 432, 596 (2004).
- Van Dyk et al. (2003) S. D. Van Dyk, W. Li, A. V. Filippenko, Publ. Astron. Soc. Pac. 115, 1289 (2003).
- Smartt et al. (2004) S. J. Smartt et al., Science 303, 499 (2004).
- Kennicutt et al. (2003) R. C. Kennicutt, Jr. et al., Publ. Astron. Soc. Pac. 115, 928 (2003).
- Hendry et al. (2005) M. A. Hendry et al., Mon. Not. R. Astron. Soc. 359, 906 (2005).
- Stetson (1987) P. B. Stetson, Publ. Astron. Soc. Pac. 99, 191 (1987).
- Dwek (1983) Dwek, E. 1983, Astrophys. J. , 274, 75
- Sugerman (2005) B. E. K. Sugerman, Astrophys. J. 632, L17 (2005).
- Benetti et al. (1994) S. Benetti et al., 1994, Astron. Astrophys. 285, 147 (1994).
- Woosley et al. (1989) S. E. Woosley, D. Hartmann, P. A. Pinto, Astrophys. J. 346, 395 (1989).
- Suntzeff & Bouchet (1990) N. B. Suntzeff, P. Bouchet, Astron J. 99, 650 (1990).
- Ercolano et al. (2005) B. Ercolano, M. J. Barlow, P. J. Storey, Mon. Not. R. Astron. Soc. 362, 1038 (2005).
- Clayton & Nittler (2004) D. D. Clayton, L. R. Nittler, Annu. Rev. Astron. Astrophys. 42, 39 (2004).
- Mathis et al. (1977) J. S. Mathis, W. Rumpl, K. H. Nordsieck, Astrophys. J. 217, 425 (1977).
- Draine & Lee (1984) B. T. Draine, H. M. Lee, Astrophys. J. 285, 89 (1984).
- Hanner (1988) M. S. Hanner, NASA Conf. Pub., 3004, 22 (1988).
- Chevalier & Klein (1978) R. A. Chevalier, R. I. Klein, Astrophys. J. 219, 994 (1978).
- Herant & Woosley (1994) M. Herant, S. E. Woosley, Astrophys. J. 425, 814 (1994).
- Városi & Dwek (1999) F. Városi, E. Dwek, Astrophys. J. 523, 265 (1999).
- Douvion et al. (1999) T. Douvion, P. O. Lagage, C. J. Cesarsky, Astron. Astrophys. , 352, L111 (1999).
- Doty & Leung (1994) S. D. Doty, C. M. Leung, Astrophys. J. 424, 729 (1994).
- Fesen et al. (1999) R. A. Fesen et al., Astron J. 117, 725 (1999).
- Pozzo et al. (2004) M. Pozzo et al.,Mon. Not. R. Astron. Soc. 352, 457 (2004).
- Woosley & Weaver (1995) S. E. Woosley, T. A. Weaver, Astrophys. J. Suppl. Ser. 101, 181 (1995).
- Nozawa, Kozasa & Habe (2006) T. Nozawa, T. Kozasa, A. Habe, Astrophys. J. , in press (available at http://arxiv.org/abs/astro-ph/0605193).
-
1.
We gratefully acknowledge M. Hendry, for providing optical spectra of SN 2003gd, and E. Dwek and P. Ghavamian for useful discussions. This work is based in part on archival data obtained with the Spitzer Space Telescope, which is operated by the Jet Propulsion Laboratory, California Institute of Technology under a contract with NASA; with the NASA/ESA Hubble Space Telescope, obtained from the Data Archive at the Space Telescope Science Institute, which is operated by the Association of Universities for Research in Astronomy, Inc. (AURA), under NASA contract NAS 5-26555; and on observations obtained during the program GN-2004B-C-3 at the Gemini Observatory, which is operated by AURA under a cooperative agreement with the NSF on behalf of the Gemini partnership. Support for B.E.K.S. for this work was provided by SST award GO-20320 issued by JPL/Caltech. D.L.W. acknowledges support from the Natural Sciences and Engineering Research Council of Canada (NSERC). M.C.’s participation was supported by JPL contract #1269553 with MIRA.