Analysis of Saturn main rings by continuous wavelet transform with the complex Morlet wavelet
E-mail: postnicov@mail.ru
**Physics Faculty, Moscow State University, Moscow 119992, Russia
E-mail: loskutov@chaos.phys.msu.ru)
Abstract
A new method based on continuous wavelet transform with the complex Morlet wavelet to analyze Saturn main rings is presented. It allows to investigate in detail the resonance zones and reveal the coexistence of waves with stable periods and the wave trains with a variable instant period. This method is based on the replacing the integration of the fast–oscillation function by the solution of the partial differential equations. It is shown that such an approach is an effective tool for the study the radial structure of Saturn’s A, B, and C rings. All the analyzed images were obtained from the Cassini spacecraft during 2004–2005 years.
23 pages.
10 figures.
Running head: “Analysis of Saturn main rings …”
Keywords: Saturn rings, “Cassini” mission, wavelet transform, image processing.
1 Introduction
One of the modern problems of astrophysical data processing is development of the effective tools for the analysis of non-stationary data sequences. As an important example of such data processing one can mention the analysis of optical density of Saturn rings. These possess a rich variety of patterns, waves, wakes etc. discovered by the spacecrafts “Voyager–1” and “Voyager–2”, which nature is not completely understood up to now (see e.g. a review of Esposito 2002). Recently, new data become available due to the “Cassini” mission (see the primary report by the Porco et al. 2005). In order to use these data and to verify various models of pattern formation, one needs a tool to resolve local spectra.
There exists two main approaches which, can presumably, describe the formation of such structures. The first one considers the gravitational interaction of the ring particle with Saturn’s satellites (the basis of this approach is established by Shu et al. 1983, 1985). Within this approach, the appearance of a set of wave trains has been explained. Later, Spilker et al. 2004 detected resonance patterns in the ring A by applying the windowed Fourier transform. The search for the effects of high resonances in the ring B existing on a background of stochastic perturbations, is proposed by Thiessenhusen et al., 1995.
The second approach is based on the hydrodynamic description o the rings (see, e.g., Schmidt and Tscharnuter 2001, Griv and Gedalin 2003 and references therein). The corresponding theoretical analysis (see Schmidt and Tscharnuter 2001) with the use of the Navier–Stokes equations for the viscous self-gravitating fluid reveals the radial structures as narrow peaks divided by interstice of about 80–100 meters. Horn and Cuzzi 1996 described such a type of stable periodicity on the basis of the “Voyager” data.
In the paper Griv and Tscharnuter 2003, it has been shown that Jeans type instability in a self–gravitating continuum may be described by analogy with the plasma instability, where Coulomb are replaced by the unscreened gravitational interactions. It is found that characteristic wavelengths are about 30–200 m in the A ring, 7–30 m in the B ring and less than 7 m in the C ring.
Thus, the local spectral properties could play a crucial role in waves classification and in analysis of the physical properties of the rings. The continuous complex wavelet–transform is the most powerful tool to achieve this goal. Its principal advantage with respect to other methods (see, e.g. Mallat 1999, Poularicas 2000) is a high localization of the basis functions in both spatial and frequency domain. Also, the size of a window and an instant period are correlated in this method: for high–frequency signals the window shrunks while for the low-frequency signals it is dilated. This keeps the effective number of oscillations in the window constant.
The complex wavelet analysis has been successfully applied to study the orbital period variations of asteroids in nearly–resonance zones (Michtchenko and Nesvorný, 1996) and for processing of the solutions obtained for Hamiltonian systems, in particular for the three–body problem (see Vela-Arevalo 2002).
An application of the wavelet transform to analize the Saturn rings has been proposed by Bendjoya at al. 1993, who studied the “Voyager–2”data for the Encke gap. The authors however used only real wavelets since their primary goal was to extract different–scale patterns from noisy images. At the same time, the problem of the local periodicity in the Saturn’s rings requires applications of the complex wavelet transform. The relevance of such approach has been shown by Postnikov and Loskutov, 2005a, 2005b and Porco et al. 2005.
In the present study we develop a new approach for the evaluation of the complex continuous transform with the Morlet wavelet and show that it may be successively applied for the analysis of the images of Saturn’s rings structures recently obtained during the “Cassini” mission. It allows to investigate in detail the resonance zones and reveal the coexistence of waves with stable periods and the wave trains with a variable instant period. It has a number of merits over the standard ways based on the Fast Fourier Transform (FFT) as an intermediate step. Firs of all, it is adapted more better to the consideration of local features of the signal, because it never uses the global transform of the whole sample. By the same reason, the proposed method is free from errors related to the periodization of the signal (the Gibbs phenomenon, ringing, aliasing, etc.). Also, it allows to choose the boundary conditions adapted to the local properties of functions in the region of the end points of the finite sample. The possibility of a sufficiently small scale discretization which satisfies a definition of the wavelet transform, allows us to analyze the following characteristics of the Saturn main rings: to demonstrate the coexistence of waves with stable periods and the wave trains with a variable instant period; to raise a question about the presence of several orders of the resonance wakes; the coexistence of the resonance waves generated by Saturn’s satellites.
2 The complex continuous wavelet transform as a method for the image processing
The the continuous wavelet transform (CWT), according to its definition, reads (Mallat 1999):
| (1) |
where the asterisk denotes the complex conjugation. For the local spectral analysis it is convenient to use the following normalization:
| (2) |
where is a constant.
The wavelet exploited for the signal processing, is usually the complex Morlet wavelet:
| (3) |
where is large enough () to make the application meaningful. The corresponding wavelet-transform plays then a role of the local spectra in the neighborhood of the point with period . Let us illustrate this by two simple examples.
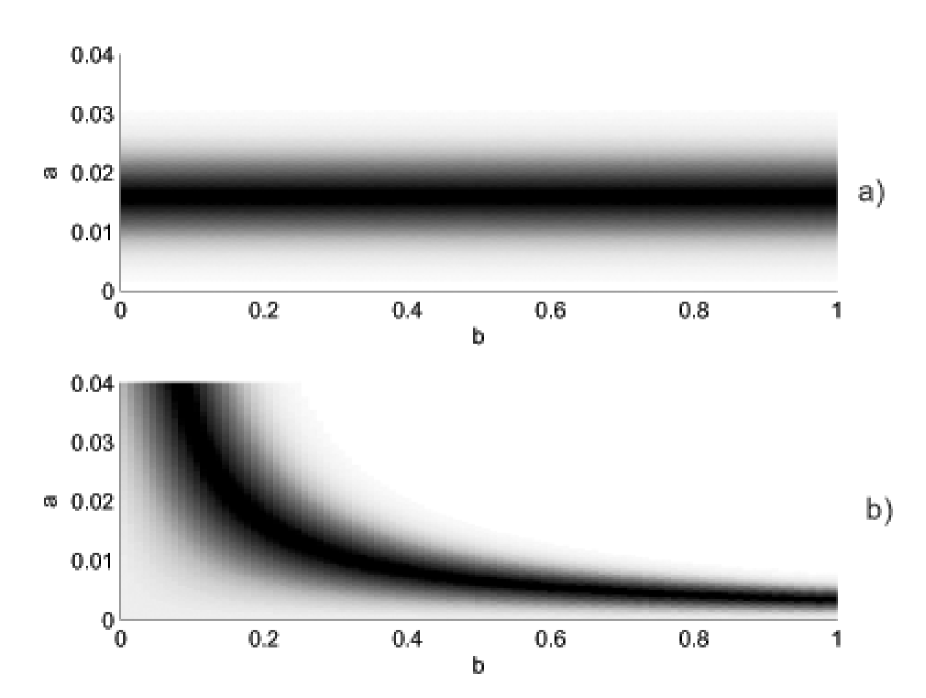
Consider first a harmonic ; the corresponding wavelet–transform and its modulus read:
The two–dimensional graph of the modulus distribution for the wavelet–transform clearly demonstrates the maxima line corresponding to the period , Fig.1a. The Gaussian factor reduces the noise by smoothing.
One can obtain an analytic expression for the wavelet–transform which refers to the matter distribution in the density wave due to resonance interactions with Saturn’s satellites. The asymptotic expression in the area which are far from the perturbation source is (Shu el al. 1983): . Here and indicates the direction of the wave motion and is determined by the mass distribution in the ring:
Here is a gravitational constant, is the particle surface density, and are respectively the angular velocity of a satellite and ring particles, is an integer, and , with being the gravitational potential.
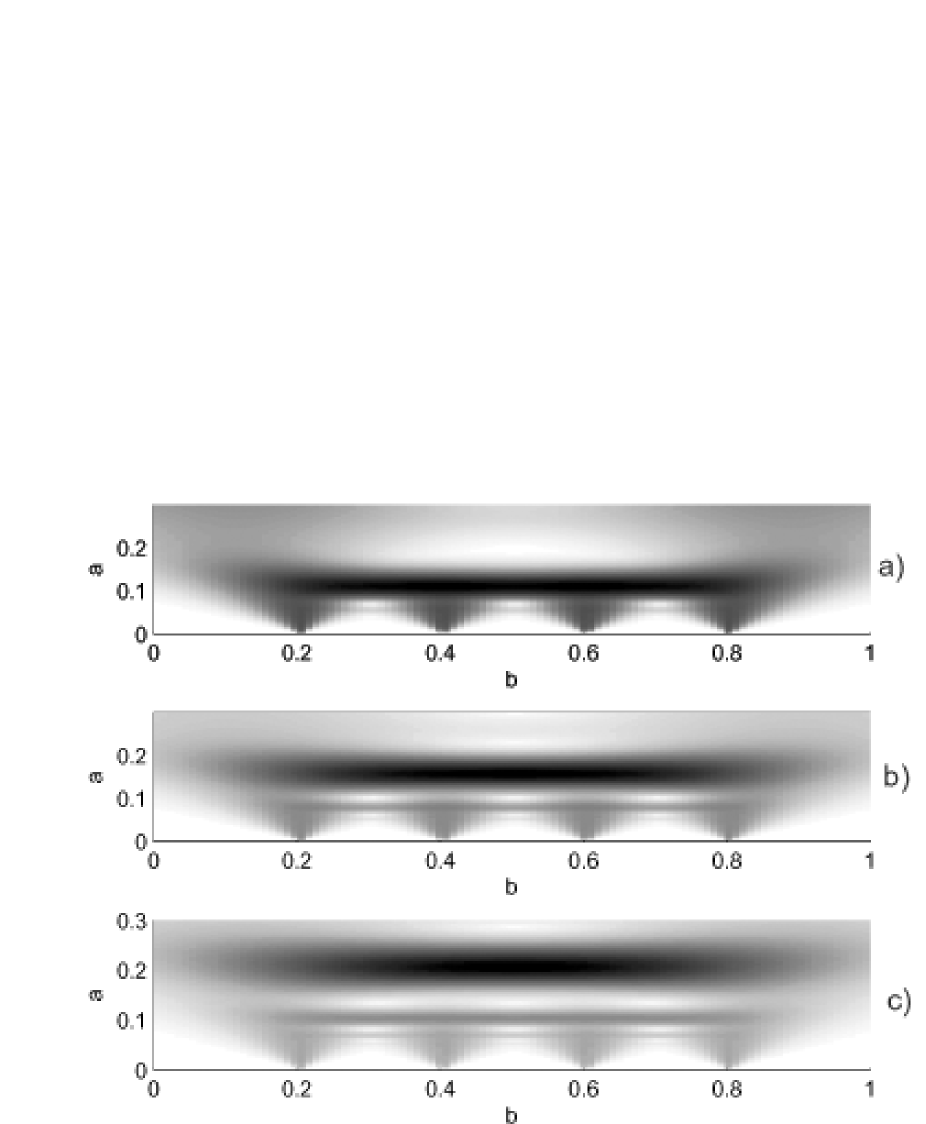
The variation of the basic frequency allows to vary a resolution factor. For small the individual spikes may be easily resolved. With increasing basic frequency, the number of oscillations of the wavelet within a typical window also increases. However, while the resolution of harmonics becomes better their the spatial localization worsen. We illustrate this for a set of periodic signals composed of Dirac –functions:
see Fig.2.
Note that we may clearly detect period of the sequence by the line only in Fig.2a, where . At (Fig.2b) one can reveal the second line corresponding to the second harmonics in the Fourier–transform of the signal. This phenomenon is demonstrated in Fig.2c, where also we may see the appearance of high harmonics.
These properties of the wavelet transform are to be taken into account when performing the image processing. To be more specific, consider an area of the A ring adjacent to the resonance zones due to Prometheus (12:11) and Mimas (5:3). Owing to a large legibility of the images the corresponding density waves may be tested to construct the resonance excitation models (Shu et al., 1983, 1985). Fig.3 depicts a part of the photo obtained by “Cassini” (a), a contour of the image brightness (b) and the module of the wavelet–transform at (c, d, e). One can clearly see the discussed effect of the line detachment caused by the nonharmonicity of the signal.
Such a structure has been determined by Porco et al., 2005 at the edge of the Encke division. The authors did not perform a detailed analysis, but assumed that the phenomenon may be explained by the the second order perturbation due to Pan. Since the authors used a standard calculation technique of the wavelet transform with a large basis frequency, one needs a more careful analysis of the physical and computational effects constituting this feature.
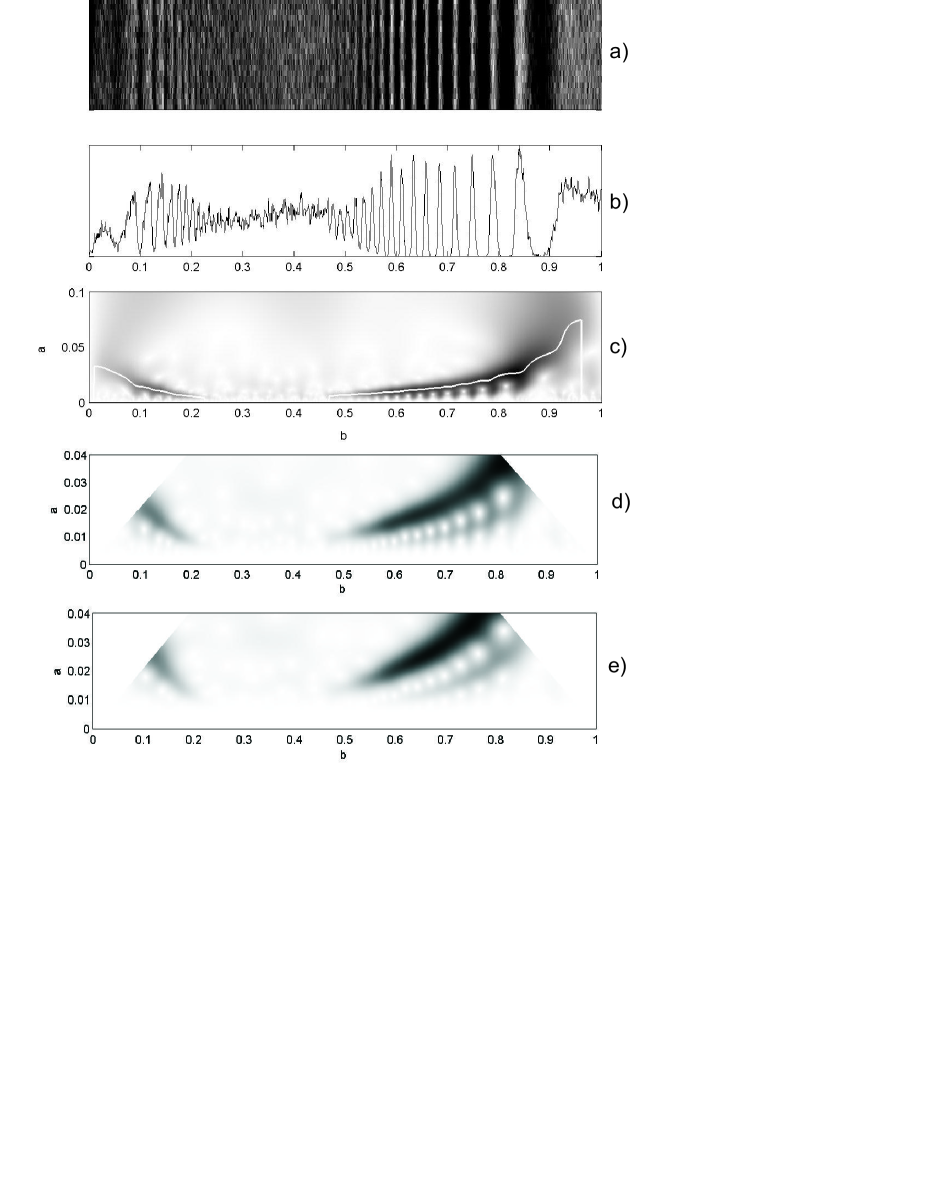
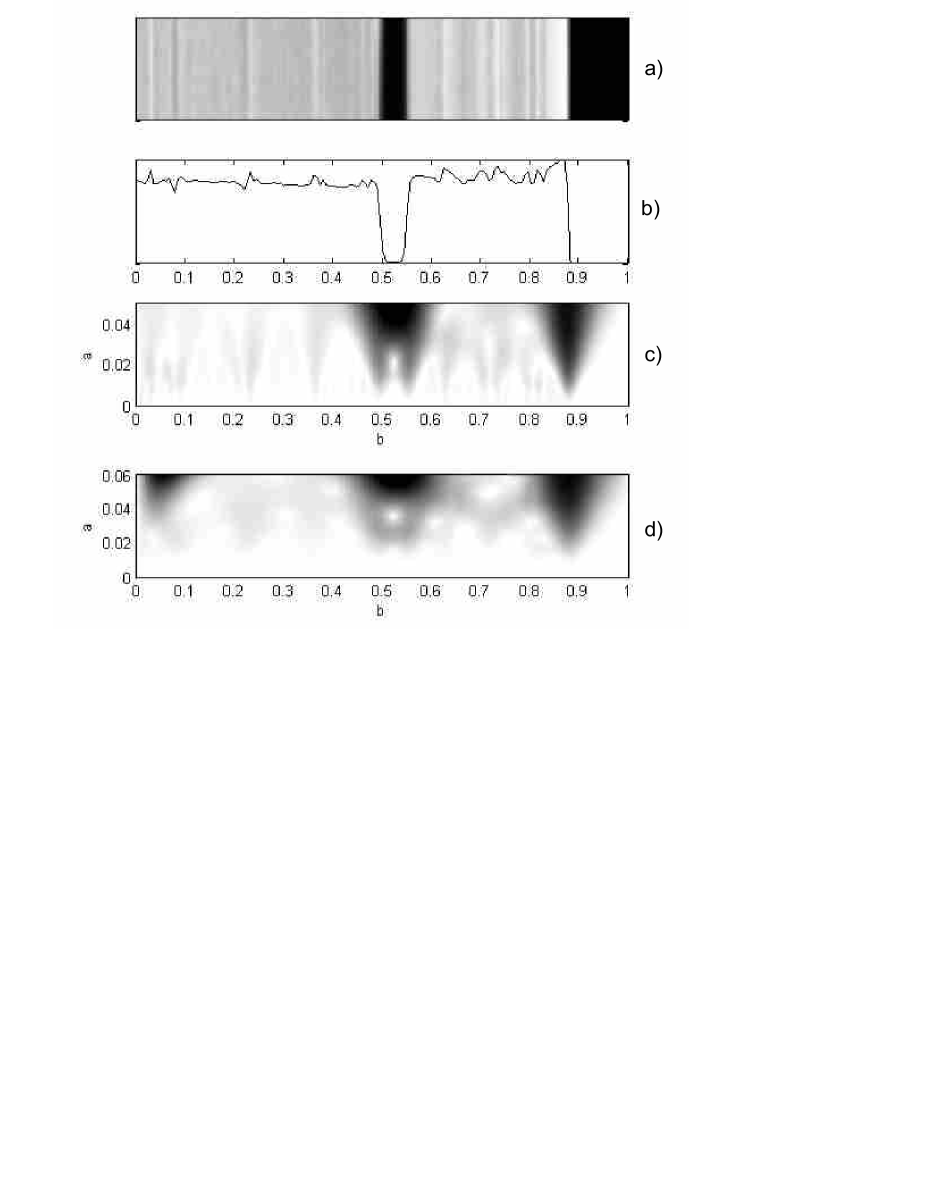
To process the images which lack a high resolution, one needs to increase the basic frequency. For example, it is necessary for the analysis of the brightness distribution of the image PIA 07533 (the Encke division, 2005, Fig.4a). Here the resolution is about 1 km/pixel, and whole sample stretches up to about 1340 km. The brightness of the image averaged over pixels is shown in Fig.4b. For this resolution the resonance structures are rather narrow which generate at the basis frequency the comb–like structures (Fig. 4c). Increasing the basis frequency up to yields more smooth maxima lines which describe typical long–wave patterns in the interresonance region.
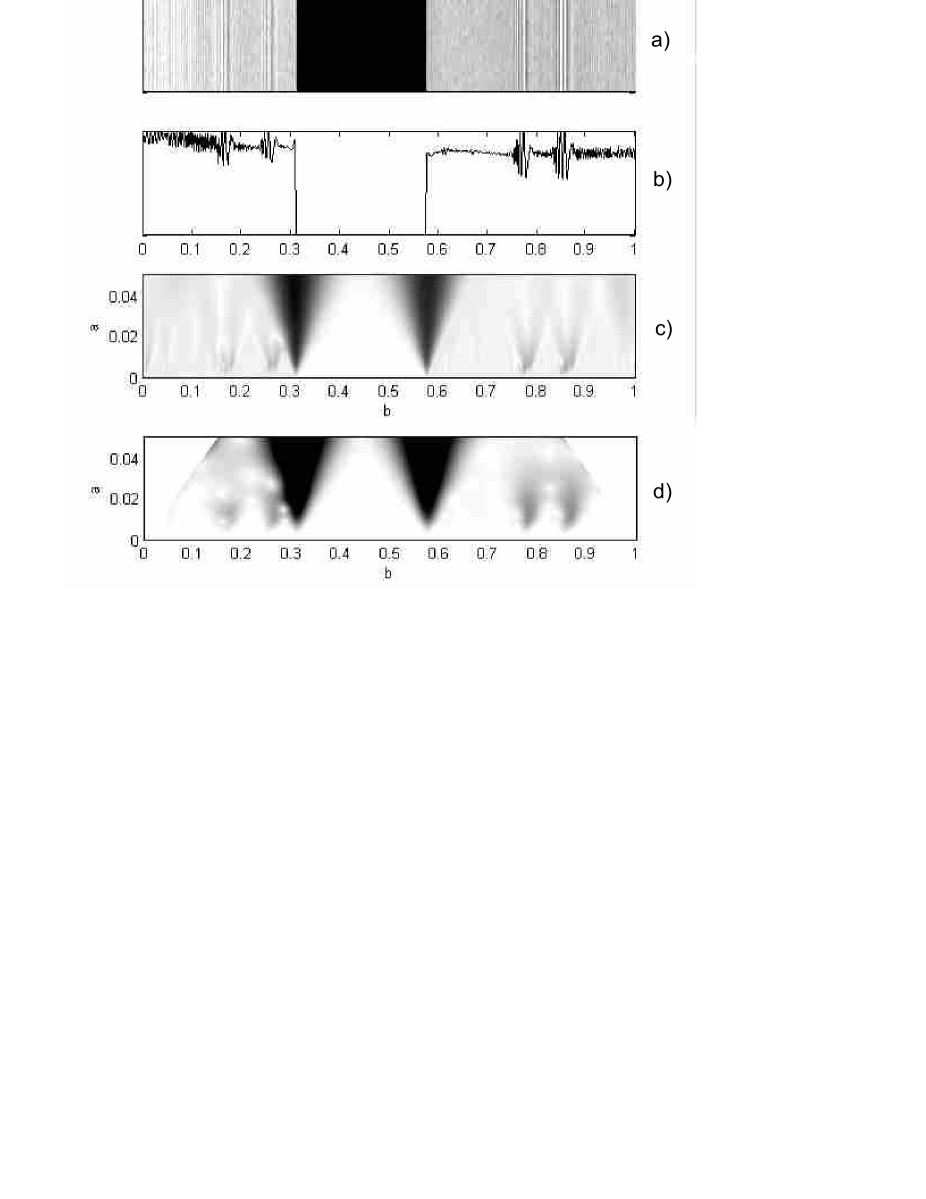
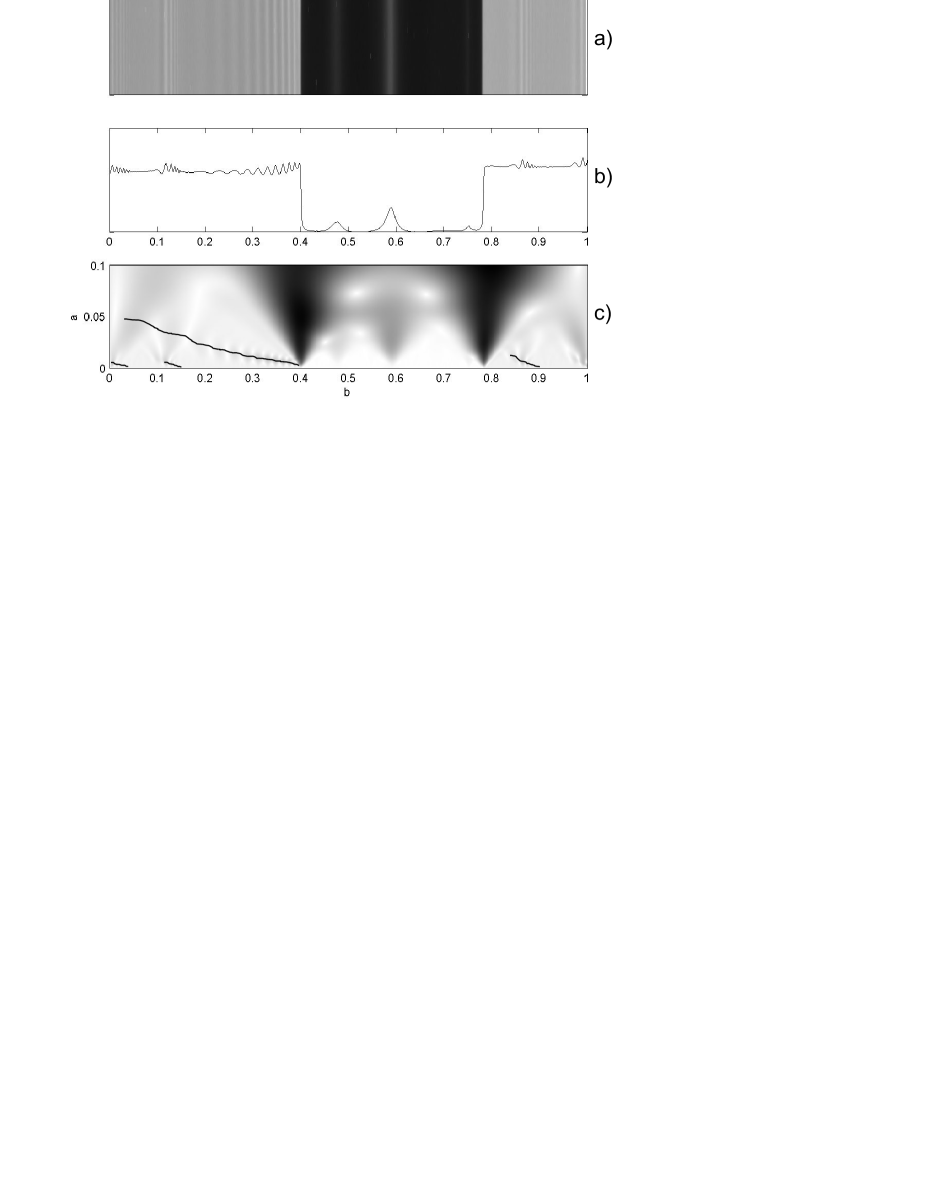
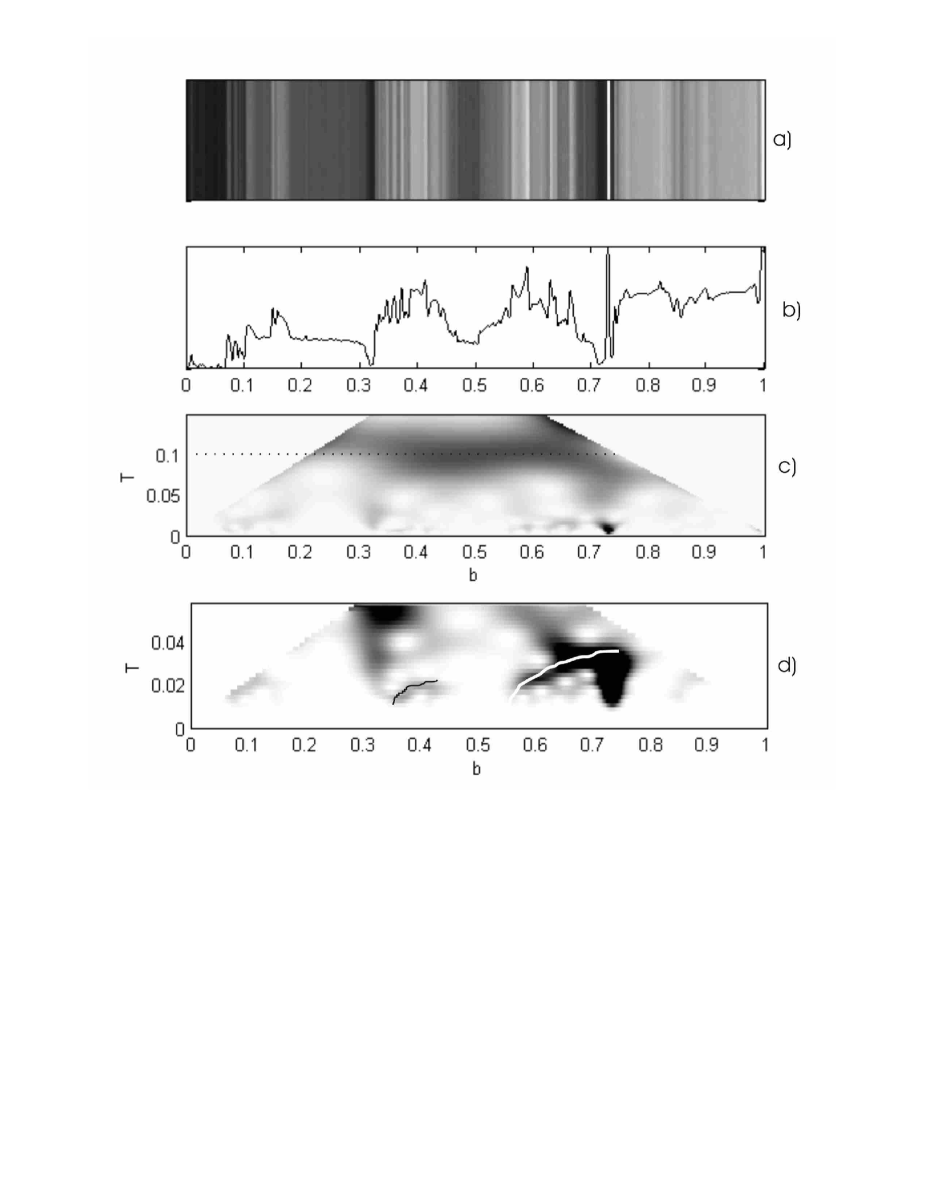
The same discussion is relevant in application to the Keeler gap image obtained by “Cassini” in May 2005 (Fig.5) with the resolution about 3 km/pixel. The size of this part is km. The density distribution averaged over 18 pixels in the transverse location is shown in Fig.5b. The abrupt changes in the image give sufficient distortions in the wavelet–transform with frequency . At the same time, the transformation with allows to observe the evolution of the instant period along the radial direction.
We wish to stress that the standard way of CWT calculation includes FFT as an intermediate step. However, in spite of the algorithm simplicity and its hight effectiveness, the FFT suffers from certain disadvantages: the initial sample must have equidistant nodes, and the obtained data have the corresponding frequency distribution. Violation of this condition leads to a sufficient complications of calculation and/or to the loss of accuracy.
Here we attack the problem in a quite different way: We use the fact that the integral (1) has a form of the solution of a partial differential equation (PDE), where the wavelet plays a role of the Green function. Here the variables and correspond to the “time” and “space” variable of this PDE. Let us consider this statement in more detail.
It is known that the wavelet–image (1) with the Morlet wavelet (see ) is a solution of the following PDE:
| (4) |
In [4] this differential equation has been used to reveal local properties of a priori known wavelet–image. As a next step we recast the continuous transform (1) with the kernel (3) as:
| (5) |
This expression corresponds to the normalization (2) with .
As is known, the integral (5) does not depends on the imaginary subtrahend in the exponent. Also, the transformation kernel turns to the Dirac delta-function in the limit . Hence, is an initial value for the PDE (4). Since is a solution of (4) with the initial value it affirms that wavelet in (5) is indeed a Green function for Eq. (4).
In practical calculations it is convenient to write the wavelet-image as a sum of real and the imaginary parts
With these notations Eqs.(4) reads,
| (6) | |||
| (7) |
with the initial conditions
Correspondingly, the modulus of the transform is
From the applied point of view the proposed approach has the following advantages.
-
•
There exist the stable finite–difference algorithms for the numerical solution of partial differential equations of the diffusion type (see, e.q. Sceel, Berzin 1990). The solver of parabolic PDE realized in MATLAB (used in our examples) is based on this algorithms. In every point for any the value of the wavelet–transform is determined by the solution of the equations (6). The wavelet–image obeys this system. Any given in advance the scale small step may be easily realized by a finite–difference scheme.
Such an approach has advantages over the standard one. The matter is that, the method using FFT [7] allows to find the required transform only for the discrete set of scales. In the other points the value of the wavelet–transform can be calculated by the interpolation (say, parabolic). This means that it is not satisfied to the exact transform expression.
It is especially evident for the cases of small scales. The minimal period resolution which is permitted by the sample of points is . At the same time, the value of the transform at is equal to zero in all points of the interval using the quadratic norm. This norm is required for the FFT. Thus, values in the small scale areas via the interpolation do not reveal the local properties of the signal. In addition, the passage from the obtained result to the amplitude norm is reduced to the division by and obviously, does not decrease the errors of the method. This is due to the fact that this operation is ill–posed, i.e. is uses division of two close to zero numbers. On the contrary, in the proposed approach expression is an initial value for the PDE. The solution in the small scale area possesses maximal possible accuracy. Besides, the given method does not require equispaced sampling of the initial values. For more details and examples, see Postnikov 2006.
-
•
The finite–difference algorithms do not have difficulties with the sample periodization (the Gibbs phenomenon, ringing, and aliasing). In the case of inequality of the function at the beginning and the end points of the interval, one should consider the function with the finite discontinuities in the countable set of points. For such functions pointwise convergence of the Fourier series (the Gibbs phenomenon) does not hold true [6]. As a result, in the vicinity of the boundary points artificial oscillations (as addition maxima in the area of small scales) appear. This is known as the ringing phenomenon. Secondly, in the cone of influence of the boundary points the value of errors is a quite large. This is similar to the cones in the points of delta-functions (see Fig. 2). Depending on the value of discontinuity their magnitude may be sufficiently more than the general level of the modulus of the wavelet–transform of the signal. In this case valuable information will be hidden.
At the signal periodization there is also folding of high frequency components over a low frequency interval which is known as aliasing [7]. At the inverse Fourier transform this leads to additional low-frequency filtering of the wavelet image. At the same time, the algorithm basing on the PDE solution by finite–difference schemes works with local values of the function in the knots of the sample). For example, the standard finite–difference approximation of the second derivative requires the knowledge of the function only in the three points. Thus, the global characteristics of the sample (its length and the length of the Furier–image support) does not influence on the local properties (except for large scales compared with half length of the sample).
Besides, owing to the reduction of the problem to the PDE system, periodic boundary conditions are not unique. Moreover, as it was mentioned, these conditions are undesirable. In our approach the Dirichlet or Neuman boundary conditions are more adequate. Conditions at every of the two ends of the interval may be chosen independently and adapted to the properties of the signal in the vicinity of this points.
3 Analysis of the Saturn main rings
Let us apply the described algorithm to the processing images of the Saturn rings obtained by the spacecraft “Cassini”. We chosen images from the NASA/JPL/Space Science Institute collection (see http://ciclops.org). We have cut out a quite narrow stripe in the radial (across the rings) direction from every image such that we can neglect a certain curvature of the rings. We used the following images of A ring: PIA06099 ( pixels, Fig.6a), PIA06094 ( pixels,Fig.7a), PIA06095 ( pixels, Fig.8a) and PIA06093 ( pixels, Fig.3a); B ring: PIA06543 ( pixels, Fig.9) and C ring: PIA06537 ( pixels, Fig.10). For more deep visualization all images were stretched in the lateral direction.
These images allow a quantitative analysis since the characteristic sizes of the ring areas may be quantified.
Due to the fact that the signal is a real, we used initial conditions and , where the function can be obtained by the sample average (see Fig.6b – 10b). Because the signal has a bounded width the Cauchy problem for the equations (6)–(7) is to be replaced by the boundary problem. Accordingly, we have chosen the boundary conditions of the first kind: the value of the transform real part is equal to the signal values, the transform imaginary part is zero. We used the base frequency since it allows to select clearly lines of the instant period, as it is shown above. In the diagrams of the module of wavelet–images the maxima lines are marked by contrast black lines.
An interesting fact found in the neighborhood in the Encke division, is the co-existence of resonance waves of certain periods. One can note that a large-scale evolution of a spiral wave excited by Pan from the edge division, which provides the growth of the value of its instant period, admits a continuous transformation to a maxima line corresponding to large-scale bursts. The typical size of such scales is about the length of the train of resonance waves generated by the resonances 11:10 with Pandora and 15:14 with Prometheus. Here there is a clear crossing of the maxima lines of various resonances, which does not initiate their interaction.
We found also the effect of the crossing of the maxima line of large- and small-scale (forming by Pan) resonance wave structures in the outside of the Encke division (see Fig.7c).
The other type of the inhomogeneity which can be detected by the proposed wavelet–analysis is the waves with relatively stable period. Therewith, for A ring the presence of small-scale periodicity in interresonance areas is typical. For B and C rings we have long-periodic waves against a background of which the resonance peaks take place.
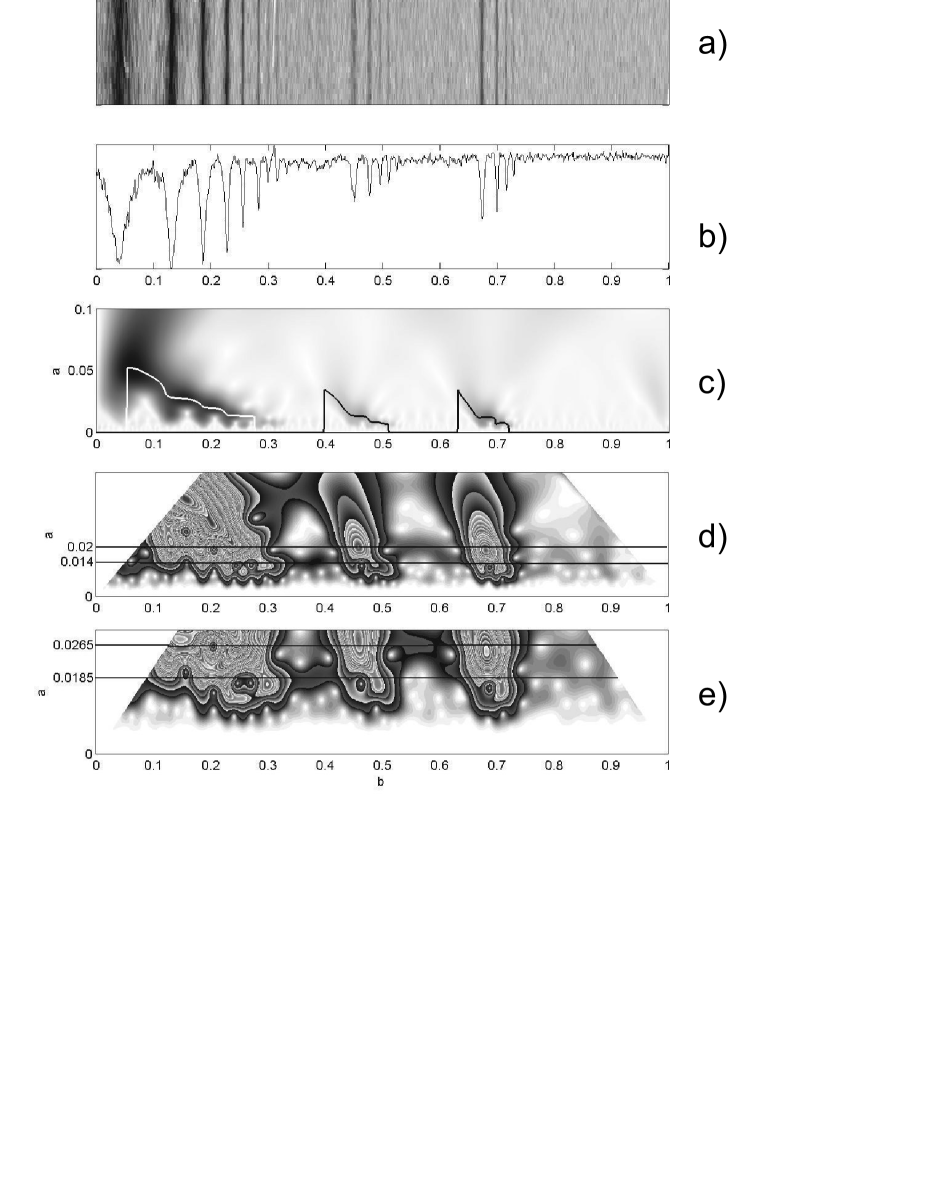
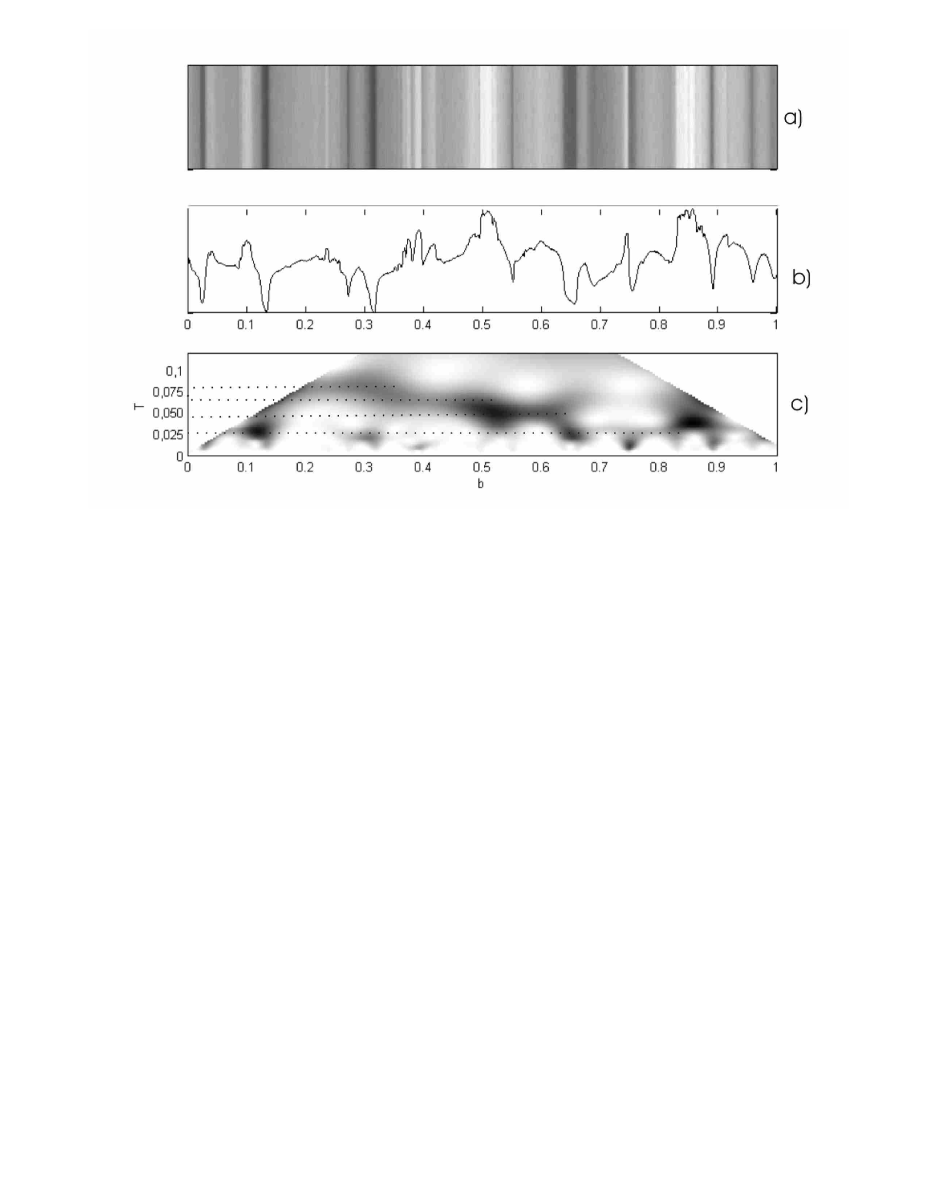
To carry out a detailed analysis of the A ring small-scale in the interresonance areas, consider the density waves formed by the resonances with Janus, Pandora and Prometheus. A typical staircase-like shape of their instant spatial period is shown in Fig.8c. obtained at the basis frequency . To get more frequency resolution let us increase the basis frequency up to the value of (Fig.8d) and (Fig. 8e). We apply the following criterium: we consider only the areas in the plane where the condition is satisfied, with or .
To increase the sensitivity to the small amplitude module we use various gray tints for larger values. This method leads to the tailing of resonance lines but allows to separate (by the brightness lines) almost stable periodic signal in the interval which couples the two first resonance wave trains. Its period is km. In the interval , between the second and the third resonances, a shortwave signal is also detected. However it has unstable spatial period which is changed in the limits km. Therewith, the first value coincides with the wave period between the resonances of Janus (4:3) and Pandora (5:6).
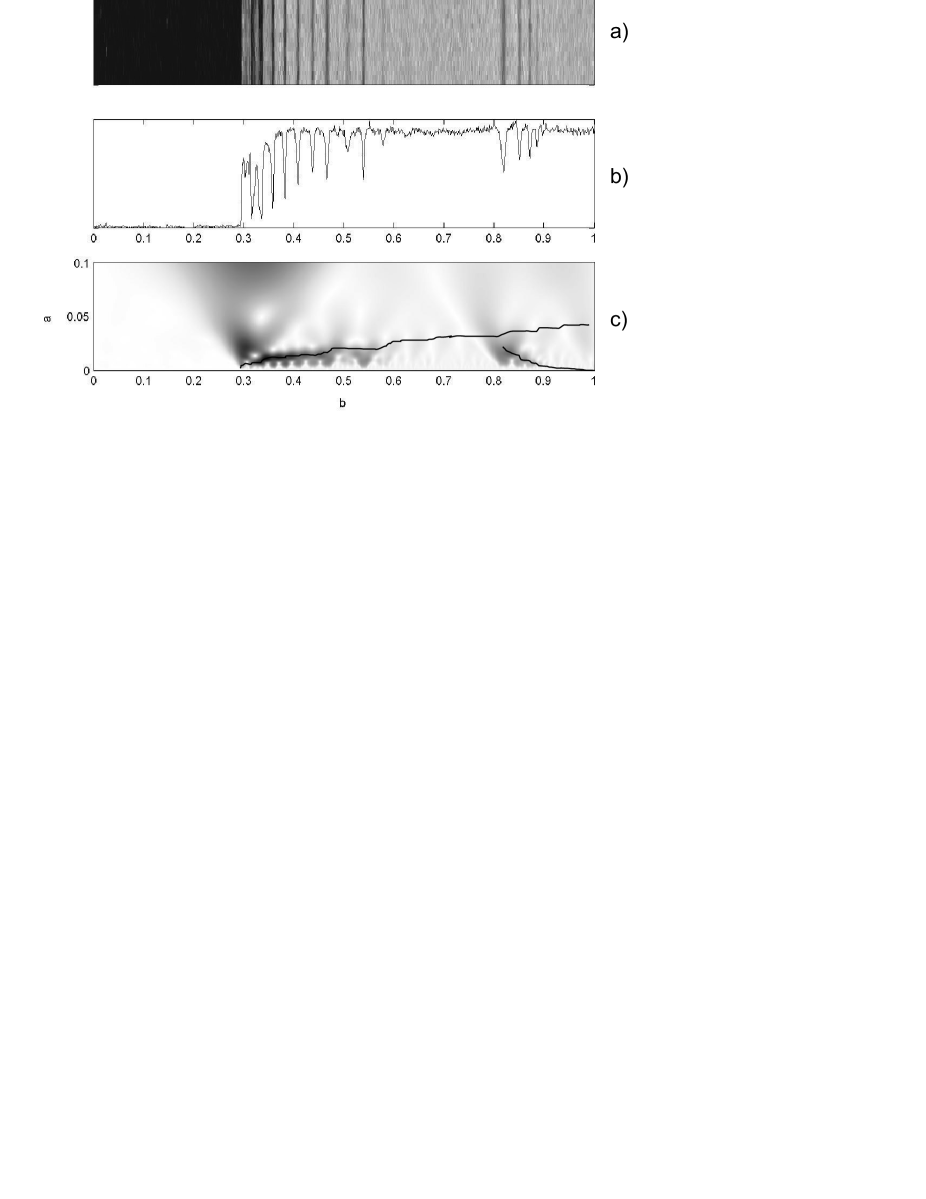
For B ring, in Fig.9c one can see that in the region with dimensionless coordinates form to there exists a smooth variation of period with to km, and the maxima line has a staircase-like shape with three plateaus. Also, one can see another part of the maxima line corresponding to period km. With this background and with such resolution we may find only an inclined line of resonance in a neighborhood of the point with the coordinate . Small-scale structures with the ordered periodicity are practically lacking.
One can detect a large variety of structures in a part of C ring (see Fig.10). Here, besides a background density wave with period 460 km we may clearly recognize two classical resonance curves. They become apparent already in Fig.10c, being more clearly visible in Fig.10d, where the maxima lines are emphasized by contrast black and white curves. It should be noted that a flat grey line, which is below this white line, does not manifest an additional phenomena. It is just the consequence of a large basis frequency as is shown at the analysis of non-sinusoidal waves in the first part.
4 Results and Discussion
We have shown in out study, that the continuous wavelet transform with complex Morlet wavelet is an effective tool for the analysis of spatial radial structures of Saturn rings. It makes possible to observe the instant period evolution at various scales as well as detect the periodic bursts of different nature. These abilities of the method steams essentially from the proposed algorithm, which allows to derive a continuous small steps for the scale variable. It is the direct consequence of the application of the algorithm of solving partial differential equations which replaces the integral transform. Besides such a representation has the natural connection with the method of tracing of wavelet maxima and ridges offered in the paper [4]. Additionally, the method does not suffer, as the FFT from the artificial effects connected with the periodization of the sample.
This makes possible to find parameters which characterize the mass distribution as well as the other physical properties of the rings. The detailed analysis of the wave processes in Saturn rings should include a question concerning the interaction of long-wave parts of perturbations with small-scale wave trains generated by the resonance effect of satellites. Also, this analysis should take into account mechanisms of the formation of almost monochromatic small-scale waves in regions between the of resonance zones.
From the modulus diagram, we reveal that almost monochromatic spatial density oscillations take place in such regions. They may be detected by the maxima lines which are drawn parallel to the coordinate axis. This line of maxima virtually connects the other lines of maxima corresponding to two resonance staircases (i.e. points that correspond to the minimal scale). We may propose a mechanism of such type of behavior: when the frequency of the resonance spatial swings of the matter is comparable with the typical frequency of viscously-unstable standing waves, this interaction induces visco-elastic oscillations.
The opportunity of the inverse transformation for the exact form of the Morlet basis makes it possible to cut from the radial signal and analyze the small-scale wave features, e.g. the resonance trails. By substituting the wavelet–image values chosen along the maxima line (and its small neighborhood) into the expression of an inverse wavelet–transform, we may obtain a set of purely resonance oscillations. Then, subtracted them from a total signal, we get a function diagram which allows us to analyze a small-scale structure. Localization of regions of the stable periodicity and detection of their period in a quasihydrodynamic model provides us a data about the density and composition of the ring matter of the required typical viscosity caused the structure with the given wavelength. It should be noted that the complex wavelet–transform is much better one for such an analysis than the other window transformation. This is due to the fact that, owing to the self-similarity property of the analyzing wavelet, in any frequency range one and the same typical oscillation numbers is packed on the window width. Moreover, elimination by the described method of a high-frequency component (this means near zero scales) allows to denoise a signal. Finally, aperiodic spots in the wavelet–image allows to detect structures in the form of narrow dense rings (i.e. ringlets).
Acknowledgments
The authors would like to thank Prof. N.Brilliantov for valuable remarks and fruitful discussions.
References
- [1] Bendjoya Ph., PetitJ.-M. , Spahn F., 1993. Wavelet analysis of the Voyager data on planetary rings. I - Description of the method. Icarus 105, 385-399.
- [2] Esposito L.W., 2002. Planetary rings. Rep. Prog. Phys. 65, 1741–1783.
- [3] Griv E., Gedalin M. The Fine-scale spiral structure of low and moderately high optical depth regions of Saturn s main rings: A review. Planetary and Space Science. 2003. V. 51. P. 899-927.
- [4] Haase M., 2000. A family of complex wavelets for the characterization of singularities. In: Paradigms of Complexity. M.M.Novak (Ed.). World Scientific, Singapore, pp. 287-288.
- [5] Horn L.J., Cuzzi J.N., 1996. Characteristic Wavelengths of Irregular Structure in Saturn’s B Ring. Icarus 119, 285–310.
- [6] Jerri A., The Gibbs Phenomenon in Fourier Analysis, Splines and Wavelet Approximations. Kluwer Academic Publishers, 1998.
- [7] Mallat S., 1999. A Wavelet Tour of Signal Processing. Academic Press.
- [8] Michtchenko T.A., Nesvorný D., 1996. Wavelet analysis of the asteroidal resonant motion. Astron. Astrophys. 313, 674–678.
- [9] Porco C.C. et al., 2005. Cassini Imaging Science: Initial Results on Saturnч’s Rings and Small Satellites. Science 307, 1226-1236.
- [10] Postnikov E.B., 2006. Evaluation of a Continuous Wavelet Transform by Solving the Cauchy Problem for a System of Partial Differential Equations. Comp. Math. Math. Phys. 46, 73–-78.
- [11] Postnikov E.B., Loskutov A., 2005a. Wavelet transform and diffusion equations: applications to the processing of the ”Cassini” spacecraft observations. http://www.arxiv.org/abs/astro-ph/0502375.
- [12] Postnikov E.B., Loskutov A., 2005b. Analysis of Small-Scale Wave Structures in the Saturnian A Ring Based on Data from the Cassini Interplanetary Spacecraft. J. Exp. Theor. Phys. 101, 646-652.
- [13] Poularikas A. (Ed.), 2000. The transforms and applications handbook. CRC Press, IEEE Press, US.
- [14] Skeel R.D., Berzins M. 1990. A Method for the Spatial Discretization of Parabolic Equations in One Space Variable. SIAM J. Sci. and Stat. Comput., 11, 1–32.
- [15] Schmit U., Tscharnuter W.M., 2001. Viscous Overstability in Saturn’s B-Ring. II. Hydrodynamic Theory and Comparison to Simulations. Icarus 138, 173–187.
- [16] Shu F.H., Cuzzi J.N., Lissauer J.J., 1983. Bending Waves in Saturn Rings. Icarus 53, 185–206.
- [17] Shu F.H., Yuan C., Lissauer J.J., 1985. Nonlinear spiral density waves: inviscid theory. Astroph. Journal 291, 356-376.
- [18] Shu F.H., Yuan C., Lissauer J.J., 1985. Nonlinear spiral density waves: viscous damping. Astroph. Journal 299, 542-573.
- [19] Spilker L.J., Pilorz S, Lane A.L et al. 2004. Saturn A ring surface mass densities from spiral density wave dispersion behavior. Icarus 171, 373–390.
- [20] Thiessenhusen K.-U., Esposito L.W., Kurths J., Spahn F. 1995. Detection of Hidden Resonances in Saturn’s B Ring. Icarus 113, 206-212.
- [21] Vela-Arevalo L.V. 2002. Time-Frequency Analysis Based on Wavelets for Hamiltonian Systems. PhD thesis. Caltech, 2002.