INTEGRAL and XMM-Newton observations of LSI +61∘ 303
Abstract
LSI +61∘ 303 is one of the few X-ray binaries with Be star companion from which both radio and high-energy gamma-ray emission have been observed. We present XMM-Newton and INTEGRAL observations which reveal variability of the X-ray spectral index of the system. The X-ray spectrum is hard (photon index ) during the orbital phases of both high and low X-ray flux. However, the spectrum softens at the moment of transition from high to low X-ray state. The spectrum of the system in the hard X-ray band does not reveal the presence of a cut-off (or, at least a spectral break) at 10-60 keV energies, expected if the compact object is an accreting neutron star. The observed spectrum and spectral variability can be explained if the compact object in the system is a rotation powered pulsar.
keywords:
pulsars : individual: LSI +61∘ 303 – X-rays: binaries – X-rays: individual: LSI +61∘ 3031 Introduction
The Be star binary LSI +61∘ 303 is one of the few X-ray binaries (along with PSR B1259-63 and LS 5039) from which radio and very high-energy gamma-ray emission is observed. Radio emission from the system is highly variable and shows periodicity of days, which can be associated with the binary orbital period (Gregory et al., 2002). Radio observations reveal the presence of 100 AU-scale jet in the system which places LSI +61∘ 303 among the Galactic micro-quasars (Massi et al., 1993, 2004). The system is also a Galactic ”micro-blazar” due to its association with 100 MeV gamma-ray source 2CG 135+01 (Tavani et al., 1998) visible up to TeV energies (Albert et al., 2006).
Mendelson & Maseh (1989) found an optical modulation in the V-band with the same periodicity as the radio periodicity. This is confirmed by Paredes et al. (1994); the optical modulation in the V-band is about 0.15 mag. Optical data allow to constrain the orbital parameters of the system revealing the eccentricity of the orbit, (Casares et al., 2005). However, the measurements are not sufficient to determine the nature of the compact object (neutron star or black hole), because the inclination of the orbit is poorly constrained.
The X-ray emission from LSI +61∘ 303 is also variable and has nonthermal spectrum. Since the discovery, the system was twice monitored simultaneously in the X-ray and radio bands over a single orbital cycle (Taylor et al., 1996; Harrison et al., 2000). These simultaneous observations show that X-ray emission peaks almost half an orbit before the radio. In both X-ray and radio bands the orbital phases of maxima of the flux ”drift” from orbit to orbit.
Two major types of models of radio-to-X-ray activity of LSI +61∘ 303 were proposed in the literature. Models of the first type, first introduced by Taylor & Gregory (1984) assume that activity of the source is powered by accretion onto the compact object. In the second class of models, first proposed by Maraschi & Treves (1981), the activity of the source is explained by interactions of a young rotation powered pulsar with the wind from the companion Be star.
If the system is an accreting neutron star or black hole, one expects to find a cut-off powerlaw spectrum in the hard X-ray band. The cut-off energy is normally at keV (White et al., 1983; Filippova et al., 2005) for neutron stars and at keV for black holes (McClintock & Remillard, 2003) (the cut-off can move to even higher energies in the ”high/soft” state see e.g. (2006)). Of course, it is possible that the emission from the ”central engine” of the micro-blazar LSI +61∘ 303 is ”masked” by the emission from the jet, which can be beamed toward an observer on Earth, similarly to what is observed in blazars. In this case the hard X-ray spectrum of the source is a superposition of the powerlaw jet emission and emission from the accretion disk. If the jet and accretion contributions to the X-ray spectrum are comparable, then emission from the accretion disk should at least produce an observable spectral feature (e.g. a bump, a break or turnover) in the 10-100 keV energy band.
Below we present a study of LSI +61∘ 303 in the 0.5-100 keV energy band with XMM-Newton and INTEGRAL which shows that the spectrum of the source is well fit by a simple powerlaw, without any signature of high-energy cut-off. Moreover, the X-ray powerlaw matches smoothly to the higher-energy spectrum in the 100 keV – 10 MeV band found with the CGRO instruments OSSE (Tavani et al., 1996) and COMPTEL (van Dijk et al., 1996). The broad band spectrum of the source does not exhibit a cut off up to at least GeV energies. The spectrum of LSI +61∘ 303 in the X-ray – soft gamma-ray band is thus very different from the typical spectra of accreting neutron stars and black holes.
Contrary to accreting compact object models, a featureless powerlaw keV – MeV spectrum is expected in the ”rotation powered pulsar” scenario. Unfortunately, the population of X-ray binaries with a rotation powered pulsars as compact objects is not so rich as that of accreting pulsars. In fact, the only firmly established example of X-ray binary with a young radio pulsar as a compact object, PSR B1259-63 (Johnston et al., 1992), exhibits a featureless powerlaw spectrum in the X-ray band which smoothly continues to the higher energies, exactly as in LSI +61∘ 303. Moreover, the overall spectral energy distributions and variability properties of the two systems are qualitatively very similar: large radio outbursts which occur once per orbit, similar X-ray spectra and high-energy gamma-ray emission extending up to the TeV energy band. Recent observations of PSR B1259-63 during its 2004 periastron passage (Chernyakova et al., 2006) show that the X-ray emission from the system is most probably produced via inverse Compton scattering of the UV radiation from the Be star by the pulsar wind electrons, the same mechanism as proposed by Maraschi & Treves (1981) for LSI +61∘ 303
The XMM-Newton and INTEGRAL observations of LSI +61∘ 303 reported here, reveal the variability of the X-ray spectrum of the system during the transition from high to low X-ray state. We find that the spectra of the system in high and low X-ray states are very similar, but during the transition to the low flux state the spectrum softens. It turns out that explanation of such behavior of the system is not trivial and, in fact, the shape and variability of the spectrum put tight constraints on the injection mechanism of high-energy electrons responsible for the X-ray emission as well as on the geometry of the X-ray emission region.
This paper is organized as follows: in Section 2 we describe the details of the INTEGRAL and XMM-Newton data analysis. The results (imaging, spectral and timing analysis) are presented in Section 3. In Section 4 we discuss the physical implications of the results for the synchrotron – inverse Compton broad band model of the source. This gives us the possibility to constrain physical parameters of the system and develop a physical model of the source which we study in more details in Section 5. Finally, we summarize our findings in Section 6.
2 Observations and Data Analysis
2.1 INTEGRAL observations
Since the launch of INTEGRAL (Winkler et al., 2003) on October 17, 2002, LSI +61∘ 303 was several times in the field of view of the main instruments during the routine Galactic plane scans and pointed observations (see Table 1 for details). Most of the times the distance of the source from the center of the field of view was too large to use the X-ray monitor JEM-X. Therefore IBIS/ISGRI (Lebrun et al., 2003) is the only instrument we can use in our analysis of this source. In this analysis we have used the version 5.1 of the Offline Science Analysis (OSA) software distributed by the ISDC (Courvoisier et al., 2003).
In our analysis we have used all available public data spread over the period from the January 2003 (rev 25) until March 2005 (rev 288). Overall we have analyzed 600 science windows which resulted in an effective vignetting corrected exposure of 273 ksec.
In order to study the spectral variations of the source we have grouped the data into three parts covering orbital phases 0.4 – 0.6, 0.6 – 0.8 and 0.8 – 0.4 (see Table 1). The spectral analysis was done with the use of the mosaic_spec tool, which extracts spectra for a given sky position from mosaic sky images.
| Data | Orbital phase | Effective | 20-60 keV Flux | |
|---|---|---|---|---|
| Set | Exposure (ks) | ergs s-1cm-2 | ||
| I1 | 0.4 – 0.6 | 50 | 3.8 | 1.7 |
| I2 | 0.6 – 0.8 | 23 | 3.0 | 3.6 |
| I3 | 0.8 – 0.4 | 200 | 2.4 | 1.4 |
| I | 273 | 2.5 | 1.6 |
∗ Given errors represent 68% confidence interval uncertainties.
2.2 XMM-Newton observations
XMM-Newton has observed LSI +61∘ 303 with the EPIC instruments five times during 2002. Four observations have been done during the same orbital cycle, and the fifth one has been done seven months later. The log of the XMM-Newton data analyzed in this paper is presented in Table 2.
| Data | Observational | Date | MJD | Orbital | Exposure (ks) |
|---|---|---|---|---|---|
| Set | ID | (days) | Phase | MOS1/MOS2/PN | |
| X1 | 0112430101 | 2002-02-05 | 52310 | 0.55 | 5.8/5.8/5.0 |
| X2 | 0112430102 | 2002-02-10 | 52315 | 0.76 | 5.8/5.8/5.0 |
| X3 | 0112430103 | 2002-02-17 | 52322 | 0.01 | 1.5/1.5/5.0 |
| X4 | 0112430201 | 2002-02-21 | 52326 | 0.18 | 7.0/7.0/5.1 |
| X5 | 0112430401 | 2002-09-16 | 52533 | 0.97 | 6.2/6.2/6.0 |
The XMM-Newton Observation Data Files (ODFs) were obtained from the on-line Science Archive111http://xmm.vilspa.esa.es/external/xmm_data_acc/xsa/index.shtml; the data were then processed and the event-lists filtered using xmmselect within the Science Analysis Software (sas) v6.0.1. In all observations the source was observed with the PN detector in the Small Window Mode, and with MOS1 and MOS2 detectors in the Full Frame Mode. In all observations a medium filter was used.
The event lists for spectral analysis were extracted from a 40′′ radius circle at the source position for MOS1, from a 30.0′′ radius circle for MOS2, and for PN a region of 25′′ around the source position was chosen. Background photons were collected from a region located in the vicinity of the source with the same size area as the one chosen for the source photons.
For the spectral analysis, periods affected by soft proton flares need to be filtered out. To exclude them we have used script xmmlight_clean.csh 222http://www.sr.bham.ac.uk/xmm2/xmmlight_clean.csh. The source countrate in 2 – 10 keV energy range varied from about 0.03 to 0.06 cts/s for MOS instruments, and from 0.05 to 0.10 cts/s for PN. With the help of the GRPPHA FTOOL we have re-binned the spectra, so that each energy bin has at least 30 counts.
Data from MOS1, MOS2 and PN detectors were combined in the spectral analysis to achieve better statistics.
3 Results
3.1 Imaging Analysis
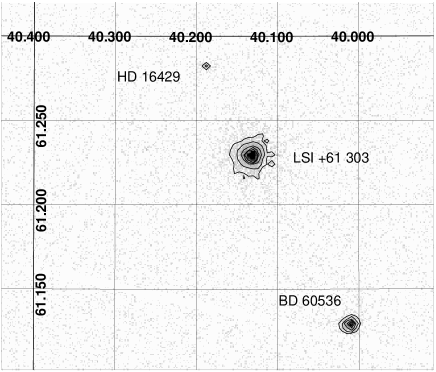
Three sources were clearly detected in the XMM-Newton field of view during its LSI +61∘ 303 observation program (see Fig. 1 for the contour plot of XMM-Newton field of view for the MJD 52310 (X1) observation). Besides LSI +61∘ 303 itself we have detected two more sources that were also detected by ROSAT, and were identified as two optical sources BD +60 536, and HD +16 429 by Goldoni & Mereghetti (1995). In the X-rays BD +60 536 has also been detected by ASCA in 1994 (Leahy et al., 1997). HD +16 429 has also been observed in radio during deep VLA observations of the LSI +61∘ 303 field (Marti et al., 1998).
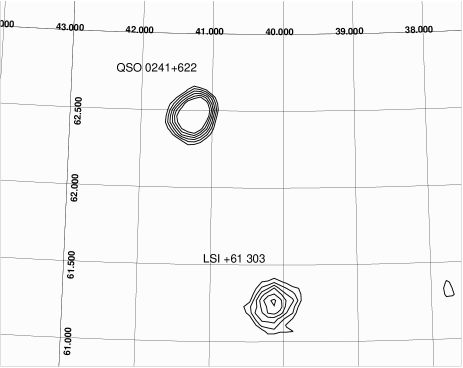
The presence of a quasar QSO 0241+622 some away from LSI +61∘ 303 was a problem for the previous (non-imaging) observations of LSI +61∘ 303 above 20 keV. Careful analysis of RXTE/HEXTE data allowed Harrison et al. (2000) to distinguish the two sources. The imaging capabilities of the INTEGRAL (several arcminutes angular resolution) allow, for the first time, to clearly separate the two sources. Both sources are clearly seen in the 22.1-63.2 keV INTEGRAL mosaic of the field (Fig.2), at 8.1 (LSI +61∘ 303), and 12.7 (QSO 0241+622) detection level. QSO 0241+622 is several times brighter than LSI +61∘ 303. BD +60 536, and HD +16 429 detected by XMM-Newton are too faint to be observed with INTEGRAL.
3.2 Timing analysis
Most previous papers on LSI +61∘ 303 have defined the radio phase according to the ephemeris of either Taylor & Gregory (1984), or Gregory et al. (1999). In the current paper we use the latest ephemeris of the system derived by Gregory et al. (2002) ( d, =JD 2,443,366.775). This allows a consistent treatment of current and historical observations. Optical observations allowed Casares et al. (2005) to build an orbital solution of the LSI +61∘ 303 system. This solution constrains the periastron phase to , and the eccentricity of the system .
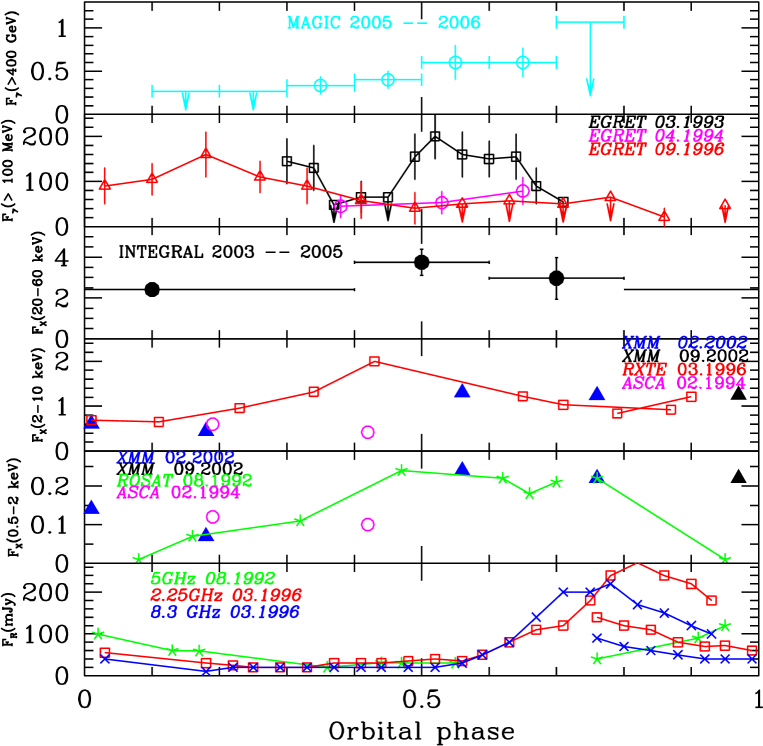
Third, forth and fifth (from the top) panels of Fig. 3 show the dependence of the 20-60 keV, 2-10 keV and 0.5-2 keV X-ray fluxes on the orbital phase. Besides the new INTEGRAL and XMM-Newton data we show in this Figure all available archival data from ASCA (Leahy et al., 1997), RXTE and ROSAT (Harrison et al., 2000).
To allow straightforward comparison with the data in other energy bands we also show in Fig. 3 the lightcurves of the source in the broad (radio-to-gamma-ray) energy interval. The uppermost panel shows the highest energy (TeV) lightcurve reported in Albert et al. (2006). The second panel shows the EGRET (GeV) data (Tavani et al., 1998). Finally, the bottom panel of Figure 3 shows radio data simultaneous to RXTE and ROSAT observations (Harrison et al., 2000).
In agreement with previous observations the 2-10 keV flux during XMM-Newton observations was observed to be variable with phase. It was rather low at zero phase, reached its minimum at periastron (near phase 0.2), and became approximately three times higher at phases larger than 0.5. Comparison of the X-ray and radio lightcurves of different years shows that the X-ray flux from the system varies in a more regular way than the radio flux: the X-ray data points from different orbital cycles lie more-or-less on the same curve, with the only exception of the second ASCA point.
3.3 Spectral Analysis
The spectral analysis was done with NASA/GSFC XSPEC software package. In Fig. 4 the XMM-Newton spectra for the X1, X3 and X4 observations , as well as the average INTEGRAL spectrum of the source are shown. We do not show the spectra of observations X2 and X5 because they are very similar to that of X1.

For comparison we also give in this Figure the 20-100 keV spectrum of QSO 0241+622 (the nearby source which was difficult to distinguish from LSI +61∘ 303 in earlier non-imaging observations). The spectrum of QSO 0241+622 is well fitted by a powerlaw with the photon index and 20-100 keV flux erg/(cm2s). The source did not show any variability during the 2-year period of INTEGRAL observations.
A simple power law with photoelectric absorption describes the spectrum of LSI +61∘ 303 well, with no evidence for any line features. In Table 3 we present the results of the three parameter fits to the XMM-Newton data in the 0.5 – 10 keV energy range. The uncertainties are given at the statistical level and do not include systematic uncertainties. The values for the flux and the powerlaw index were obtained assuming that the hydrogen column density was the same for all the datasets. The value cm-2 was found from the simultaneous fit of all the 5 XMM-Newton datasets.
The graphical representation of the evolution of the spectral parameters along the orbit is given in Figure 5 which includes soft X-ray from XMM-Newton and ASCA observations (top panel), and averaged radio data obtained by Ray et al. (1997) with the National Radio Astronomy Observatory Green Bank Interferometer (GBI) (bottom panel).
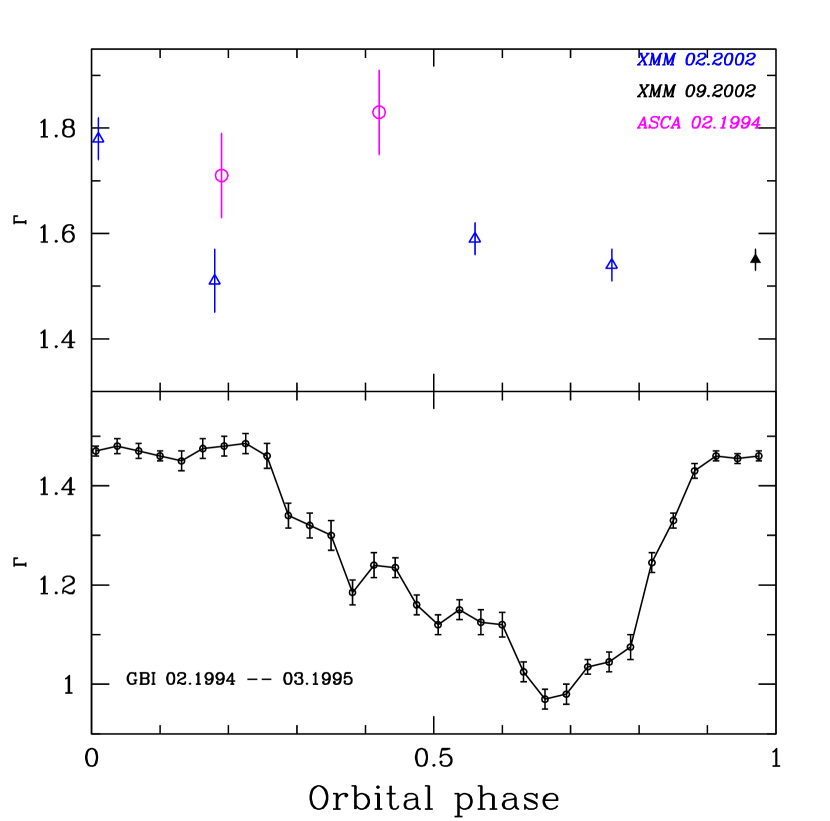
In the XMM-Newton energy band the powerlaw photon index is in all the observations except for the observation X3 where we find significantly softer spectrum with . This indicates that the X-ray spectrum softens during the transition from higher to lower flux state.
| Data | (2-10 keV) | (dof) | ||
|---|---|---|---|---|
| Set | erg s-1 | ( cm-2) | ||
| X1 | 1.30 | 1.60 | 0.49 | 474(456) |
| X2 | 1.24 | 1.54 | 0.49 | 440(446) |
| X3 | 0.61 | 1.78 | 0.49 | 184(188) |
| X4 | 0.44 | 1.52 | 0.49 | 137(150) |
| X5 | 1.25 | 1.55 | 0.49 | 488(496) |
∗ Given errors represent 68% confidence interval uncertainties.
4 Broad band spectrum of the source.
The rich multiwavelength variability properties of the system, presented in Figs. 3, 4, 5 suggest that the physical model of the system which is able to explain all the observed spectral variations should be very restrictive. However, up to now most of the model building for the source concentrated on explaining the details of either radio or X-ray or gamma-ray variability, paying little attention to the broad-band properties of the source.
As mentioned in the introduction, historically there are two broad classes of physical models of the source activity. The first one assumes that the activity is powered by accretion onto the compact object (either neutron star or a black hole) (Taylor & Gregory, 1984). Accreting X-ray binaries with a Be star companion constitute the majority of the Galactic high-mass X-ray binaries (Ziolkowski, 2002). Most of the Be star X-ray binaries contain an accreting neutron star as the compact object and most of them are transient sources. The spectra of these sources are characterized by the presence of an exponential cut-off in the hard X-ray band at energies 10-60 keV (White et al., 1983; Filippova et al., 2005). Our analysis of the INTEGRAL data shows that in the case of LSI +61∘ 303 no high-energy cut-off is found at the energies below 100 keV, the fact that does not fit well into the ”conventional” accretion scenario. It is possible that in the case of LSI +61∘ 303 emission from the accretion disk is ”masked” by the emission from the jet, which can have a simple powerlaw spectrum. If accretion flow and jet would give comparable contributions in the hard X-ray band, one would still expect to observe a spectral feature between 10 and 100 keV which would result from the disappearance of the accretion component at higher energies. The non-observation of such feature in our data indicates that the luminosity of the accretion flow in LSI +61∘ 303 is much lower than the observed X-ray luminosity, erg/s. Since, by assumption, the source activity (including the jet) is powered by accretion, the large apparent luminosity of the jet ( erg/s, of the order of the gamma-ray luminosity) can be explained by a large beaming factor of the jet, .
Radio observations suggest that the jet is moderately relativistic, with the speed . It is presumably precessing and the angle with respect to the line of sight varies from (Massi et al., 2001) to (Massi et al., 2004). This implies that the Doppler factor of the jet, , varies in the range along the orbit. If the high gamma-ray luminosity of the source during a fraction of the orbit is explained by the large Doppler factor of the jet (), one would expect that the jet contribution drops during the orbital phase with the low Doppler factor. In this case the ”accretion” contribution would show up in the low X-ray flux state. However, our data show that the spectrum of the source is well fit by a featureless powerlaw with the same photon index both in the high and low X-ray states. It is not impossible that the accretion component is, similarly to jet component, modelled by a powerlaw, but in this case the coincidence of the photon indexes in the high and low flux states implies an artificial ”fine tuning” of parameters. Although we find little support for the accretion model in our data, further multiwavelength observations are necessary to better constrain the Doppler factor and the hard X-ray spectral properties of the source low state.
The timing and spectral properties in the keV-MeV energy band favor the second class of models, which assume that the system activity is powered by the rotation energy of a relatively young radio pulsar (Maraschi & Treves, 1981). At least one more Be star X-ray binary which is powered in this way is known, namely, PSR B1259-63. In fact, the spectral properties of PSR B1259-53 system are very similar to the LSI +61∘ 303: strong radio flares and non-thermal X-ray and gamma-ray emission are detected during the periods of pulsar passing through the disk of the Be star (Johnston et al., 2005; Chernyakova et al., 2006; Aharonian et al., 2005). In the model of Maraschi & Treves (1981) the radio emission is the synchrotron emission from the pulsar wind electrons while the X-rays are produced via the inverse Compton scattering of the soft photons from the Be star by the same electrons. Roughly the same conclusion was deduced from the recent XMM-Newton observations for PSR B1259-63 (Chernyakova et al., 2006). The main differences between the two systems are that (a) the pulsar itself was never detected in the case of LSI +61∘ 303 and (b) in the case of PSR B1259-63 no AU-scale jets were seen (one should note that PSR B1259-63 is in the Southern hemisphere where no VLBI observations are available).
In the case of the ”young pulsar” scenario, radio, X-ray and gamma-ray emission come from the region where the pulsar wind interacts with the wind of Be star. The high-energy particles responsible for the synchrotron and inverse Compton emission can either originate from the relativistic pulsar wind or be accelerated in the shock formed at the interface of the stellar and pulsar wind.
In the inverse Compton model of X-ray emission the soft photons upscattered to the X-ray energies are the UV photons emitted from the Be star. If the distance from the X-ray emission region to the star is , the energy density of UV photons at the location of the pulsar can be estimated as
| (1) |
where is the luminosity of the Be star. Relativistic electrons upscatter the UV photons up to energies
| (2) |
where is the temperature of the Be star. Apart from producing inverse Compton emission in the X-ray band, the 1-10 MeV electrons emit radio synchrotron radiation. The typical frequency of the synchrotron photons is
| (3) |
where is the magnetic field strength in the emission region. In the synchrotron – inverse Compton model the ratio of the radio and X-ray luminosities of the system, , is equal to the ratio of the energy densities of magnetic field,
| (4) |
to the energy density of radiation (1):
| (5) |
The last relation imposes a restriction on the possible values of magnetic field in the emission region. Taking into account that the distance from Be star to the compact companion is constrained by the binary orbit parameters roughly in the limits and taking the observed ratio , the magnetic field is constrained to be
| (6) |
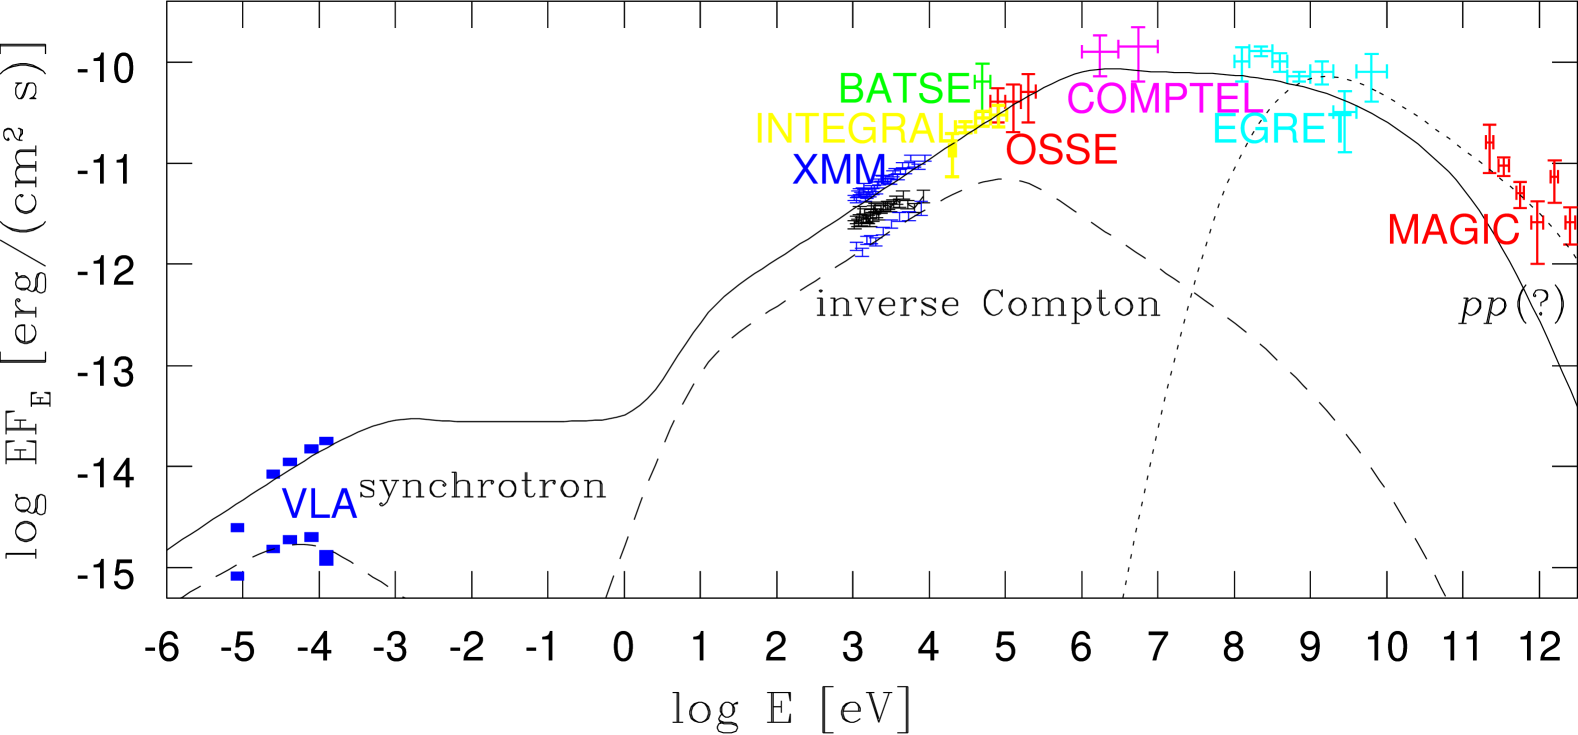
An example of synchrotron – inverse Compton model fit of the broad band (radio to gamma-ray) spectrum of the source is shown in Fig. 6. The model parameters used for the fits of the broad band spectrum of the system in high (low) flux state in Fig. 6 are G ( G), the electron spectrum described by a broken powerlaw with the spectral index below the break energy MeV ( eV) and () above the break energy. In the case of low radio state the break is at a bit lower energy and the electron spectrum is softer above the break energy, to fit the radio spectrum of the source which clearly exhibits a cut-off at GHz frequencies. One can see that in this case the inverse Compton spectrum softens at the energies keV.
It is interesting to note that even if the electron spectrum extends to energies higher than 10 GeV, one still expects to observe a softening of the gamma-ray spectrum at 10 GeV energy because above this energy the inverse Compton scattering proceeds in the Klein-Nishina regime and if the electron spectrum is a powerlaw with the spectral index , the inverse Compton spectrum below 10 GeV is a powerlaw with the photon index () while above 10 GeV the spectrum softend to roughly . The spectrum above 400 GeV measured by MAGIC telescope (Albert et al., 2006) is indeed softer than the EGRET spectrum in the GeV band. This can be an indication of transition to the Klein-Nishina regime. However, the observed softening is less than expected in this case and it is possible that emission above 100 GeV is dominated by another mechanism (e.g. by pion decay gamma-rays, as suggested by Romero et al. (2005)). We come back to this possibility in Section 5.
The X-ray luminosity of the system is several orders of magnitude higher than radio luminosity. This enables to conclude that the inverse Compton energy loss always dominates over the synchrotron energy loss. Indeed, the inverse Compton cooling time is
| (7) |
while the synchrotron cooling time is
| (8) |
Factor of 10 variations of the inverse Compton (X-ray) luminosity of the source can be produced if the typical distance from the emission region to Be star varies by a factor of 3. This is smaller than the variations of the distance from the compact object to Be star, estimated from the eccentricity of the binary orbit. But, in fact, in the models of interaction of the pulsar wind with the stellar wind from the companion star the bulk of emission from the system is supposed to come from the shock region at the contact surface of the two winds, which is situated in between the star and the compact object and possibly extends to the distances larger than the binary separation.
In order to explain the observed spectral properties of the source, one has to compare the inverse Compton cooling time to the escape time from the emission region. Several velocity scales are present at the interface of stellar and pulsar winds. If the pulsar wind mixes with the stellar wind, the escape of the high-energy particles could be slowed down to the velocity of the ”slow” equatorial wind from Be star, cm/s. The same estimate of the escape velocity is obtained if the high-energy particles are stellar wind particles accelerated in the shock at the interface with the pulsar wind. To the contrary, if the two winds flow along the contact surface without significant mixing, the escape velocity of the pulsar wind particles is comparable to the speed of light, cm/s. Correspondingly, two different scenarios are possible: that of a ”slow escape”, with the escape time s and that of a ”fast escape”, with s.
In the case of ”slow escape”, the inverse Compton emission should be produced by the cooled electron population. For a powerlaw distribution of electrons, the steady state spectrum has a photon index which is softer than the spectral index of injection spectrum, . The observed photon index in X-ray band is . This implies that , which means that the injection spectrum should be very hard, . Such spectrum hardly can be produced by shock acceleration at the contact surface of pulsar and stellar winds. Thus, in the ”slow escape” scenario the only possibility is that electrons are initially injected only at high energies (that is, they originate from the cold pulsar wind with large bulk Lorentz factor) and the inverse Compton cooling would leads to the formation of ”universal” cooling spectrum with , regardless of the details of the injection spectrum at high energies.
In the case of ”fast escape” the high-energy electrons also originate in the pulsar wind (by assumption). In this case the inverse Compton cooling time at 1-100 keV energies is comparable to the escape time and, in the case of powerlaw injection spectrum, one expects to observe a ”cooling break” (softening by ) at the energy at which the escape time is equal to the cooling time. From the model fit to the broad-band spectrum, shown in Fig 6, one can see that a break could be situated at the energies above MeV (electron energies MeV) which is, in principle, compatible with the ”fast escape” scenario. In fact, the ”fast escape” scenario is not so different from the ”slow escape” one, because the spectrum of the high-energy electrons from the pulsar wind with large Lorentz factor has a low-energy cut-off. Escaping electrons cool down only to the characteristic energy MeV in the direct vicinity of the pulsar and Be star. As a result, 100 MeV electrons are injected in a larger region around the binary system and continue to cool (at a longer time scale) forming a characteristic powerlaw spectrum below 100 MeV.
The observations presented in the previous sections clearly reveal the softening of the spectrum during the decrease of the X-ray luminosity. The softening of the spectrum can be explained assuming that the injection of electrons at high energies drops and higher energy electrons (emitting in the hard X-ray band) cool faster than the low energy ones (emitting in the soft X-ray band). Note that this explanation implies that the size of the region from which the bulk of X-ray emission comes is at least cm, otherwise the inverse Compton cooling time (7) would be too short to explain the softening on day time scale.
Although radio and X-ray emission are produced by the same population of electrons, they are not necessarily produced in the same spatial region. The strongest synchrotron emission is produced in the region with higher magnetic field which is situated in the direct vicinity of the pulsar, while the strongest inverse Compton emission is produced in the region with highest soft photon background density, which is situated close to the companion star. This means that, in general, one does not expect a strong correlation of the X-ray and radio lightcurves. Taking into account the fact that 10-100 MeV electrons can propagate over a significant distance during the inverse Compton cooling time (7), the detailed modelling of the X-ray and radio lightcurves requires numerical simulations, which would take into account (somewhat uncertain and time-variable) geometrical properties of the system, such as, e.g., the geometry and density profile of the equatorial disk of Be star and its inclination to the orbital plane. We leave this for the future work.
5 Physical model of the source.
The above modeling of the broad-band spectrum of the system shows that the physical model of the source (which we assume to be based on the ”young pulsar powered source” model, see above) should explain several key features derived from the analysis of radio, X-ray and gamma-ray data.
In particular, we have seen that the X-ray spectrum and spectral variability are satisfactory explained if the relativistic electrons responsible for the X-ray emission are initially injected at high energies and subsequently cool down forming the characteristic cooling spectrum. The physical model should provide an explanation for the electron injection only at high energies. The analysis of the radio and X-ray variability of the system shows that the injection of high-energy electrons should be variable.
Injection from high energies can be explained if the electrons responsible for the X-ray emission originate from the cold pulsar wind with bulk Lorentz factor . In this case all electrons have initial energies larger than 100 MeV and the electron spectrum below 100 MeV formed in the process of inverse Compton cooling has the spectral index . However, an immediate difficulty with such simple injection model is that the injection rate is not expected to vary with time, contrary to what is observed.
The variable injection rate could be provided if relativistic protons are either present in the pulsar wind or accelerated in the shock at the contact surface of pulsar and stellar wind. Such relativistic protons could interact with the low energy protons from the disk and produce injection of electrons at energies above MeV via production and subsequent decays of charged pions. The pion production cross section is cm2. The life time of high-energy protons in the disk with the density cm-3 is s, comparable with the escape time from the disk. This means that (a) protons can efficiently transmit their energy to the products of pion decay (gamma-rays, neutrinos, electrons) during their propagation through the disk, (b) proton-proton interactions can provide the source for injection of 10-100 MeV electrons over the large AU-size region, from which the bulk of X-ray emission supposedly comes and (c) variable injection rate of high-energy electrons is explained by the variations in the density of the stellar wind protons along the pulsar orbit.
A straightforward consequence of high-energy proton interactions in the Be star disk is the appearance of additional component in the high-energy -ray spectrum, resulting from the two photon decays of neutral pions. The spectrum of the pion decay gamma-rays in the GeV-TeV energy band has the same spectral index as the spectrum of the high-energy protons. In Fig. 6 we show possible contribution to the -ray spectrum of the source which can be produced in result of proton-proton interactions.
If the system activity is powered by a young pulsar, the pulsar should be also responsible for the formation of the 100 AU scale jet in the system. The fact that rotation powered pulsars can produce jets is beyond doubt, since such jets are observed in the pulsar wind nebulae of e.g. Crab and Vela pulsars. In the case of the pulsar interacting with the wind of companion star a formation of even more complicated extended emission features which can immitate the jets is possible (Dubus, 2006). However, no ”immitation” of the jet is really needed, because the mechanism of formation of the jet in the system of a young pulsar interacting with a stellar wind can be the same as in the system of a young pulsar interacting with interstellar medium. The naive qualitative estimate shows that anisotropic power injection into the stellar wind should, in general, lead to the formation of an outflow from the system with parameters close to the expected physical parameters of the jet. Indeed, the total energy which is injected during the escape time scale is erg. Such kinetic energy transmitted to a volume of the size of about the thickness of the disk, cm with the density cm-3 (total mass is g pushes the matter in the volume to move with the speed
| (9) |
This velocity is of the order of the velocity of the fast polar wind from Be star and is much larger than the typical velocity inside the disk, cm/s. Qualitatively, it is possible that (anisotropic) injection of large kinetic energy of the pulsar wind into the disk is responsible for the formation of a jet-like outflow (or ”expanding bubbles” implied in the models of radio flares) from the disk in which relativistic protons and electrons from the pulsar wind are mixed with the low-energy protons from the disk. The proton-proton interactions resulting in production of pions which subsequently decay and inject high-energy electrons can continue also in the outflow thus providing a mechanism of injection of high-energy electrons at larger scales up to the scale of the AU jet observed in the system.
6 Summary.
In this paper we have presented the INTEGRAL and XMM-Newton observations of LSI +61∘ 303. We have found that the overall spectrum of the system in 0.5-100 keV band is well fit by a featureless powerlaw with the photon index both in the high and low flux states. The 0.5-100 keV powerlaw spectrum matches smoothly the higher-energy spectrum of the source in 100 keV – GeV band. The powerlaw with the same photon index seems to continue without a cut-off up to 1-10 MeV energies. Non-observation of a cut-off or a break in the spectrum at 10-100 keV energies, typical for the accreting neutron stars and black holes, implies that the accretion in the source proceeds at a very low (if not zero) rate. This favors the scenario in which the compact object is a rotation-powered pulsar. We have discovered that the spectrum is hard in both high and low X-ray states, but softens during the transition from the high flux to the low flux state. The spectral characteristics of the system favor the model in which electrons are initially injected at high energies and subsequently cool to lower energies forming the characteristic ”cooling” spectrum with the spectral index . We have proposed a model in which cold relativistic pulsar wind (electron and/or proton loaded) with the bulk Lorentz factor provides a source of X-ray emitting electrons. Such relativistic wind penetrating into the Be star disk can also be responsible for the formation of jet-like outflow from the system.
7 Acknowledgments
The authors acknowledge useful discussions with F. Aharonian, I. Kreykenbohm, J. Rodriguez, M. Türler and V.Bosch-Ramon.
References
- Aharonian et al. (2005) Aharonian F. et al., A&A, 442, 1
- Albert et al. (2006) Albert J., et al., 2006, Science, in print [astro-ph/0605549]
- (3) Belloni T., et al., 2006, MNRAS, 367, 1113.
- Campana et al. (1995) Campana S., Stella L., Mereghetti S., Colpi M., 1995, A&A, 297, 385.
- Casares et al. (2005) Casares J., Ribas I., Paredes J.M., Marti J., Allende Prieto C., 2005, MNRAS, 360, 1105
- Chernyakova et al. (2006) Chernyakova M., Neronov A., Lutovinov A., Rodriguez J., Johnston S., 2006, MNRAS, 367, 1201.
- Courvoisier et al. (2003) Courvoisier T.J.-L., et al. 2003, A&A, 411, L53.
- Dubus (2006) Dubus G., 2006, accepted to A&A, astro-ph/0605287
- Filippova et al. (2005) Filippova, E. V., Tsygankov, S. S., Lutovinov, A. A., Sunyaev, R. A., 2005, Astr. Lett., 31, 729.
- Goldoni & Mereghetti (1995) Goldoni P. & Mereghetti S., 1995, A&A, 299, 751
- Gregory et al. (2002) Gregory P.C. 2002, ApJ, 575, 427
- Gregory et al. (2002a) Gregory P.C. Neish C., 2002a, Ap.J., 580, 1133
- Gregory et al. (1999) Gregory P.C., Peracaula M., Taylor A.R., 1999, ApJ, 520, 376
- Johnston et al. (1992) Johnston S., Manchester R.N., Lyne A., Bailes M., Kaspi V. M., Qiao Guojun, D’Amico N., 1992, ApJ ,387, L37
- Johnston et al. (2005) Johnston S., Ball L., Wang N., Manchester R. N., 2005, MNRAS, 358, 1069
- Harrison et al. (2000) Harrison F., Ray P.S., Leahy D., Waltman E.B., Pooley G.G., 2000, ApJ, 528, 454
- Leahy et al. (1997) Leahy D., Harrison F., Yoshida A., 1997, ApJ, 475, 823
- Lebrun et al. (2003) Lebrun F., Leray J., Lavocat P., et al., 2003, A&A 411, 141
- Lipunov & Nazin (1981) Lipunov V.M., Nazin S.N., 1994, A& A, 289, 822
- Maraschi & Treves (1981) Maraschi L., Treves A., 1981, MNRAS, 194, 1P
- Marti et al. (1998) Marti J., Peracaula M., Paredes J.M., Massi M., Estalella R., 1998, A&A, 329, 951
- Massi et al. (1993) Massi M., Paredes J.M., Estalella R., Felli M., 1993, A&A, 269, 249
- Massi et al. (2001) Massi M., Ribo M., Paredes J.M., Peracaula M., Estalella R., 2001, A&A, 376, 217
- Massi et al. (2004) Massi M., Ribo M., Paredes J.M., Garrington S.T., Peracaula M., Marti J. 2004, A&A, 414, L1.
- Mendelson & Maseh (1989) Mendelson H., Maseh T., 1989, MNRAS, 239, 733.
- McClintock & Remillard (2003) McClintock J.E., Remillard R.A., 2003, in Compact Stellar X-ray Sources, eds. W.H.G. Lewin and M. van der Klis, Cambridge University Press (astro-ph/0306213).
- Ray et al. (1997) Ray P.S., Foster R.S., Waltman E.B., Tavani M., Ghigo F.D., 1997, Ap.J. 491, 381.
- Romero et al. (2005) Romero G.E., Christiansen H. R., Orellana M., 2005, Ap.J., 632, 1093
- Strickman et al. (1998) Strickman M. S., Tavani M., Coe M. J., Steele I. A., Fabregat J., Marti J., Paredes J. M., Ray P. S., 1998, Ap.J. 497, 419.
- Taylor & Gregory (1984) Taylor A.R., Gregory P.C., 1984, ApJ, 283, 273
- Taylor et al. (1996) Taylor A.R., Young G., Peracaula M., Kenny H.T., Gregory P.C., 1996, A&A, 305, 817.
- Tavani et al. (1998) Tavani M., Kniffen D., Mattox J.R., Paredes J.M., Foster R. S., 1998, ApJ, 497, L89
- Tavani et al. (1996) Tavani M. et al., 1996, A&AS, 120, 243.
- van Dijk et al. (1996) van Dijk R., et al., 1996, A&A, 315, 485.
- Winkler et al. (2003) Winkler C., et al., 2003, A&A 411, 1.
- White et al. (1983) White N., Swank J., Holt S. 1983, ApJ 270, 711
- Ziolkowski (2002) Ziolkowski J., 2002, Mem. Soc. Astron. Ital., 73, 1038.