Mass-dependent Color Evolution of Field Galaxies Back to Over the Wide Range of Stellar Mass
Abstract
We use deep multi-band optical and near-infrared data for four general fields, GOODS-South, HDF North/South, and IRAC UDF in GOODS-North to investigate the evolution of the observed rest-frame color of field galaxies as a function of the stellar mass evaluated by fitting the galaxy spectral models to the observed broad-band SEDs. In these four fields, the color distributions of the galaxies at each mass and redshift interval are very similar. At , we found that more massive galaxies always tend to have a redder color. High- and low-mass galaxies exhibit quite different color evolutions. As seen in our previous study in HDF-N, the color distribution of low-mass (MM⊙) galaxies becomes significantly bluer with an increase in the redshift. This evolution of the average color can be explained by a constant star formation rate model with . On the other hand, the average color of high-mass galaxies (M M⊙) evolves more strongly at a high redshift. Such mass-dependent color distribution and its evolution indicate that galaxies with a larger stellar mass appear to have shorter star-formation timescales, and on an average, they form the larger fraction of their stars in the earlier epoch.
Subject headings:
galaxies: evolution — galaxies: formation — galaxies: high-redshift1. Introduction
Stellar mass is one of the most important quantities of galaxies that facilitate the understanding of their formation and evolution. The evolution of the number density of galaxies as a function of the stellar mass conveys the overall history of star formation and the mass assembly process in the universe. Many authors have investigated such evolution of the stellar mass distribution function back to (e.g., Dickinson, Papovich, Ferguson, & Budavári, 2003, Bell et al., 2003, Fontana et al., 2004, Drory et al., 2004, Drory et al., 2005).
On the other hand, the study of properties such as the spectral energy distribution (SED), colors, and line fluxes of galaxies as a function of the stellar mass at various epochs helps us to understand star formation histories in additional detailed, such as, in what manner the star formation occurs in low- and high-mass galaxies and how it contributes to the growth of their stellar mass. In the case of local galaxies detected in the Sloan Digital Sky Survey, Heavens et al. (2004) and Jimenez et al. (2005) argued that most of the stars in the present-day massive galaxies have been formed at a high redshift, while star formation histories of low-mass galaxies have relatively longer timescales. In more direct observations of high-redshift galaxies, Cowie et al. (1996) originally found that the mass of the galaxies undergoing rapid star formation has been declining smoothly with a decrease in the redshift. Recently, Juneau et al. (2005) also investigated the stellar mass dependence of star formation rates of galaxies at using the Gemini Deep Deep Survey data. They found the trend to be similar to that predicted in the studies of local galaxies (Heavens et al., 2004). Similar results are obtained in the studies on the evolution of specific star formation rates back to 1-1.5 (Brinchmann & Ellis, 2000, Bauer et al., 2005, Feulner et al., 2005a). Very recently, Feulner et al. (2005b) extended the analysis to , and found that a similar trend continues even at a higher redshift.
The samples in these previous studies, however, are too shallow to reach a sufficiently low mass range below M⊙, a characteristic “transition” mass (Kajisawa and Yamada 2005, and Section 4 below), or are biased toward objects with typically low M/L ratios, such as more actively star-forming bluer populations due to the lack of very deep near-infrared (NIR) data. The evolution of low-mass galaxies is, however, important to understand the overall picture of galaxy evolution not only because they may be the building blocks of more massive galaxies but also because they are more sensitive probes to understand the thermal history of the universe.
In Kajisawa and Yamada (2005, hereafter referred to as KY05), we investigated the evolution of the rest-frame color and morphology distribution of the galaxies in HDF-N as a function of the stellar mass back to over a wide range of stellar masses down to M⊙. We found that the behavior of the rest-frame color distribution and its dependence on the stellar mass change at around M⊙. In addition, we discovered that the sequence of the color distribution of low-mass galaxies systematically becomes bluer with the redshift, while the colors of high-mass galaxies do not show a significant redshift evolution. However, the area of the HDF-N data used in our analysis was only 3.5 arcmin2, and it was inferred that the effect of field-to-field variation was large.
Therefore, in this paper, we have extended the study area of KY05 to include some other fields, GOODS-S (Giavalisco et al., 2004), a part of the IRAC Ultra Deep Field in GOODS-N (Dickinson et al., 2003b), and FIRES (HDF-South, Labbé et al., 2003). Using the deep optical and NIR data for these fields, we investigate the rest-frame color evolution of galaxies at as a function of the stellar mass. These data allow us to extend our previous analysis to a larger sample in order to study the evolution of galaxies with a high statistical accuracy. We used the Vega magnitude system throughout the paper.
2. Data & Source Detection
We used multi-band optical and NIR data in the four fields, GOODS-S, FIRES, HDF-N, and a part of IRAC UDF in GOODS-N. For HDF-N, we used the same data as those used in KY05 (HST/WFPC2, HST/NICMOS, Subaru/CISCO, UBVIJHK set). For GOODS-S, we used the publicly available VLT/ISAAC ver1.5 data (JHK-bands) and HST/ACS ver1.0 data (bviz, Giavalisco et al. 2004). For FIRES, we used the publicly available HST/WFPC2 VLT/ISAAC data (UBVIJHK, Labbe et al. 2003).
For IRAC UDF in GOODS-N, we observed a field in the and bands using the Subaru Telescope equipped with CISCO (Motohara et al. 2002) on March 10, 2003. The field of view (FOV) used in the analysis was 1.74’ 1.74’, and the total exposure time in the and bands was 14780 and 3880 s, respectively. The data were reduced using the IRAF software package, as described in KY05. The publicly available GOODS HST/ACS ver1.0 data (bviz) were also used in the field.
For all the fields, we independently performed source detection in the -band images using the SExtractor image analysis package (Bertin & Arnouts, 1996). We adopted MAG_AUTO from SExtractor as the total magnitude of the detected objects. The SED (colors) was measured in the optimal-S/N aperture size for each galaxy (see KY05 for details). We excluded regions with lower sensitivity, such as the edge region of each ISAAC FOV for GOODS-S, from our analysis. The areas in the analyses were 94 arcmin2 for GOODS-S, 3.0 arcmin2 for IRAC UDF, 3.4 arcmin2 for HDF-N, and 4.1 arcmin2 for FIRES. We performed simulations using the IRAF/ARTDATA package to quantify the depth of each field. The 90% completeness limit for the point source is 21.8-22.6 (21.4 for one FOV) for GOODS-S, for IRAC UDF, for HDF-N, and for FIRES.
3. Analysis
Using these optical and NIR photometric data, we measured the redshift, the stellar mass, and the rest-frame color of each galaxy in the same manner as that in KY05. When possible, we used the spectroscopic redshifts from literature (Szokoly et al., 2004, Le Fèvre et al., 2004, Vanzella et al., 2005, Wirth et al., 2004, Cohen et al., 2000, Labbé et al., 2003). For objects without spectroscopic identification, we estimated the photometric redshifts using the publicly available “hyperz” code (Bolzonella et al. 2000) in the same manner as that in KY05; however, for FIRES, we used the publicly available phot-z catalogue (Labbé et al., 2003).
After the redshifts were determined, we performed a detailed SED fitting with the GALAXEV synthetic library (Bruzual & Charlot, 2003) in order to measure the stellar mass and the rest-frame color of the galaxies. We assumed IMF of Chabrier (2003), exponentially decaying SFR, and the extinction law of Calzetti et al. (2000). The free parameters were the age, star formation timescale, color excess, and metallicity. The fitting results were used to estimate the M/L ratio (and subsequently, the stellar mass) and measure the K-correction values for the rest-frame colors. The parameter range of dust extinction is E() , and the median of the best-fitted values is 0.13 (about 75% of the samples had E() ). Additional details of the procedures and the discussion on the uncertainty of the mass and color evaluation are described in KY05. It should be noted that although each parameter such as dust extinction, stellar age, or star formation timescale is not constrained very tightly, the stellar mass can be estimated with a relatively low uncertainty. This is because the effects of these parameters tend to cancel out in the estimation of the stellar mass, as discussed in KY05 (see also Papovich, Dickinson, & Ferguson, 2001 for a detailed discussion). In addition, note that the rest-frame color is measured from the observed photometric data without extrapolation. Therefore, the stellar mass and the color used in the current analysis are robust quantities.
4. Results & Discussion
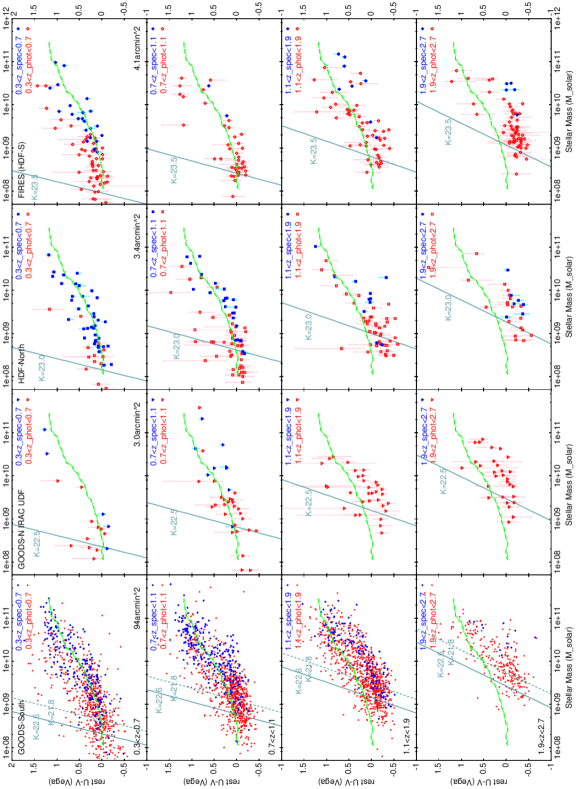
In Figure 1, for each of the four fields, we plotted the rest-frame color of the K-selected galaxies in each redshift bin as a function of the stellar mass. First, we can see from this figure that the color distributions of the galaxies in the four fields are very similar. For reference, we estimated the weighted mean colors with a bin of 0.15 dex of the GOODS-S sample at (in the top-left panel), and plotted them in all the panels by dotted-dash lines. The color is always very blue for M M⊙ and becomes redder as the stellar mass increases toward M⊙. Most of the galaxies with M M⊙ have the reddest color.
In fact, it is evident from Figure 1 that over the entire redshift range at , the more massive galaxies always have the redder color. For example, while most of the galaxies with M M⊙ have at any redshift, many objects with M M⊙ have . This trend is consistent with the results found in Feulner et al. (2005b) and other previous studies. If we observe the redshift evolution in Figure 1 more closely, we notice the gradual bluing of the color along the redshift within the mass range of M M M⊙. While this systematic evolution of the rest-frame color distribution of low-mass galaxies has already been reported in KY05 for HDF-N, it is now confirmed by the larger sample that includes three other different fields.
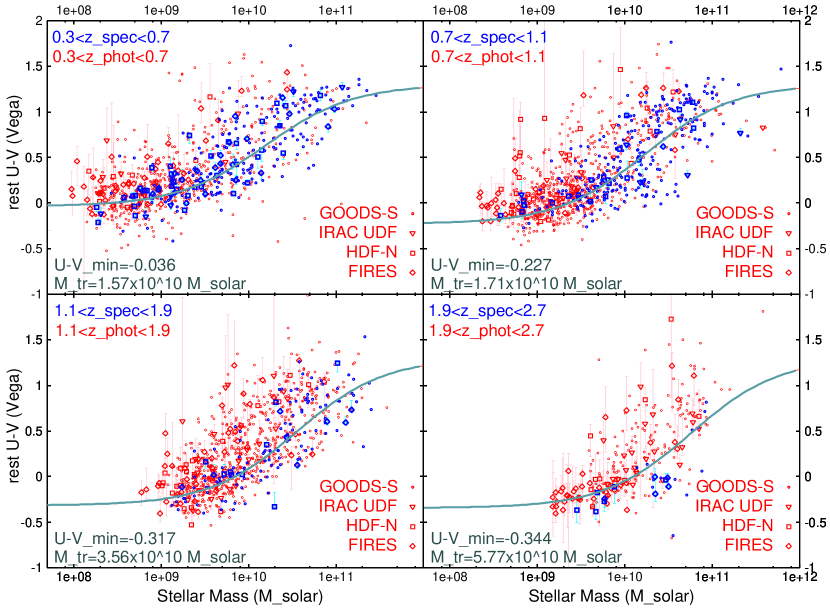
In Figure 2, we try to quantify the observed mass-dependent color evolution by using an analytical fitting function. The data for all the four fields are combined. We excluded the lowest mass galaxies in each field from the sample so that the color bias near the detection limit (solid lines in Figure 1) does not affect the fitting significantly; the limiting masses are set so that the -band source detection completeness at is 50%. These limiting stellar masses are tabulated in Table 1. Considering the shape of the mass-weighted average color profile in GOODS-S (the top-left panel in Figure 1), we chose a hyperbolic tangent as the fitting function. This was in keeping with Baldry et al. (2004) who used a similar form to quantify the bimodality in the color-magnitude distribution of the SDSS sample. The fitting function is written as follows:
| Redshift | GOODS-South | IRAC UDF | HDF-N | FIRES |
|---|---|---|---|---|
| 0.3-0.7 | 1.4-3.3 | 1.8 | 1.1 | 6.6 |
| 0.7-1.1 | 4.2-10 | 5.5 | 3.5 | 2.0 |
| 1.1-1.9 | 1.2-2.9 | 1.6 | 1.0 | 5.8 |
| 1.9-2.7 | 3.1-7.6 | 4.1 | 2.6 | 1.5 |
=
where and are the asymptotic minimum and maximum
values of
the rest-frame color at the low- and high-mass ends.
Mtr and represent the mass and mass range at which the color
transition occurs. For simplicity, we fixed and , which seem to
change little with the redshift in our sample, to the values fitted at
(, ). Next, we fitted the color
distribution in each redshift bin by changing the values of Mtr and
. The result is shown by the solid lines in Figure
2. The
best-fitted values of the parameters are M
M⊙ and
at , M M⊙ and
at , M M⊙ and
at , M M⊙ and
at .
These results again show that the color at the low-mass end
gradually evolves blueward with the redshift. In addition, the
transition mass also seems to increase along the redshift, although
the uncertainty is relatively large. It is noteworthy that Bundy et al. (2006)
also recently discovered similar transition mass increments
with the redshift at in the study using the DEEP2 data.
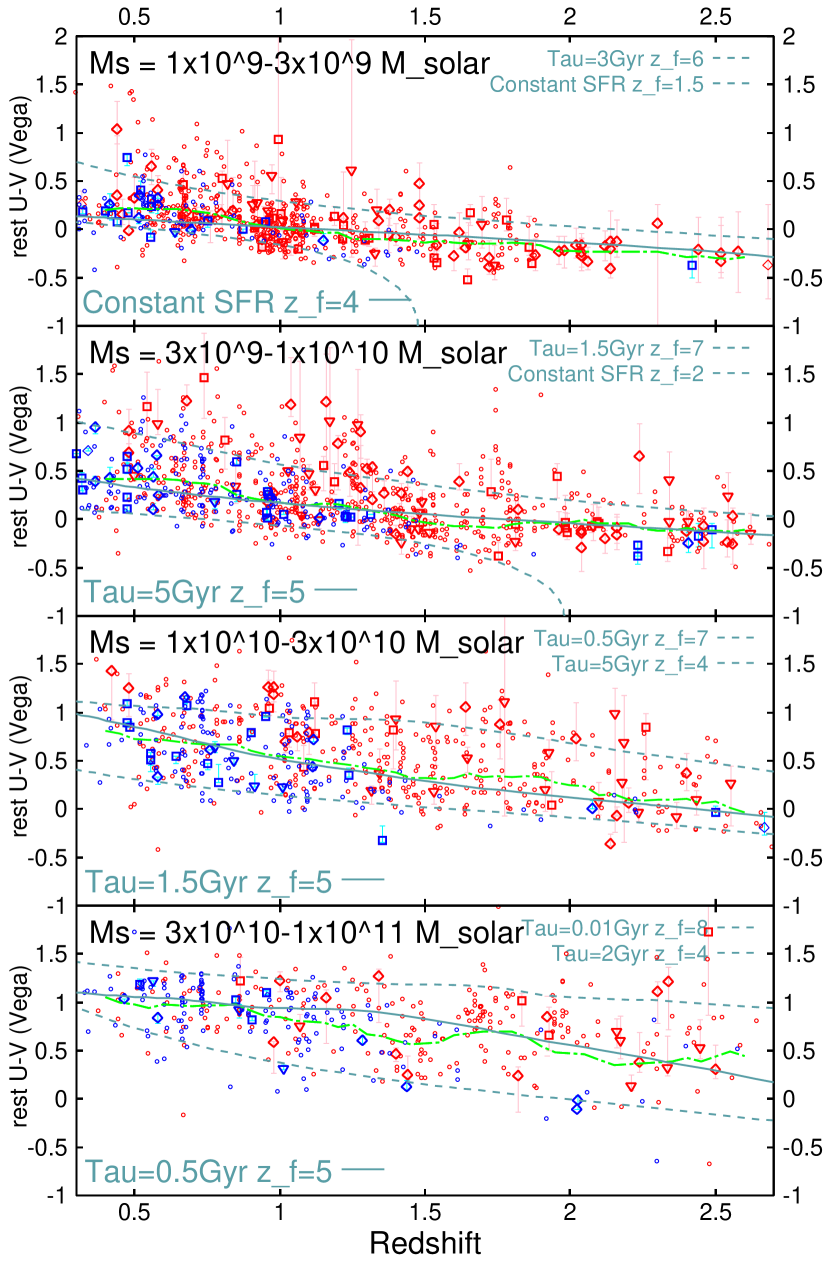
Figure 3 shows the evolution of the rest-frame color at each stellar mass range for the combined data. We plotted the weighted average colors binned over the redshift range of 0.15 (dotted-dash lines). In the top panel, it is more clearly evident that the color distribution of the galaxies with M M⊙ becomes gradually bluer with an increase in the redshift. In KY05, we discussed that the star formation activity in these low-mass galaxies occurs rather continuously since they exhibit a very blue color at any redshift. A bluer color even at a higher redshift also suggests younger average ages of the galaxies at 2-3. In the lower panels, we see that the colors of galaxies with a larger stellar mass also become bluer at a high redshift. There seems to be a trend where the more massive populations show a stronger color evolution at a high redshift, which in fact corresponds to the evolution of the transition mass found in Figure 2.
We try to fit such color evolutions using GALAXEV population synthesis models with simple star formation histories. We simply consider an exponentially decaying SFR and assume solar metallicity and no dust extinction. We estimate the color for the model grid with the star formation timescale 0.01, 0.05, 0.1, 0.5, 1, 1.5, 2, 3, 5, 15, and (constant SFR) Gyr and the formation redshift 3, 4, 5, 6, 7, and 8. Eventually, we found that mainly affects the overall slope of the color evolution, and strongly affects the color at a high redshift (e.g., ). The resultant best-fit models and their and values are shown in Figure 3. It is found from the results that the more massive populations appear to have a shorter star formation timescale. In other words, they form the larger fraction of their stellar contents at a high redshift. Such a trend is very similar to the concept of mass-dependent star formation histories argued by Heavens et al. (2004). Further, the trend is also consistent with the studies on mass-dependent evolutions of specific star formation rates at a high redshift (Feulner et al., 2005b, Juneau et al., 2005). However, in this study, the trend is depicted by more directly observable quantities.
In these analyses, it is important to check the effect of the color bias near the detection limit. The bias against a red high-M/L population is expected to be severe, especially for low-mass galaxies at a high redshift since the -band filter samples relatively short rest-frame wavelengths. We finally discovered, however, that our deep -selected samples do not suffer considerably from the bias. It is true that our 50% completeness limit at could neglect some fractions of relatively red low-mass galaxies in the highest redshift bin. However, the color distribution tends to concentrate at considerably bluer values (), and there is few galaxies that are redder than , where the completeness is greater than 90%. This can be demonstrated by the lowest mass objects near the detection limit () in the highest redshift bin of the deepest FIRES data. For example, out of 20 galaxies with the stellar mass of M M M⊙ in the bin of FIRES, 19 galaxies have , and one galaxy has ; further, no galaxy has .
Indeed, a sample selection with very deep NIR data is essential not only for evaluating the stellar mass of galaxies but also for generating relatively unbiased samples to study the color distribution of these low-mass galaxies at a high redshift. For example, -band selections such as those used for the FORS Deep Field data in Feulner et al. (2005b) could introduce a severe color bias. The detection limit of in Feulner et al. (2005b) can only sample galaxies with for M M⊙ at . Such a selection does not reveal whether red galaxies exist.
In Figure 3, we found that the stronger color evolution of massive galaxies at a high redshift was explained by the exponentially decaying SFR models with 4-5, for which the star formation timescale decreases with mass. On the other hand, the evolution of the average color of low-mass ( M⊙) galaxies can actually be explained by the constant SFR model. However, the best-fit formation redshift occurs at , which is similar to those for high-mass galaxies. If this is true, the differences in the star formation histories among galaxies with different stellar masses are not mainly in the epochs when the star formation began, but rather, in the star formation efficiencies and/or mechanisms by which star formation activities are suppressed. The long star-formation timescale for low-mass galaxies can be caused by the self-regulation of star formation, for example, by a supernova feedback (Dekel & Birnboim, 2005). The mass dependence of the star formation efficiencies and suppression mechanisms can be related with processes such as the efficient exhaustion of gas reservoirs (e.g., Menci et al., 2005) or shock heating of cold gas during a major merger (Cox et al., 2004).
It is noteworthy that some of the assumptions in our analysis may be oversimplifications. If we consider dust extinction, the estimated formation redshift shifts to smaller values. For example, if we assume the extinction of E() (median-fitted value of our sample) for low-mass galaxies, the best-fit formation redshift of these galaxies shifts from to . We also verified which variations of star formation histories are permissible if the scatter of the colors around the average values is considered. To illustrate this, we plotted the GALAXEV models that trace the upper and lower envelopes of the color distribution by dashed lines in each panel in Figure 3.
Finally, we note that several other surveys have investigated the evolution of the stellar mass or luminosity function of field galaxies and found that the normalization decreases at (e.g., Fontana et al., 2004, Yamada et al., 2005, Caputi et al., 2006, Saracco et al., 2006). Several studies have also suggested mass-dependent number density evolution (e.g., Glazebrook et al., 2004, Drory et al., 2004, Drory et al., 2005). The next step is to consistently explain both the color (SED) evolution and the number density evolution as functions of the stellar mass.
References
- Baldry et al. (2004) Baldry, I. K., Glazebrook, K., Brinkmann, J., Ivezić, Ž., Lupton, R. H., Nichol, R. C., & Szalay, A. S. 2004, ApJ, 600, 681
- Bauer et al. (2005) Bauer, A. E., Drory, N., Hill, G. J., & Feulner, G. 2005, ApJ, 621, L89
- Bell et al. (2003) Bell, E. F., McIntosh, D. H., Katz, N., & Weinberg, M. D. 2003, ApJ, 585, L117
- Bertin & Arnouts (1996) Bertin, E. & Arnouts, S. 1996, A&AS, 117, 393
- Bolzonella, Miralles & Pelló (2000) Bolzonella, M., Miralles, J M. & Pelló, R. 2000, A&A, 363, 476
- Brinchmann & Ellis (2000) Brinchmann, J. & Ellis, R. S. 2000, ApJ, 536, L77
- Bruzual & Charlot (2003) Bruzual, G. & Charlot, S. 2003, MNRAS, 344, 1000
- Bundy et al. (2006) Bundy, K., et al., ApJ submitted, astro-ph/0512465
- Calzetti et al. (2000) Calzetti, D., Armus, L., Bohlin, R. C., Kinney, A. L., Koornneef, J., & Storchi-Bergmann, T. 2000, ApJ, 533, 682
- Caputi et al. (2006) Caputi, K. I., McLure, R. J., Dunlop, J. P., Cirasuolo, M., & Schael, A. M. 2006, MNRAS, in press astro-ph/0511571
- Chabrier (2003) Chabrier, G. 2003, ApJ, 586, L133
- Cohen et al. (2000) Cohen, J. G., Hogg, D. W., Blandford, R., Cowie, L. L., Hu, E., Songaila, A., Shopbell, P., & Richberg, K. 2000, ApJ, 538, 29
- Cowie et al. (1996) Cowie, L. L., Songaila, A., Hu, E. M., & Cohen, J. G. 1996, AJ, 112, 839
- Cox et al. (2004) Cox, T. J., Primack, J., Jonsson, P., & Somerville, R. S. 2004, ApJ, 607, L87
- Dekel & Birnboim (2005) Dekel, A. & Birnboim, Y. 2005, ApJ, submitted astro-ph/0412300
- Dickinson, Papovich, Ferguson, & Budavári (2003) Dickinson, M., Papovich, C., Ferguson, H. C., & Budavári, T. 2003, ApJ, 587, 25
- Dickinson et al. (2003b) Dickinson, M., Giavalisco, M., & The Goods Team 2003b, The Mass of Galaxies at Low and High Redshift, 324
- Drory et al. (2004) Drory, N., Bender, R., Feulner, G., Hopp, U., Maraston, C., Snigula, J., & Hill, G. J. 2004, ApJ, 608, 742
- Drory et al. (2005) Drory, N., Salvato, M., Gabasch, A., Bender, R., Hopp, U., Feulner, G., & Pannella, M. 2005, ApJ, 619, L131
- Feulner et al. (2005a) Feulner, G., Goranova, Y., Drory, N., Hopp, U., & Bender, R. 2005a, MNRAS, 358, L1
- Feulner et al. (2005b) Feulner, G., Gabasch, A., Salvato, M., Drory, N., Hopp, U., & Bender, R. 2005b, ApJ, 633, L9
- Fontana et al. (2004) Fontana, A., et al. 2004, A&A, 424, 23
- Giavalisco et al. (2004) Giavalisco, M., et al. 2004, ApJ, 600, L93
- Glazebrook et al. (2004) Glazebrook, K., et al. 2004, Nature, 430, 181
- Heavens et al. (2004) Heavens, A., Panter, B., Jimenez, R., & Dunlop, J. 2004, Nature, 428, 625
- Jimenez et al. (2005) Jimenez, R., Panter, B., Heavens, A. F., & Verde, L. 2005, MNRAS, 356, 495
- Juneau et al. (2005) Juneau, S., et al. 2005, ApJ, 619, L135
- Kajisawa & Yamada (2005) Kajisawa, M., & Yamada, T. 2005, ApJ, 618, 91 (KY05)
- Labbé et al. (2003) Labbé, I., et al. 2003, AJ, 125, 1107
- Le Fèvre et al. (2004) Le Fèvre, O., et al. 2004, A&A, 428, 1043
- Menci et al. (2005) Menci, N., Fontana, A., Giallongo, E., & Salimbeni, S. 2005, ApJ, 632, 49
- Motohara et al. (2002) Motohara, K., et al. 2002, PASJ, 54, 315
- Papovich, Dickinson, & Ferguson (2001) Papovich, C., Dickinson, M., & Ferguson, H. C. 2001, ApJ, 559, 620
- Saracco et al. (2006) Saracco, P., et al. 2006, MNRAS, in press astro-ph/0512147
- Szokoly et al. (2004) Szokoly, G. P., et al. 2004, ApJS, 155, 271
- Vanzella et al. (2005) Vanzella, E., et al. 2005, A&A, 434, 53
- Wirth et al. (2004) Wirth, G. D., et al. 2004, AJ, 127, 3121
- Yamada et al. (2005) Yamada, T., et al. 2005, ApJ, 634, 861