X-RAY PROPERTIES OF INTERMEDIATE-REDSHIFT GROUPS OF GALAXIES
Abstract
We have undertaken a multiwavelength project to study the relatively unknown properties of groups and poor clusters of galaxies at intermediate redshifts. In this paper, we describe the XMM-Newton observations of six X-ray selected groups with . The X-ray properties of these systems are generally in good agreement with the properties of low-redshift groups. They appear to follow the scaling relations between luminosity, temperature, and velocity dispersion defined by low-redshift groups and clusters. The X-ray emission in four of the six groups is also centered on a dominant early-type galaxy. The lack of a bright elliptical galaxy at the peak of the group X-ray emission is rare at low-redshifts, and the other two groups may be less dynamically evolved. We find indications of excess entropy in these systems over self-similar predictions out to large radii. We also confirm the presence of at least one X-ray luminous AGN associated with a group member galaxy and find several other potential group AGN.
1 INTRODUCTION
Most galaxies in the universe are members of groups of galaxies, making groups an important environment for the study of galaxy evolution (e.g. Tully 1987). In addition to being a more common environment for galaxies, different processes are at work in groups versus rich clusters. With their relatively low velocity dispersions, groups are ideal sites for galaxy-galaxy mergers (Barnes 1985; Merritt 1985). Many groups are also found to contain diffuse X-ray emission (e.g. Mulchaey et al. 1993; Ponman & Bertram 1993; Mulchaey et al. 2003; Osmond & Ponman 2004). This emission is extended on scales of hundreds of kiloparsecs, and group spectra indicate that the emission mechanism is thermal bremsstrahlung and line emission. The diffuse group medium is therefore analogous to the intracluster medium and indicates a deep potential well in these systems. However, here again groups may differ importantly from clusters, as non-gravitational heating and cooling may have a larger effect in groups. Studies of low-redshift groups have found a steepening of the relationship in the group regime (Helsdon & Ponman 2000 a,b; Ponman et al. 1996).
The label “group” is used to describe a very diverse population from loose associations of a few galaxies through poor clusters. X-ray emission, indicating a deep potential well, is found almost exclusively in groups with a significant fraction of early-type galaxies and generally in groups with a central, dominant early-type galaxy (Mulchaey & Zabludoff 1998; Mulchaey et al. 2003; Osmond & Ponman 2004). This observation offers both clues to galaxy evolution and a possible connection to rich clusters. In this paper, we concentrate on this X-ray emitting group population.
It is an open question how groups and the galaxies in them have changed with time. From an optically-selected group sample based on the CNOC2 survey, Wilman et al. (2005 a,b) find that number of star forming galaxies in groups increases with redshift to . On the X-ray side, Jones et al. (2002) studied a few intermediate-redshift groups with ROSAT and did not find evidence for evolution in the group X-ray luminosity function. Willis et al (2005) find a similar lack of evolution using early data from the XMM Large-Scale Structure Survey. We have undertaken a program to study in detail a sample of moderate-redshift (), X-ray selected groups. This study includes deeper X-ray data than previous studies of groups at these redshifts as well as HST imaging and ground based spectroscopy. X-ray selection provides both a method of finding groups at higher redshifts where their sparse galaxy populations are difficult to recognize and a well-defined selection criteria. Our sample and the initial spectroscopic follow-up are described elsewhere (Mulchaey et al. 2006; hereafter Paper I). Here we present the results of XMM-Newton observations of six of our groups. Throughout the paper, we assume a cosmology of km s-1 Mpc-1, , and .
2 SAMPLE
Here we describe the follow-up with XMM-Newton of five X-ray selected groups of galaxies with . A sixth group, RXJ1334+37, was found to lie off-axis in an archived XMM pointing. These observations are part of a detailed X-ray and optical study of intermediate-redshift groups; the full sample for this project is described in Paper I. In brief, groups were selected from objects in the ROSAT Deep Cluster Survey (RDCS; Rosati et al. 1998) with luminosities in the group regime and redshifts greater than 0.2. These groups generally represent the more luminous groups in the RDCS, and the sample is fairly complete above a redshift of 0.3. Figure 1 shows a comparison of the ROSAT and XMM fluxes of these groups. The fluxes are generally similar; they are within 30% with the exception of RXJ1648+60 where the ROSAT flux is most likely overestimated due to the presence of a bright point source in the group. Optical follow-up of these groups includes HST WFPC2 imaging and ground-based spectroscopy. Spectroscopy was obtained using the Palomar 200-inch and Las Campanas 100-inch telescopes, and deeper spectroscopy is now being obtained for these groups, including all of the groups with XMM observations, using Keck, Gemini-North and Magellan I. The optical data will be described in detail in future papers. Table 1 lists the six groups observed with XMM, their positions, and clean exposure times. The positions listed are the best-fit group centers from the surface brightness fits to the XMM data discussed in §4. The errors on these positions from the spatial fitting are less than about 3”, which is less than both the XMM PSF and the pixel size of the PN detector (4.1”). We also give the group redshifts and velocity dispersions derived from the Palomar, Las Campanas, and Keck data, as discussed in Paper I.

3 DATA REDUCTION
The six groups listed in Table 1 were observed with XMM-Newton between April 2001 and October 2004. All observations were taken in Full Frame mode with the thin optical blocking filter. The observation of RXJ0720+71 was split into three observations. We use only obs. ID 0012850701, because the other two observations were highly contaminated with background flares. RXJ1648+60 was observed twice with XMM. As discussed below, both of these observations had significant flaring, and for this group we merged the little time that was usable from the two observations. RXJ1334+37 was observed approximately six arcmins off-axis in a deep XMM pointing available in the archive. Similar concerns about flaring lead us to use only the first and third of the three observations of this pointing.
For the data reduction, we used versions 6.0 and 6.1 of the XMMSAS software. Observations processed with earlier versions of the software were reprocessed using the EPIC chain tasks. For EMOS data, we use only patterns 0-12 and apply the #XMMEA_EM flag filtering, and for EPN data, we use patterns 0-4 and flag equal to zero. Due to the time variability in the spectra of background flares (Nevalainen, Markevitch, & Lumb 2005), we filter for periods of high background in several energy bands. We first apply a cut on the high energy ( 10 keV) count rate of 0.35 cts s-1 for EMOS data and 1.0 cts s-1 for EPN data. This cut removes the most egregious flares. We then applied a 3 clipping to the source-free count rate in three energy bands, 0.5-2 keV, 2-5 keV, and 5-8 keV. Here time bins (bin size of 100 secs) with rates more than 3 away from the mean are removed recursively until the mean is stable. The remaining clean exposure times are listed in Table 1. Flaring is significant for RXJ1205+44 and RXJ0720+71 accounting for more than half of the total exposure. For RXJ1648+60, both observations are almost entirely during periods of high background, and the filtering on high-energy rate removes almost 60% of the total exposure for the MOS detectors and over 80% of the exposure for the PN detector. Investigation of the 0.5-2 keV, 2-5 keV, and 5-8 keV lightcurves reveal that the remaining exposures for both observations are also contaminated by flares; however, very little additional time is filtered by the 3 clipping, because the mean rate is biased high. In order to make some basic measurements for this group, we proceeded with the data remaining after the above filtering. In our analysis, we use a local background for both spatial and spectral fitting which should properly account for the high background in this group.
We chose to use account for the X-ray background using a constant background level estimated from our observations rather than the blank-sky event files (Lumb et al. 2002; Read & Ponman 2003). These files were processed with earlier versions of XMMSAS, and changes in the calibration mean that these files are not applicable to our data. To estimate the effect of possible spatial variations in the background on our fits, we repeated the spatial fits in Section 4 for a couple of the groups using the blank-fields and found that this change had little effect.
4 SPATIAL ANALYSIS
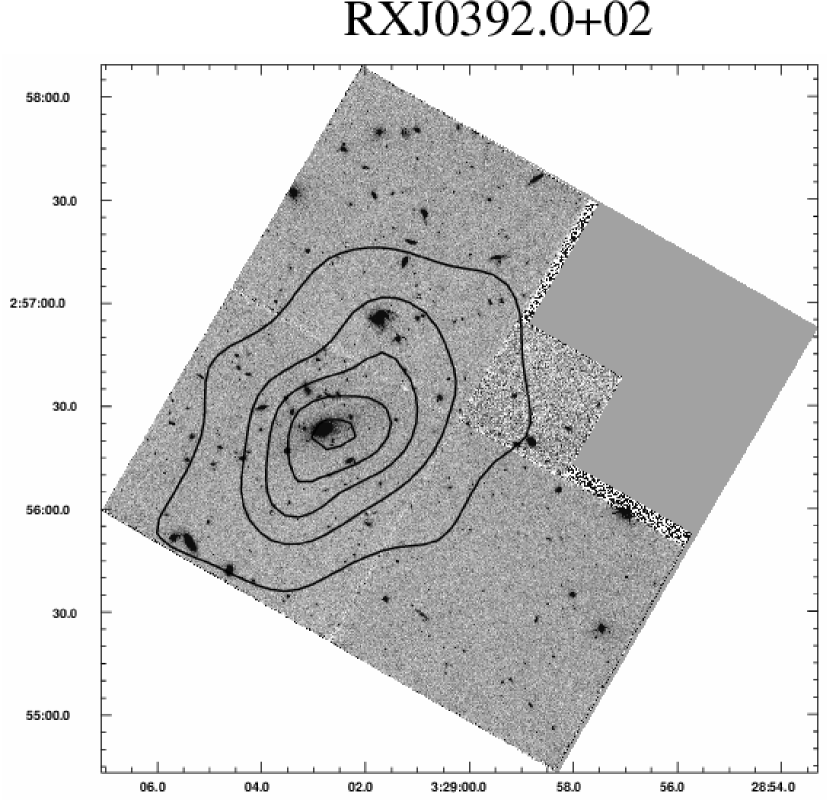
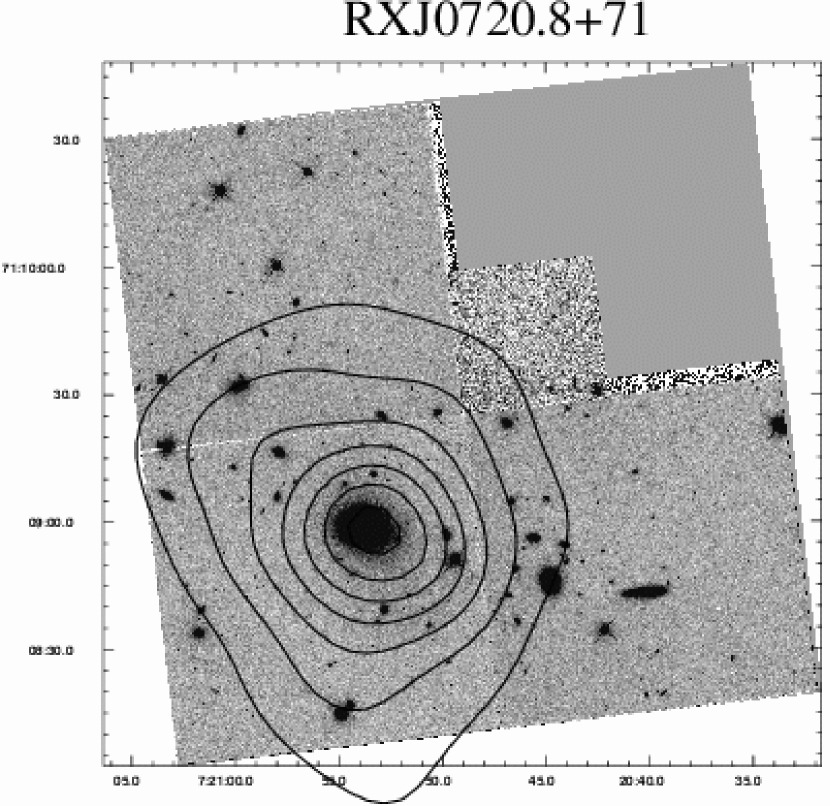
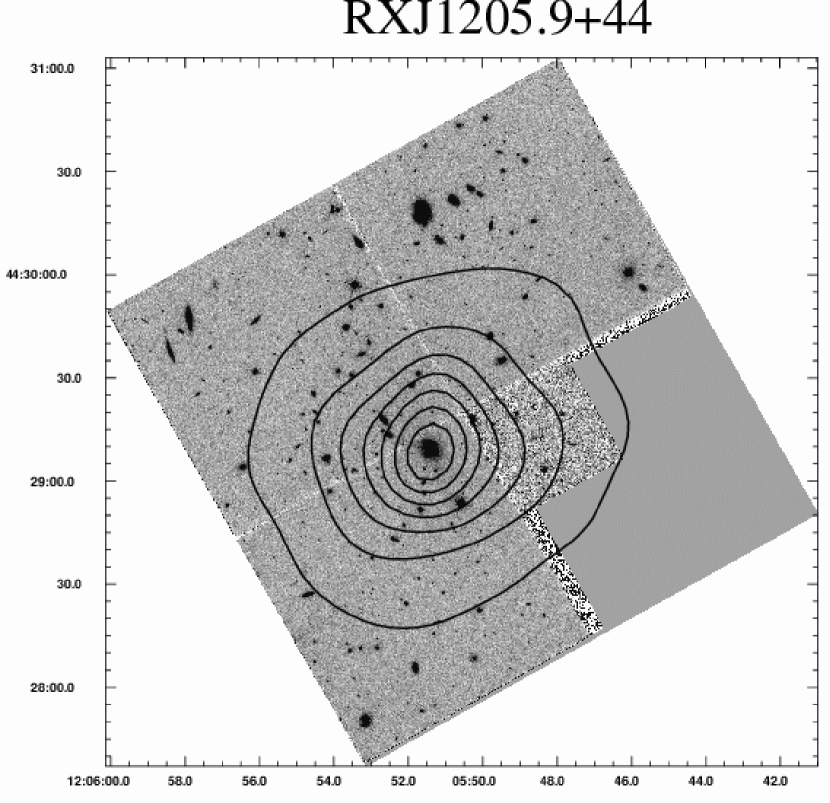
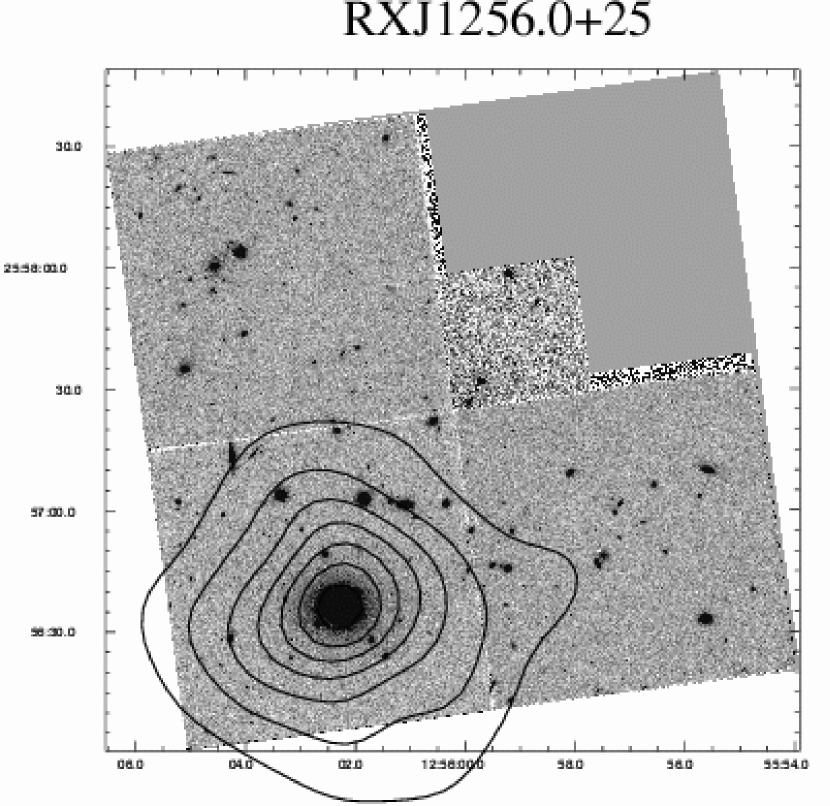
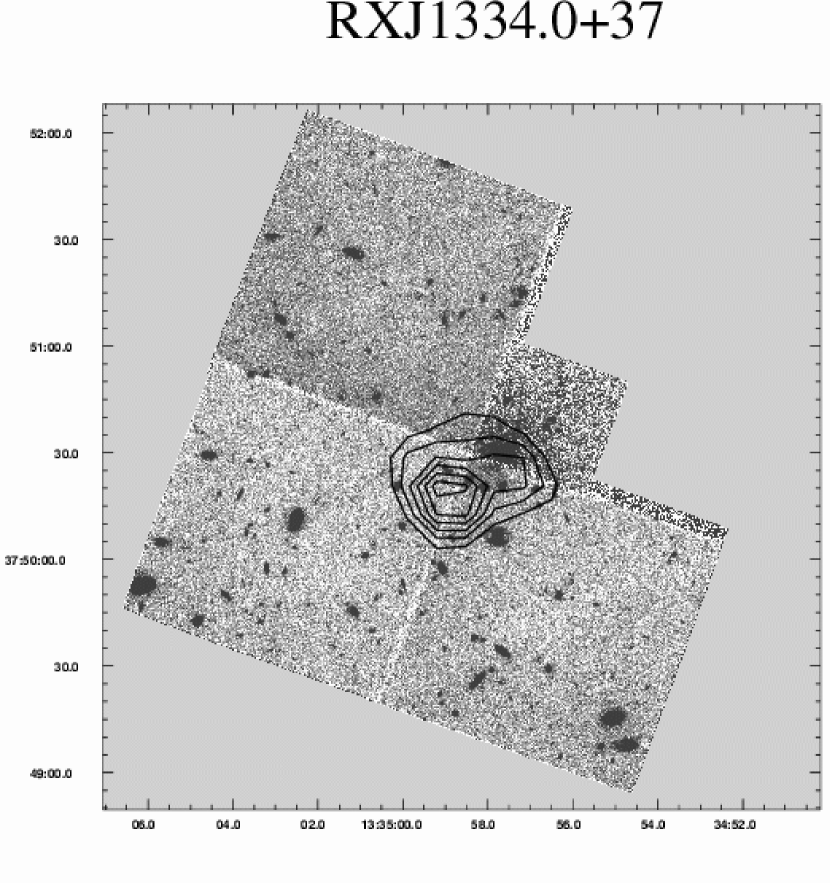
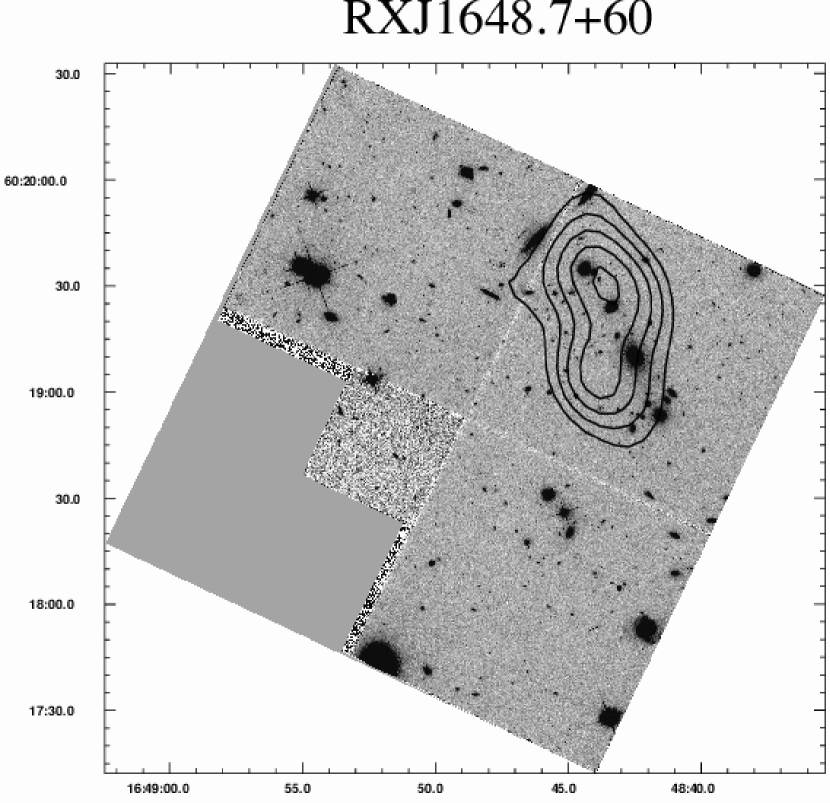
For each detector, we created images in the 0.5-4.5 keV band and binned to give 2” pixels. Point sources were detected in a merged image using the SAS task ewavelet and excluded from the analysis using a 25” radius region. Figures 2-7 show the contours from the adaptively smoothed MOS1+MOS2+PN image of each group, before exposure correction, overlaid on the HST WFPC2 image. Here point sources have been removed before smoothing and source holes filled using the CIAO tool dmfilth.
We correct for vignetting using an exposure map, which was found to give a similar correction to the photon weighting method (Arnaud et al. 2001) in this energy band. The exposure-corrected images were then merged to create a MOS1+MOS2+PN image of each group. This image was normalized by the average of the exposure times to recover the approximate number of counts. We also created mask images to exclude regions like chip gaps and bad pixels which had very little or no exposure. For RXJ1648+60 and RXJ1334+37, we combined the two observations by first merging the exposure-corrected images, normalized by the ratio of the exposure time to the total exposure time, for each detector separately and then adding the MOS1, MOS2, and PN images.
We fit the group emission to a two-dimensional -model, of the form
| (1) |
using SHERPA. The number of counts per pixel are small, so we fit using the maximum-likelihood based Cash statistic (Cash 1979). The model is convolved with an image of the XMM point spread function (PSF). PSF images for each detector were created using the EXTENDED model in calview at 2.5 keV, and in the case of RXJ1334+37, PSF images were created for the proper off-axis distance. For each group, these images were weighted by the ratio of the total count rate in each detector in the group region and merged to create a single PSF image. We account for the X-ray background by including a constant background component in the model. Groups were fit in a circular region centered on the group centroid with typically a radius of 90 pixels (180”), but the region sizes varied between 30 and 120 pixels depending on the group. As we included the background in the fit, regions were chosen to be large enough to extend out to the background level. For RXJ1648+60, the region chosen for the spatial fitting contained approximately 280 net groups counts; all other groups contained at least 1000 net counts.
For each group, we fit the X-ray emission using both circular and elliptical -models, except for RXJ1648+60 which has very few counts after flare filtering. Even fixing the ellipticity at zero for this group we can derive only limits on and . For RXJ1334+37, the reduction in effective area at the off-axis position of the group also leads to somewhat limited statistics, and the group is located very close to a PN chip gap. In order to obtain a reasonable fit to a -model for this group, it was necessary to fix the position at the X-ray peak (also the centroid) and the background at a local background estimate. The results of the elliptical fits and the limits for RXJ1648+60 are listed in Table 2. The derived core radii are significantly larger than the XMM PSF, so we are not limited by the XMM spatial resolution. RXJ0329+02 and RXJ1334+37 have significant ellipticity; the other groups are constrained to be fairly round. Due to the limitations of the statistics, we do not fit two-component models to our groups.
Studies of low-redshift groups find them to have generally lower values than the typical found for rich clusters (Arnaud & Evrard 1999; Mohr, Mathiesen, & Evrard 1999). Mulchaey et al. (2003) find a mean of for their group sample, and Osmond & Ponman (2004) find a median value of 0.45 and a maximum value of 0.58 for the GEMS groups. The spatial fits to our groups vary significantly. However, three of the five groups for which we have measured ’s have values higher than the maximum of 0.58 found for the GEMS groups, and we find an average of 0.74. Our groups also have significantly larger core radii than the GEMS sample. Even when considering the correlation of and core radius, the 90% confidence contours show that for three groups our values are constrained to be higher than 0.52-0.63. There are several effects that could lead to the difference in -model fits. Our groups are generally hotter than the groups in the two low-redshift samples mentioned, and we detect our groups to a generally larger fraction of the virial radius than was used for the cooler low-redshift groups. Willis et al. (2005) also find relatively low ’s for moderate-redshift () groups detected in the XMM Large-Scale Structure (LSS) survey. For the six groups with measured temperatures and temperatures below 3 keV, they find an average of 0.53 and a maximum of 0.67. However, fewer than 200 counts are detected from some of these groups, and so we are again probing a significantly larger region in our groups.
5 SPECTRAL ANALYSIS
For spectral fitting, we defined the extent of each group to be the radius at which the surface brightness reaches 20% of the background. This radius, , was determined from the one-dimensional surface brightness profile and using the best-fit background level from the 2D -model. We extract spectra separately for each detector, and we extract local background spectra from an annular region of similar area outside where the surface brightness reaches the background level. As mentioned above, due to changes in the calibration the blank-field backgrounds are not applicable to our data. Point sources were again excluded from the analysis. The spectra are grouped to give a minimum of 25 counts per bin, and RMFs and ARFs are created for each detector using rmfgen and arfgen. Our spectral extraction regions are not much larger than the scale of instrumental variations included in the ARFs ( 1 arcmin), and we found a flat detector map to be sufficient for ARF creation.
For each group, the spectra from the three detectors were jointly fit to an absorbed mekal model in the 0.5-5 keV band. We ignore energies between 1.45 and 1.55 keV to exclude the Al K instrumental lines. For RXJ1648+60 and RXJ1334+37, the six spectra resulting from the two observations are all jointly fit, and for RXJ1648+60, we use a broader energy band of 0.5-8 keV to improve the signal. We fix the absorbing column at the galactic value (Dickey & Lockman 1990) but allow both the temperature and metallicity to vary. Metallicities are relative to the abundances of Anders & Grevessa (1989). In the case of RXJ1648+60, the metallicity was fixed at 0.3 solar. The results of these fits are shown in Table 3 along with the 90% confidence limits. Also listed are the unabsorbed, bolometric luminosities (0.01-100 keV) determined from the spectral fits. The luminosity errors include both the uncertainty in the temperature and the metallicity. For RXJ1648+60, we varied the metallicity between 0.0 and 1.0 solar to bound the luminosity error, and an upper limit of 1.0 solar was also used for RXJ1334+37. We correct our luminosities for the flux lost due to point source removal using the best-fit -model. In Sherpa, we create a model image of each group and calculate the count rate in the spectral extraction region both with and without the point source regions. The luminosities are then corrected by the ratio of these two count rates.
Our groups have temperatures around 2 keV placing them in the massive group or poor cluster regime of galaxy associations. The best-fit temperature for RXJ1648+60 is lower at around 1 keV, but the large errors associated with the small number of group counts mean that it is consistent with the other groups. The best-fit metallicities of our groups span a large range in metallicity and generally have large errors. One of the groups, RXJ1256+25, is constrained within the 90% confidence limits to have a fairly low metallicity, below 0.25 solar. Only RXJ1334+37 and RXJ1205+44 have metallicities greater than zero within the 90% confidence limits, and only RXJ1205+25 has a significant metallicity with a lower limit of 0.27. Deeper observations are needed to truly constrain the abundance of metals in intermediate-redshift groups.
The spectral extraction radius varies from group to group depending on both flux and exposure time. In order to compare the groups at a standard radius, we extrapolated their luminosities to , the radius at which the density is five hundred times the critical density. We estimate for each group in the assumed CDM cosmology using the best-fit values of , core radius, and temperature. Assuming isothermality and a -model surface brightness distribution, the total mass within a radius is given by
| (2) |
where , is the mean molecular weight, is the gravitational constant, and is the proton mass. The ratios of our spectral extraction radii to range between 0.45 and 1.05, so we are probing a reasonable fraction of these groups. Luminosities were then extrapolated using the best-fit -model. For RXJ1648+60, for which we were unable to obtain an accurate fit to a -model, we use the average parameters from the other five groups, kpc and . These luminosities are listed in Table 3 along with the values of ; errors in luminosity were determined from the spectral errors alone and do not include the uncertainty in the -model parameters. Most of the group luminosities increase only slightly when extrapolated to , and the correction is always less than a factor of 1.7.
6 COMPARISON TO LOW-REDSHIFT GROUPS
6.1 Brightest Group Galaxies
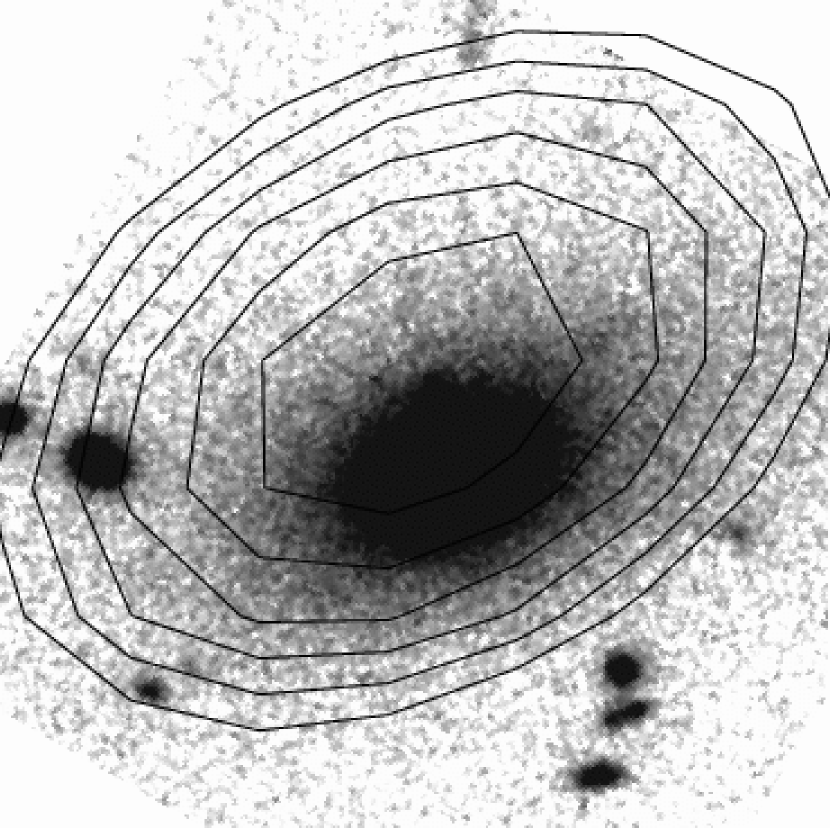
Investigation of Figures 2-7 reveal that with the exception of RXJ1648+60 and RXJ1334+37 the groups are centered on dominant early-type galaxies. In particular, the two lowest-redshift groups, RXJ0720+71 and RXJ1256+25, have large central galaxies. In both of these groups, the central object is composed of three components, and in RXJ0720+71 the two brightest components are consistent with having the same radial velocity (Paper I). The multiple nuclei in these systems are only separated by a few arcsecs, so the XMM peak can not be reliably identified with a single component. In RXJ1205+25, the brightest group galaxy (BGG) likewise has two components (Paper I). In RXJ0329+02, the position angle of the central galaxy and the X-ray emission appear to align. This alignment can be seen in Figure 8 which shows the central contours of the best-fit -model to the X-ray emission overlaid on the HST image of the BGG. From Sherpa, the position angle of the semi-major axis of the X-ray emission is , measured counterclockwise from north. Fitting the central galaxy with the task ELLIPSE in IRAF, we find a position angle between and for all but the inner most ellipse. The X-ray emission therefore aligns with the BGG to within . Although the position of the X-ray center from the X-ray contours appears to be offset from the galaxy center, this offset, which is a couple of arcsecs, is not significant.
These observations correspond well to the observed properties of low-redshift groups. Similar to clusters, low-redshift groups in which X-ray emission is detected are almost all centered on dominant early-type galaxies (Osmond & Ponman 2004; Mulchaey & Zabludoff 1998). However, two of our groups do not show this feature. RXJ1334+37 contains a dominant early-type galaxy, but the X-ray emission is centered to the south-east of this galaxy. RXJ1648+60 contains a string of bright group galaxies which are traced by the X-ray emission, but from the current data the X-ray emission is not peaked on any one of these. This group also does not contain a clearly dominant galaxy, but rather several galaxies with similar magnitudes (Paper I). Another group studied in Mulchaey et al. (2006) for which we do not yet have XMM data, RXJ0210-39, also has a chain-like morphology and no dominant early-type galaxy. These groups may not be as dynamically evolved as low-redshift groups or the other groups in our sample. In addition, three of the four groups in our sample with central galaxies have BGGs with multiple cores. In contrast, in an X-ray selected sample of 19 groups at with similar luminosities, described in Paper I, the X-ray emission in all of the groups is centered on a bright early-type galaxy, and none of the BGGs have multiple nuclei. Therefore, X-ray luminous groups at intermediate redshifts appear to be in an earlier stage of formation than low-redshift groups, at least as far as their galaxies are concerned (Paper I). The detailed morphological content of our moderate-redshift groups will be investigated in a future paper.
6.2 Scaling Relations
It is well known that there is a strong correlation between X-ray luminosity and temperature in clusters of galaxies, and that the relation for clusters does not follow the expected for self-similar systems radiating through thermal bremsstrahlung. This relation is instead observed to be roughly (e.g. White, Jones, & Forman 1997; Arnaud & Evrard 1999). The scaling between luminosity and temperature in the group regime is less well established. Studies of low-redshift groups have found that the relation steepens significantly in the group regime (Helsdon & Ponman 2000 a,b; Ponman et al. 1996).
In Figure 9, we show the relationship between luminosity and temperature for our groups compared to the low-redshift groups () in the GEMS sample (Osmond & Ponman 2004). For comparison, we also plot a sample of low-redshift () clusters with ASCA temperatures and ROSAT luminosities from Markevitch (1998). Our groups lie in the region of this plot in between what are typically labeled clusters and what are typically labeled groups, and they show good agreement with the low-redshift samples.
Figure 10 also compares the relation for our groups versus the GEMS sample but with the luminosities projected to . As with our groups, the luminosities of the GEMS groups were extrapolated to using the best-fit -model, and for those groups where they were unable to fit a -model, the average core radius and were used (Osmond & Ponman 2004). While this extrapolation involves a certain amount of uncertainty, it is important because the group luminosities are measured within very different radii, and the correction can be as high as a factor of three for the low-luminosity GEMS groups. Also plotted are the six groups from the XMM-LSS survey with measured temperatures below 3 keV. These groups have redshifts between 0.29 and 0.44. Here the solid line shows the best-fit to the GEMS , while the dotted and dashed lines show the fits to the Markevitch (1998) cluster sample and the GEMS plus Markevitch samples, respectively (Willis et al. 2005; Helsdon & Ponman, in preparation). As noted in Willis et al. (2005), the luminosities in Markevitch (1998) are quoted within Mpc not , but the correction factors are typically smaller than the 5% calibration uncertainty in the luminosities. In this plot, our errors are more conservative 90% confidence limits, and we include the uncertainties in temperature and metallicity in the luminosity errors, while 1 limits are shown for the other two samples. Again, our moderate-redshift groups agree with the low-redshift relation within the errors as well as with the cluster or cluster plus group relations. The observations of the XMM-LSS survey groups are generally not as deep as ours, but they cover a similar redshift range. They also appear to be consistent with the luminosities and temperatures of our groups. In general, the intermediate-redshift groups scatter about both the low-redshift cluster and group fits with possibly slightly better agreement to the clusters. Here we have not applied an evolutionary correction to our luminosities (Ettori et al. 2004), but in our redshift range this correction is small. Using would reduce our luminosities by at most a factor of 0.75.


We also investigate the relationship between the velocity dispersion of the group member galaxies and the X-ray temperature. Figure 11 shows a comparison of our groups to low-redshift groups and clusters. Here our groups and the XMM-LSS groups lie closer to the cluster relation then they do to the fit to the low-redshift GEMS groups. In Figure 11, it can be seen that there is a large scatter in the velocity dispersions of our groups. Some of these velocity dispersions were determined from relatively few galaxies (Paper I). In addition, our groups were selected based on X-ray luminosity versus low-redshift group samples which are primarily optically-selected. This X-ray selection could lead to a larger scatter in optical properties. In general, our groups show agreement with the cluster relation, but a few fall off this relation within the errors. In particular the two most discrepant points, RXJ1648+60 and RXJ1334+37, have velocity dispersions which appear significantly low for their temperatures. These groups also fall significantly off the relation (Paper I). The spectrum of RXJ1648+60 only has a S/N of 3.6, and the associated error in the temperature could make it consistent with the relation but not the the relation. The velocity dispersions for these groups were also computed from relatively few galaxies, six and eight respectively (Paper I). The measured velocity dispersions for both groups are near the theoretical lower bound of km s-1 for a collapsed system (Mamon 1994), yet both show extended X-ray emission. Similar low velocity dispersion, over-luminous groups were found in the GEMS sample, but at lower X-ray luminosities and temperatures, and at least two of these are confirmed to have significant X-ray emission from deeper Chandra observations (Helsdon, Ponman, & Mulchaey 2005). Helsdon et al. (2005) propose several possible physical effects which could lead to low velocity dispersions including dynamical friction, tidal heating, and orientation effects. On going deeper spectroscopy of our sample will help to determine the nature of these groups.

6.3 Entropy
As with the relation, the entropy of the IGM in low-redshift groups is observed to deviate from the self-similar expectation of a simple linear scaling of entropy with temperature (Ponman, Cannon & Navarro 1999; Lloyd-Davies, Ponman, & Cannon 2000; Finoguenov et al. 2002; Ponman, Sanderson, & Finoguenov 2003). Explanations for these deviations from self-similarity include preheating of the gas before clusters were assembled (Evrard & Henry 1991; Kaiser 1991; Cavaliere, Menci & Tozzi 1997; Balogh, Babul & Patton 1999; Valageas & Silk 1999; Tozzi & Norman 2001; Babul et al. 2002; Dos Santos & Doré 2002; Nath & Roychowdhury 2002), heating by supernova and/or AGN (Bower 1997; Loewenstein 2000; Voit & Bryan 2001; Nath & Roychowdhury 2002; Roychowdhury, Ruszkowski, & Nath 2005), or removal of low-entropy gas through cooling (Knight & Ponman 1997; Bryan 2000; Pearce et al. 2000; Muanwong et al. 2001; Wu & Xue 2002; Davé, Katz & Weinberg 2002). Using a sample of 66 systems ranging in mass from galaxies to massive clusters, Ponman et al. (2003) find a trend of entropy, measured at , versus temperature that is shallower than the self-similar expectation of . Their results suggest the presence of extra entropy in systems at all temperatures relative to the hottest clusters. Similar to Finoguenov et al. (2002), they also detect excess entropy at a much larger radius, . The existence of excess entropy at at large radii conflicts with many preheating models which predict that the entropy increase should be restricted to the central regions of groups and clusters.
We calculate the entropies of our groups using the standard definition of entropy as . Using the -model parameterization of the surface brightness, the gas density profile is given by
| (3) |
The central electron density is derived from a combination of the surface brightness fit and the normalization of the spectral model.
| (4) |
where is the normalization of the mekal spectrum in XSPEC, cos with arcsin, is the angular diameter distance, and we assume (Ettori et al. 2004).
Following Ponman et al. (2003), we calculate group entropies at both relatively small radii () and large radii (). Figures 12 and 13 show these entropies versus temperature compared to the low-redshift groups and clusters studied by Ponman et al. (2003) and to the self-similar prediction normalized to hot clusters. Here we plot for our groups, where . This scaling accounts for the variation of the mean density within a given overdensity radius with redshift. We find a similar entropy excess compared to the self-similar expectation at both radii and reasonable agreement with the low-redshift points. Here we have assumed isothermality, but at these radii we do not expect that the average emission weighted temperatures will vary significantly from our measured temperatures, measured at between half of and (Rasmussen & Ponman 2004; Ponman et al. 2003). Rasmussen & Ponman (2004) compare the entropy profiles for two groups assuming both isothermal and polytropic gas distributions; these profiles vary by less than about 25%. In Figures 12 and 13, we plot the 1 errors in entropy propagated from the errors in temperature and spectral normalization. Additional uncertainty is present from the -model fits to the surface brightness and in the calculation of overdensity radii, so these results should be interpreted with care. However, the entropies of our groups are consistent with the excess entropy observed in low-redshift groups.


7 AGN IN GROUPS
Several studies with Chandra have detected an overdensity of X-ray sources toward both individual clusters (Cappi et al. 2001; Sun & Murray 2002; Molnar et al. 2002) and cumulatively in large cluster samples (Cappelluti et al. 2005; Ruderman & Ebeling 2005) relative to the field. Through optical spectroscopy of the X-ray sources in eight clusters, Martini et al. (2006) securely identified 40 luminous, X-ray sources ( ergs s-1) with cluster member galaxies. At these luminosities most of these sources, particularly those with ergs s-1, are AGN, although only four of these galaxies show AGN signatures in the optical spectra. These observations reveal a population of AGN associated with clusters that have gone previously unidentified in optical observations.
Very little is known about AGN populations in low-mass clusters and groups. Only a few of the X-ray sources in our group fields correspond to galaxies for which we have spectroscopy. One source in RXJ1648+60, XMMU J164838.1+601934, matches a group member galaxy at . This source has a hard band (2-10 keV) luminosity of ergs s-1 and a broad band (0.3-8 keV) luminosity of ergs s-1, securely identifying it as an AGN. The approximately 200 counts in the XMM observation allow for a rough spectral fit, which gives a power law index of and which is consistent with galactic absorption. Through comparison to our optical imaging, we find a number of other candidate group AGN. Within a radius of 1 Mpc there are six X-ray sources matching galaxies bright enough to host AGN. Assuming these sources are at the group redshifts and have typical AGN spectra with a power law index of 1.7 and galactic absorption, they all have X-ray luminosities of ergs s-1 or greater.
We also investigate whether or not there is an overdensity of X-ray sources in our group fields compared to the observed Log-Log from studies of the cosmic X-ray background (Moretti et al. 2003; Rosati et al. 2002; Tozzi et al. 2001; Brandt et al. 2001; Mushotsky 2000). For this calculation we include only X-ray sources within 1 Mpc of the group center and with fluxes greater than ergs cm-2 s-1 in the hard band (2-10 keV) and ergs cm-2 s-1 in the soft band (0.5-2 keV). These flux limits ensure that the sources could be detected in all of our group exposures. In our six group fields, we detect 25 sources which meet these requirements. In comparison, fits to the Log-Log predict 13-16 sources in the soft band and 19-26 sources in the hard band, depending on the study (Moretti et al. 2003; Rosati et al. 2002; Tozzi et al. 2001; Brandt et al. 2001; Mushotsky 2000). We therefore find approximately a 2 excess in the number of soft band sources and no significant excess in the number of hard band sources. However, we are only probing the bright end of the Log-Log.
In summary, we identify at least one X-ray luminous AGN associated with one of our groups, and find indications for a population of group AGN similar to those seen in clusters. Deeper X-ray observations combined with spectroscopy of the optical counterparts of the X-ray sources would confirm the existence of a significant fraction of AGN in these groups.
8 SUMMARY
A lot of work has been done on the largest collapsed objects in the universe, massive clusters of galaxies, with studies now extending beyond a redshift of one. However, little is known about their more common low-mass counterparts, poor clusters and groups of galaxies, beyond the present epoch. In addition to forming the building blocks of larger structures, groups contain most of the galaxies in the universe and are likely the sites of significant galaxy evolution (e.g. Tully 1987). As part of a multiwavelength study of moderate redshift groups, we obtained XMM-Newton observations of six groups with redshifts between 0.2 and 0.6.
We find generally good agreement between the X-ray properties of our groups and those at lower redshifts. Similar to low-redshift groups, the X-ray emission in several of our groups is centered on a dominant early-type galaxy, and in the case of RXJ0329+02, the position angle of the X-ray isophotes aligns with the central galaxy. However, two of our groups are not centered on a BGG, indicating they are probably less dynamically evolved (Paper I). RXJ1334+37 has a BGG, but the X-ray emission peaks to the south-east of this galaxy. RXJ1648+60 contains a string of bright galaxies which are traced by the X-ray emission rather than one dominant galaxy. The X-ray morphology of RXJ1334+37 is also less symmetric than the other groups in our sample. The contamination by background flares makes it difficult to determine the structure of RXJ1648+60 from the current observation, but it may also be elongated.
Our groups have temperatures around 2 keV placing them in the massive group or poor cluster regime of galaxy associations. Their X-ray properties are in agreement with the scaling relations between luminosity, temperature, and velocity dispersion defined by low-redshift groups and clusters as well as with the shallower observations of intermediate-redshift groups in the XMM-LSS (Osmond & Ponman 2004; Horner 2001; Willis et al. 2005). Our groups appear to be in slightly better agreement with the cluster scaling relations; however, they all agree within the errors. In particular, there is a large scatter in the velocity dispersions of our groups with a couple of groups having velocity dispersions that are too low for their temperatures and luminosities. The spectrum of RXJ1648+60 only has a S/N of 3.6, and the associated error in the temperature could make it consistent with the relation but not the the relation (Paper I). This discrepancy could be an artifact of the X-ray selection or a small number of velocity measurements, but their velocity dispersions lie close to the theoretical lower limit for collapsed systems (Mamon 1994), which is difficult to explain in systems which clearly show extended X-ray emission. Similar low velocity dispersions are observed in a few low-redshift groups (Osmond & Ponman 2004; Helsdon et al. 2005). The proposed explanations include a lowering of the velocity dispersion through dynamical friction, tidal heating, or orientation effects. Future deeper spectroscopy will help us to understand these systems.
Our observations indicate that intermediate-redshift groups contain excess entropy over the expected self-similar scaling with temperature. We find this excess at both small () and large () radii, similar to a study of 66 clusters and groups at low-redshift (Ponman et al. 2003). The detection of excess entropy out to large radii is significant, because models like preheating generally predict that the excess entropy should be restricted to the central regions. Finally, we detect at least one X-ray luminous AGN associated with a group member galaxy. This source is associated with RXJ1648+60 and has a broad band (0.3-8 keV) luminosity of ergs s-1. We also find several other luminous X-ray point sources in these groups which match galaxies in the optical imaging and a 2 excess in the number of soft band (0.5-2 keV) sources over the field. While not conclusive, these findings may point to a population of group AGN similar to those seen in clusters (Martini et al. 2006).
References
- (1) Anders, E., & Grevesse, N. 1989, Geochimica et Cosmochimica Acta, 53, 197
- (2) Arnaud, M., Neumann, D. M., Aghanim, N., Gastaud, R., Majerowicz, S., & Hughes, J. P. 2001, A&A, 365, L80
- (3) Arnaud, M., & Evrard, A. E. 1999, MNRAS, 305, 631
- (4) Babul, A., Balogh, M. L., Lewis, G. F., Poole, G. B. 2002, MNRAS, 330, 329
- (5) Balogh, M. L., Babul, A., Patton, D. R. 1999, MNRAS, 307, 463
- (6) Barnes, J. 1985, MNRAS, 215, 517
- (7) Bower, R. G. 1997, MNRAS, 288, 355
- (8) Brandt, W. N., et al. 2001, AJ, 122, 2810
- (9) Bryan, G. L. 2000, ApJ, 544, L1
- (10) Cappelluti, N., Cappi, M., Dadina, M., Malaguti, G., Branchesi, M., D’Elia, V., & Palumbo, G. G. C. 2005, A&A, 430, 39
- (11) Cappi, M., et al. 2001, ApJ, 548, 624
- (12) Cash, W. 1979, ApJ, 315, 939
- (13) Cavaliere, A., Menci, N., Tozzi, P. 1997, ApJ, 484, L21
- (14) Davé, R., Katz, N., & Weinberg, D. H. 2002, ApJ, 579, 23
- (15) Dickey, J. M., & Lockman, F. J. 1990, ARA&A, 28, 215
- (16) Dos Santos, S., & Doré, O. 2002, A&A, 383, 450
- (17) Ettori, S., Tozzi, P., Borgani, S., & Rosati, P. 2004, A&A, 417, 13
- (18) Evrard, A. E., Henry, J. P. 1991, ApJ, 383, 95
- (19) Finoguenov, A., Jones, C., Böhringer, H., & Ponman, T. J. 2002, ApJ, 578, 74
- (20) Helsdon, S. F., & Ponman, T. J. 2000a, MNRAS, 315, 356
- (21) Helsdon, S. F., & Ponman, T. J. 2000b, MNRAS, 319, 933
- (22) Helsdon, S. F., Ponman, T. J., & Mulchaey, J. S. 2005, ApJ, 618, 679
- (23) Horner, D. J. 2001, Ph.D. thesis, University of Maryland
- (24) Jones, L. R., McHardy, I., Newsam, A., & Mason, K. 2002, MNRAS, 334, 219
- (25) Kaiser, N. 1991, ApJ, 383, 104
- (26) Knight, P. A., & Ponman, T. J. 1997, MNRAS, 289, 955
- (27) Lloyd-Davies, E. J., Ponman, T. J., & Cannon, D. B. 2000, MNRAS, 315, 689
- (28) Loewenstein, M. 2000, ApJ, 532, 17
- (29) Lumb, D. H., Warwick, R. S., Page, M., & De Luca, A. 2002, A&A, 389, 93
- (30) Mamon, G. A. 1994, in Clusters of Galaxies, ed. F. Durret, A. Mazure, & J. Tran Thanh Van (Gif-sur-Yvette: Editions Frontieres), 291
- (31) Markevitch, M. 1998, ApJ, 504, 27
- (32) Martini, P., Kelson, D. D., Kim, E., Mulchaey, J. S., & Athey, A. A. 2006, ApJ, accepted
- (33) Merritt, D. 1985, ApJ, 289, 18
- (34) Mohr, J. J., Mathiesen, B., Evrard, A. E. 1999, ApJ, 517, 627
- (35) Molnar, S. M., Hughes, J. P., Donahue, M., & Joy, M. 2002, 573, L91
- (36) Moretti, A., Campana, S., Lazzati, D., & Tagliaferri, G. 2003, ApJ, 588, 696
- (37) Muanwong, O., Thomas, P. A., Kay, S. T., Pearce, F. R., & Couchman, H. M. P. 2001, ApJ, 552, L27
- (38) Mulchaey, J. S., Lubin, L. M., Fassnacht, C., Rosati, P., & Jeltema, T. E. 2006, ApJ, submitted (Paper I)
- (39) Mulchaey, J. S., Davis, D. S., Mushotzky, R. F., & Burstein, D. 2003, ApJS, 145, 39
- (40) Mulchaey, J. S., & Zabludoff, A. 1998, ApJ, 496, 73
- (41) Mulchaey, J. S., Davis, D. S., Mushotzky, R. F., & Burstein, D. 1993, ApJ, 404, L9
- (42) Mushotsky, R. F., Cowie, L. L., Barger, A. J., & Arnaud, K. A. 2000, Nature, 404, 459
- (43) Nath, B. B., & Roychowdhury, S. 2002, MNRAS, 333, 145
- (44) Nevalainen, J., Markevitch, M., & Lumb, D. 2005, ApJ, 629, 172
- (45) Osmond, J. P. F., & Ponman, T. J. 2004, MNRAS, 350, 1511
- (46) Pearce, F. R., Thomas, P. A., Couchman, H. M. P., & Edge, A. C. 2000, MNRAS, 317, 1029
- (47) Ponman, T. J., Sanderson, A. J. R., & Finoguenov, A. 2003, MNRAS, 343, 331
- (48) Ponman, T. J., Cannon, D. B., & Navarro, J. F. 1999, Nature, 397, 135
- (49) Ponman, T. J., Bourner, P. D. J., Ebeling, H., & Böhringer, H. 1996, MNRAS, 283, 690
- (50) Ponman, T. J., & Bertram, D. 1993, Nature, 363, 51
- (51) Read, A. M., & Ponman, T.J. 2003, A&A, 409, 395
- (52) Rosati, P. et al. 2002, ApJ, 566, 667
- (53) Rosati, P., Della Ceca, R., Burg, R., Norman, R., & Giacconi, R. 1998, ApJ, 492, L21
- (54) Roychowdhury, S., Ruszkowski, M., & Nath, B. B. 2005, ApJ, 634, 90
- (55) Ruderman, J. T., & Ebeling, H. 2005, ApJ, 623, L81
- (56) Sun, M., & Murray, S. S. 2002, ApJ, 577, 139
- (57) Tozzi, P., & Norman, C. 2001, ApJ, 546, 63
- (58) Tozzi, P., et al. 2001, ApJ, 562, 42
- (59) Tully, R. B. 1987, ApJ, 321, 280
- (60) Valageas, P., Silk, J., 1999, A&A, 347, 1
- (61) Voit, G. M., & Bryan, G. L. 2001, Nature, 414, 425
- (62) White, D. A., Jones, C., & Forman, W. 1997, MNRAS, 292, 419
- (63) Willis, J. P., et al. 2005, MNRAS, accepted
- (64) Wilman, D. J., et al. 2005a, MNRAS, 358, 71
- (65) Wilman, D. J., et al. 2005b, MNRAS, 358, 88
- (66) Wu, X., & Xue, Y. 2002, ApJ, 572, L19
| Group | R.A. (J2000) | Decl. (J2000) | Exposure (ks) | Redshift | |
|---|---|---|---|---|---|
| MOS1, MOS2, PN | (km s-1) | ||||
| RXJ0329.0+0256 | 03:29:02.82 | +02:56:25.2 | 46, 46, 39 | 0.412 | 258 |
| RXJ0720.8+7109 | 07:20:54.04 | +71:08:57.9 | 8.5, 8.4, 5.7 | 0.231 | 620 |
| RXJ1205.9+4429 | 12:05:51.44 | +44:29:11.0 | 24, 24, 17 | 0.593 | 530 |
| RXJ1256.0+2556 | 12:56:02.34 | +25:56:37.1 | 23, 23, 18 | 0.232 | 656 |
| RXJ1334.0+3750 | 13:34:58.95 | +37:50:15.7 | 104, 76, 60 | 0.384 | 121 |
| RXJ1648.7+6019 | 16:48:43.63 | +60:19:21.5 | 20, 23, 7.2 | 0.376 | 130 |
Note. — Column 4 lists the exposure times after the removal of background flares. For RXJ1648+60 and RXJ1334+37, the total exposure times from both observations are listed. Errors in the velocity dispersion are .
| Group | (arcsec, kpc) | Ellipticity | P.A. | |
|---|---|---|---|---|
| RXJ0329.0+0256 | , | |||
| RXJ0720.8+7109 | , | - | ||
| RXJ1205.9+4429 | , | - | ||
| RXJ1256.0+2556 | , | - | ||
| RXJ1334.0+3750 | , | |||
| RXJ1648.7+6019 | , | - | - |
Note. — Errors and limits are . Due to the lack of counts for RXJ1648+60, we did not fit for ellipticity, and we fixed the background using the observed local background. For RXJ1334+37 the background was also fixed at a local background, and the center was fixed at the X-ray peak/centroid. The last column gives the position angle of the semi-major axis, measured counterclockwise from north, for the two elliptical groups.
| Group | Redshift | S/N | kT | () | ||||
|---|---|---|---|---|---|---|---|---|
| (keV) | () | ( ergs s-1) | (kpc) | ( ergs s-1) | ||||
| RXJ0329+02 | 0.412 | 96” | 13 | 691 | ||||
| RXJ0720+71 | 0.231 | 104” | 13 | 850 | ||||
| RXJ1205+44 | 0.593 | 80” | 14 | 599 | ||||
| RXJ1256+25 | 0.232 | 156” | 16 | 550 | ||||
| RXJ1334+37 | 0.384 | 48” | 10 | 479 | ||||
| RXJ1648+60 | 0.376 | 36” | 3.6 | (0.3) | 413 |
Note. — The errors listed are 90% confidence limits. Column 4 lists the signal-to-noise of the group spectra calculated by summing the counts in the three detectors. For RXJ1648+60, the metallicity was fixed at 0.3 solar. The listed luminosities are unabsorbed, bolometric luminosities. They are corrected for the area lost from point source removal, and the luminosity errors take into account both the uncertainties in temperature and metallicity.