bmiller@gemini.edu
Globular Clusters in Dwarf Galaxies
Abstract
Recent work on globular cluster systems in dwarf galaxies outside the Local Group is reviewed. Recent large imaging surveys with the Hubble Space Telescope and follow-up spectroscopy with 8-m class telescopes now allow us to compare the properties of massive star clusters in a wide range of galaxy types and environments. This body of work provides important constraints for theories of galaxy and star cluster formation and evolution.
1 Introduction
Studies of globular clusters (GCs) in dwarf galaxies provide very important insights into galaxy formation, the formation and evolution of GCs, and the relationship between GCs and nuclei. Comparisons of the properties of star clusters in different types of galaxies can test the theories of galaxy formation. In hierarchical scenarios of galaxy formation dwarf-size galaxies form first and then merge into larger systems. If star cluster formation coincided with galaxy formation, then a significant fraction of the star clusters in massive galaxies should have been formed in dwarfs. In this case the star clusters in dwarf galaxies in dense environments should be at least as old and metal-poor as the oldest star clusters in giant galaxies. However, recently evidence has mounted that stellar populations in surviving low mass galaxies are younger than in giant ellipticalstreu05 . In this “downsizing” view the dwarf galaxies formed after the giants or at least had their star formation rates suppressed at early times. A signature of downsizing would be that the star clusters in dwarfs are younger than those in giant galaxies.
Another question that star clusters can help answer is the relationship between dwarf irregular (dI) and dwarf elliptical (dE) galaxies. All dwarf galaxies must have formed with substantial gas fractions like today’s dI galaxies. However, in massive local galaxies clusters the majority of the dwarfs are gas-free, smooth-isophote dEs. The differences may be due to environment or dIs may get transformed into dEs by gas stripping, supernovae winds, or galaxy interactions. A comparison of the star clusters in the two types of dwarfs provides insight into the processes that shaped these galaxies and into why some dEs form nuclei.
In addition, the shape of the initial mass function of star clusters and how it evolves is not well understood. There are still debates about whether the form of initial mass function is a single or broken power-law (resulting in a log-normal distribution in magnitudes) and about the effects of various destruction processes baum98 fz01 vesp01 . By comparing the present-day mass functions in dwarf galaxies with those in giant galaxies it may be to disentangle the destructive processes and therefore determine the shape of the initial star cluster mass function.
This paper reviews the properties of star cluster systems in dwarf galaxies outside of the Local Group. Large imaging surveys with the Hubble Space Telescope are now starting to provide us with statistically significant samples of GCs in dEs and dIs in different environments. Follow-up spectroscopy with 8-m class telescopes are now providing complementary results on the ages, metallicities, abundance ratios, and kinematics of GCs and nuclei in dwarf galaxies.
2 Radial Distributions
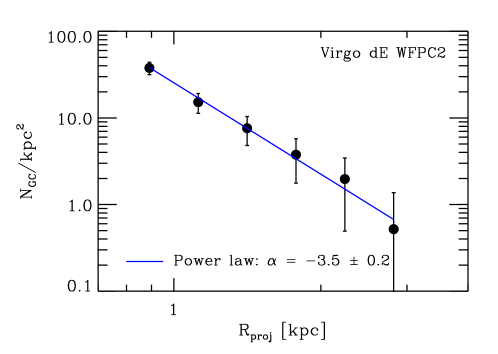
A common problem when studying the globular cluster systems (GCSs) of dwarf galaxies is that any given galaxy generally has too few clusters to draw broad conclusions. Therefore, the standard approach is to combine the clusters from a large number of galaxies into a “master” dE GCS. Various studies have found that the radial distribution of GCs in dEs follows that of the background light and that it has a power-law form with a slope ranging between and harris86 durrell96 minniti96 sharina05 . Figure 1 show the background-subtracted radial distribution of GCs from the WFPC2 dE Snapshot Survey. The distribution is a power-law with .
An alternative way of characterizing the radial distribution is to scale the projected radius of each cluster by the scale length of the host galaxy. This allows a direct comparison between the GC and background light distributions for a combined sample with galaxies of varying sizes. Data from the WFPC2 dE Snapshot Survey have shown that the radial distribution of the complete sample of GCs follows the background light extremely well lotz01 . However, the distribution of the GCs with shows a deficit at small radii that may be the result of dynamical friction. The dynamical friction timescales in dEs are short enough that the merging of GCs via this process is one avenue of producing nuclei hg98 ohlin00 lotz01 bekki06 . However, simple dynamical friction calculations over-predict the luminosities of the nuclei so other processes may be counteracting it lotz01 .
3 Luminosity Functions
The observed GC luminosity function (GCLF) gives the present-day GC mass function if the ages and metallicities ( ratios) of the clusters are known. Modeling the processes that can destroy GCs in dwarfs, mainly two-body relaxation with stellar evolution will hopefully allow us to determine the initial GCLF.
The GCLF in dEs has been measured recently for galaxies in nearby groups and the field sharina05 and in the Virgo and Fornax Clusters ml06 jordan06 . In the Virgo Cluster the combined GCLF from WFPC2 data plotted as a function of magnitude is fit by a distribution with a peak at . This is consistent with a GCLF peak of in VCC 1087 beasley06 and in the nearby group sample there is a peak at but after a small decline the numbers continue to rise at fainter magnitudes sharina05 .
A key issue is whether the GCLF peak in dEs is the same as the peak seen in old. metal-poor GCs in giant galaxies. Di Criscienzo et al. have recently compared the GCLFs for the Milky Way, M31, and several giant ellipticals in Virgo using consistent selection criteria and distance scale dicris06 . Fits to a distribution give very consistent peaks with an average value of . The GCLF peak for the dEs is consistent with this value, suggesting that the GCLF peak for old, metal-poor GC populations is nearly universal. However, there is a suggestion that the peak in dEs is mag fainter than in giant galaxies, perhaps as result of less efficient disk shockingmil06 .
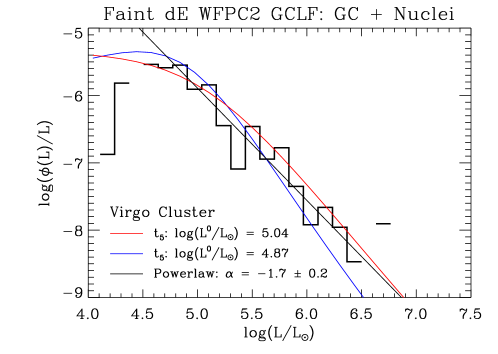
The GCLF can also be plotted as a function of luminosity rather than magnitude. In this representation the peaks discussed above correspond to breaks in a power-law distribution. The bright-end GCLF in dwarfs is consistent with with , similar to the slopes of the mass functions of Galactic molecular clouds and the luminosity functions of very young star clusters in starburst galaxiesmil06 .
Recently, van den Bergh has proposed that the GCLF for galaxies with is a single power-law, without a breakvdb06 . The WFPC2 dE Snapshot data is also consistent with this but low number statistics make it difficult to distinguish various models (Figure 2).
4 Colors, Ages, and Metallicities
The mean color of dE GS is , similar to the colors of Galactic halo GCs and to the GCs in the “blue peak” in giant elliptical galaxies lotz04 . However, several studies have found that the mean color becomes slowly redder with increasing galaxy luminosity strader04 lotz04 peng06 .
Recently work has been proceeding to use 8-m telescope to measure the ages and metallicities of GCs in dEs outside the Local Grouppuzia00 beasley06 conselice06 mil06 . The metallicities fall in the range and the ages are all greater than 10 Gyr. The ratio is more difficult to measure but it is important since it indicates whether the clusters formed after a significant starburst or after a period of quiescent star formation. Current measurements indicate that is either solar or slightly enhanced.
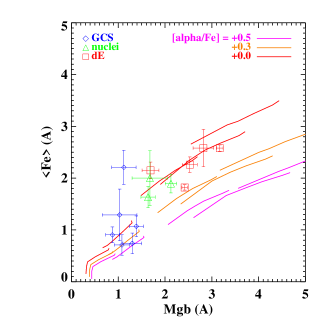
Figure 3 shows preliminary results of GMOS spectroscopy of GCs and nuclei in three Virgo dEs and one Fornax dEmil06 . The ratios are between 0.0 and 0.3. Using solar models we find that the ages are Gyr and the metallicities are . Interestingly, the bright nuclei are more metal rich () and somewhat younger than the typical GC. As found from photometry, the ages and metallicities of the nuclei are intermediate between the properties of the GCs and the background stellar light lotz04 .
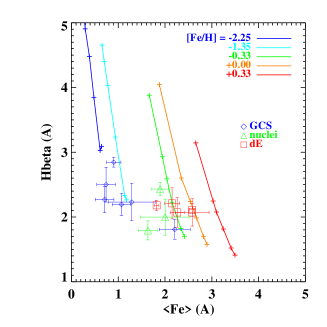
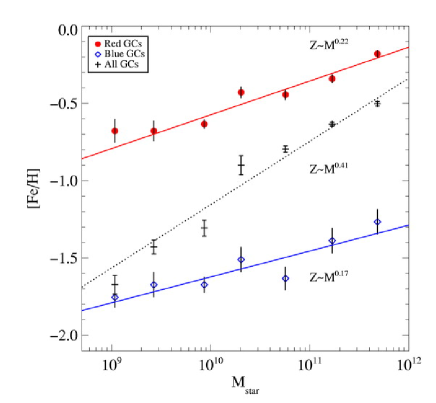
With the ages known the colors can be converted to metallicities using stellar models. The GC color–galaxy luminosity relation then gives that . However, the metallicity–luminosity, or mass, relation for all GCs including the red GCs that are more common in brighter galaxies is (Figure 4)peng06 . This is the same as the dependence for the underlying field stars and suggests that GCs and field stars follow a similar chemical enrichment history.
5 Specific Frequency and GC Mass Fraction
The specific globular cluster frequency is useful for comparing globular cluster systems and it is related to the efficiency of globular cluster formation. In order to compare GC populations in different type of galaxies one can calculate the parameter
| (1) |
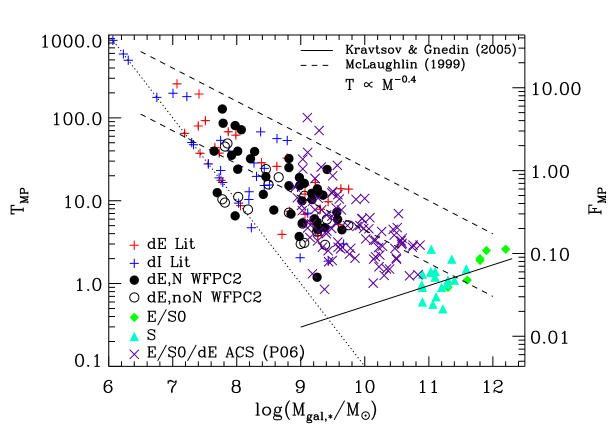
which is corrected for the differences in galaxy za93 . Assuming a universal GCLF (Sec. 3) then the GC mass fraction is . Figure 5 shows how and for metal-poor GCs correlate with galaxy mass mil06 . The increase in with mass for can be explained by hierarchical galaxy formation models (solid line kravtsov05 ). Below also increases with decreasing mass. This can be explained by model of GC formation that include the suppression of star formation in low-mass halos from supernovae winds (dashed lines, mclaughlin99 ).
It is also found that nucleated dEs have a mean value of about a factor of two higher than that for non-nucleated dEs mil06 . In addition, dE,N galaxies are more centrally concentrated within galaxy clusters and they have lower velocity dispersions than dE,noN galaxies. Therefore, the differences in values and the presence of nuclei may be explained if dE,Ns experienced higher star formation rates due to “hot-mode” gas accretion in the high density cluster environment keres05 forbes05 . Conversely, dE,noNs would have formed in lower density environments where star formation is lower due to “cold-mode” gas accretion.
6 Conclusions
Substantial progress in understanding the GCSs of dwarf galaxies has been made in recent years due to large imaging surveys in different environments with HST, new spectroscopic work using 8-m class telescope, and the inclusion of globular clusters in cosmological galaxy formation models.
More work is still needed on photometry and spectroscopy of GCs in dIs
in order to improve the comparisons with the results on dEs. Also,
there is much to be learned from the kinematics of GCs that could not
be discussed here. GCs will continue to be a fundamental tool for
understanding the formation of dwarf galaxies and testing theories of
galaxy formation in general.
This work was supported by the Gemini Observatory, which is operated by the Association of Universities for Research in Astronomy, Inc., on behalf of the international Gemini partnership of Argentina, Australia, Brazil, Canada, Chile, the United Kingdom, and the United States of America.
References
- (1) M. A. Beasley et al.: AJ, 131, 814 (2006)
- (2) H. Baumgardt: A&A, 330, 480 (1998)
- (3) K. Bekki, et al: ApJL, 642, L133 (2006)
- (4) C. J. Conselice: ApJ, 639, 120 (2006)
- (5) M. Di Criscienzo, et al.: MNRAS, 365, 1357 (2006)
- (6) P. R. Durrell, et al: AJ, 112, 972 (1996)
- (7) S. M. Fall & Q. Zhang: ApJ, 561, 751 (2001)
- (8) D. A. Forbes: ApJL, 635, L137 (2005)
- (9) M Geha, et al: AJ, 126, 1794 (2003)
- (10) W. E. Harris: AJ, 91, 822 (1986)
- (11) X. Hernandez & G. Gilmore: MNRAS, 297, 517 (1998)
- (12) A. Jordán, et al: in these proceedings (2006)
- (13) D. Kereš, et al: MNRAS, 363, 2 (2005)
- (14) A. V. Kravtsov & O. Y. Gnedin: ApJ, 623, 650 (2005)
- (15) S. S. Larsen, et al: AJ, 121, 2974 (2001)
- (16) J. M. Lotz, et al: ApJ, 552, 572 (2001)
- (17) J. M. Lotz, B. W. Miller, & H. C. Ferguson: ApJ, 613, 262 (2004)
- (18) D. E. McLaughlin: AJ, 117, 2398 (1999)
- (19) B. W. Miller, et al: in preparation (2006)
- (20) B. W. Miller & J. M. Lotz: in preparation (2006)
- (21) D. Minniti, et al: A&A, 312, 49 (1996)
- (22) K. S. Oh & D. N. C. Lin: ApJ, 543, 620 (2000)
- (23) E. W. Peng, et al: ApJ, 639, 95 (2006)
- (24) T. H. Puzia, T. H., et al: AJ, 120, 777 (2000)
- (25) A. Seth, et al: AJ, 127, 798 (2004)
- (26) M. E. Sharina, et al: A&A, 442, 85 (2005)
- (27) J. Strader, et al: AJ, 127, 3431 (2004)
- (28) D. Thomas, et al: MNRAS, 339, 897 (2003)
- (29) T. Treu, et al: ApJ, 622, L5 (2005)
- (30) S. van den Bergh: AJ, 131, 304 (2006)
- (31) E. Vesperini: MNRAS, 322, 247 (2001)
- (32) S. E. Zepf & K. M. Ashman: MNRAS, 264, 611 (1993)