A Detection of [C II] line emission in the QSO BR1202-0725
Abstract
We present resolution imaging of the QSO BR1202-0725 at 900 from the Submillimeter Array. The two submillimeter continuum components are clearly resolved from each other, and the positions are consistent with previous lower frequency images. In addition, we detect [C II] line emission from the northern component. The ratio of [C II] to far-infrared luminosity is 0.04% for the northern component, and an upper limit of is obtained for the southern component. These ratios are similar to the low values found in local ultraluminous galaxies, indicating that the excitation conditions are different from those found in local field galaxies. X-ray emission is detected by Chandra from the southern component at L erg s-1, and detected at 99.6% confidence from the northern component at L31044erg s-1, supporting the idea that BR1202-0725 is a pair of interacting galaxies at that each harbor an active nucleus.
Subject headings:
galaxies: formation, galaxies: starburst, cosmology: observations, galaxies: high redshift, submillimeter, galaxies: individual (BR1202-0725)1. Introduction
The far infrared (FIR) fine structure lines of abundant species (e.g. [C I], [C II], [O I]) are recognized as one of the most important coolants in the warm ISM. In particular, the emission from singly ionized carbon (i.e. [C II], ) is known to trace warm ( K) and dense ( cm-3) photo-dissociation regions (PDRs; Kaufman et al., 1999), directly identifying the gas surrounding active star forming regions. The [C II] line is the dominant coolant in the Galactic ISM, accounting for 0.1 – 1 % of the FIR luminosity (Hollenbach & Tielens, 1997). The brightness of the line makes it an attractive tracer of star formation in galaxies, and a relation holds between [C II] luminosity and the massive star formation rate derived from H emission for galaxies that have LFIR L⊙ (Boselli et al., 2002). In the FIR luminous galaxies (ULIRGs), the [C II]-to-FIR flux ratio is an order of magnitude smaller than in normal star forming galaxies (Luhman et al., 1998, 2003). The reason for the deficiency in the [C II] line luminosity is not well understood, but several possible scenarios have been offered (Luhman et al., 1998; Malhotra et al., 2001; Pierini, Leech & Völk, 2003; Luhman et al., 2003).
Despite the large line luminosity expected, detecting [C II] line emission from luminous high redshift sources using a single-dish submillimeter telescope has proved difficult (e.g. Isaak et al., 1994; van der Werf, 1998; Bolatto et al., 2004; Marsden et al., 2005). The low [C II]-to-FIR ratio suggests that the physical properties in high- sources resemble those of the local ULIRG population (e.g. Blain et al., 2002). Detection of the [C II] line in the QSO J1148+5251 has been reported recently by Maiolino et al. (2005). Here we report a first detection of the [C II] line emission from the hyper-luminous ( L⊙) QSO BR1202-0725 observed using the Submillimeter Array (SMA; Ho, Moran & Lo, 2004)111The Submillimeter Array is a joint project between the Smithsonian Astrophysical Observatory and the Academia Sinica Institute of Astronomy and Astrophysics, and is funded by the Smithsonian Institution and the Academia Sinica..
BR1202-0725 is an optically bright QSO () with a Lyman extension toward the northwest (Hu, McMahon & Egami, 1996; Petitjean et al., 1996; Fontana et al., 1998; Ohyama, Taniguchi & Shioya, 2004). Radio continuum emission was detected at 1.4, 4.9 and 43 GHz (Yun et al., 2000; Carilli et al., 2002). The emission at 1.4 GHz was resolved into two components; one at the location of the QSO and the other northwest. This apparent companion is also seen in millimeter continuum emission (Omont et al., 1996; Guilloteau et al., 1999). Abundant CO emission (M M⊙) was detected toward both the optical QSO and the northwestern companion (Omont et al., 1996; Ohta et al., 1996; Guilloteau, 2001; Carilli et al., 2002). The CO-derived redshifts are and 4.6916 for the QSO and the northwestern companion, respectively (Omont et al., 1996).
We adopt km s-1 Mpc-1, = 0.3, = 0.7, which gives Gpc ( = 6.5 kpc) for the luminosity distance to BR1202-0725.
2. Observation and Data Reduction
A total of 5 tracks (Table 1) were obtained toward BR1202-0725, where the total on-source integration time was 19.6 hours. The SIS receivers were tuned to a redshifted [C II] frequency of 333.969 GHz () (LSB). The SMA correlator had 2 GHz total bandwidth with 0.8 MHz (0.7 km s-1) spectral resolution. The data were calibrated using the IDL based SMA calibration tool MIR. The quasars 3C279 and 3C273 were observed to calibrate the antenna based time dependent gain, and Callisto, 3C279, 3C273, and 1924-292 were used to calibrate the bandpass. The flux scaling is derived assuming Callisto has a total flux density of 15 Jy at 334 GHz, and we estimate a 20% uncertainty in the derived fluxes.
Imaging and analysis of the visibility data were carried out using MIRIAD. The angular resolution achieved by adopting ROBUST = 2 was (P.A. = ). The continuum image constructed using the line-free data has an RMS noise of 3.0 mJy. Although the varying S/N across the the SMA bandpass makes it difficult to characterize the overall noise properties, the RMS noise in the [C II] spectrum calculated using several line-free regions of the data cube is estimated to be 7.5 mJy.
3. Results
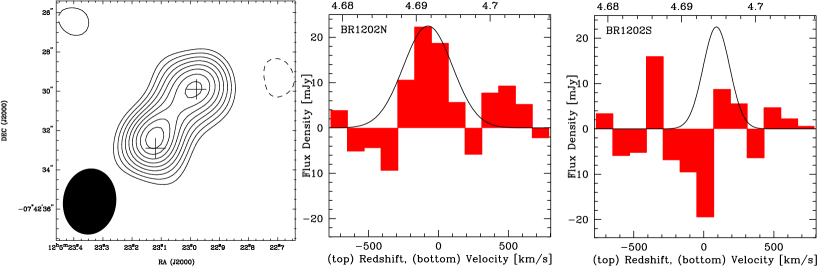
Figure 1 () presents the 900 continuum image of BR1202-0725. The coordinates of the two components are (J2000) = and (J2000) = for BR1202N, and (J2000) = and (J2000) = for BR1202S with uncertainties of . The peak of the northern component (BR1202N) is coincident with the CO (2–1) peak (Carilli et al., 2002) within the astrometric accuracy. The peak of the southern component (BR1202S) is displaced to the north from the CO (2–1) and the radio continuum peaks (Carilli et al., 2002) by . The location of BR1202S is consistent with the optical/NIR QSO reported by Hu, McMahon & Egami (1996). The derived flux densities from the line-free region of the spectrum are mJy (BR1202N) and mJy (BR1202S). BR1202S emits of the total flux, which is slightly lower than the earlier observations at 1.3 mm in which of the total flux was found in BR1202S (Omont et al., 1996).
A spectrum at the peak of the continuum in BR1202N is shown in Figure 1 (middle). A similar spectrum toward BR1202S is also shown in Figure 1 (right). Continuum subtraction for both spectra was performed by fitting a zeroth order baseline in the line-free channels of the visibilities. The BR1202N spectrum shows a 22 mJy peak at with a line profile that spans the redshift range of – 4.696. No significant detection is seen in the BR1202S spectrum. The FWHM of the [C II] line is km s-1, which is narrower than the CO (5–4) profile (FWHM = km s-1) obtained by Omont et al. (1996). The formal significance of the [C II] line detection over the entire line-width shown in Figure 1 is , assuming Gaussian statistics. The true significance of this feature is likely to be higher because noise is non-uniform across the bandpass. The excellent agreement between the [C II] line profile and the published CO (5–4) line profile further supports the robustness of our [CII] line detection. By integrating the emission in the velocity range -230 to 130 km s-1, we estimate the [C II] line flux of Jy km s-1 which translates to a [C II] luminosity of . Using a FIR luminosity of (see §4.2), we obtain (0.04%) in BR1202N. In addition, assuming km s-1 and (see §4.2), we obtain a upper limit of (0.03%) in BR1202S.
4. Discussion
4.1. Properties of the [C II] Line Emission
The exceedingly low ratios for both BR1202N and BR1202S are consistent with the similarly low ratios found in local ULIRGs where the average was found to be (Luhman et al., 1998, 2003). This is in stark contrast to the values found in the local galaxies by Malhotra et al. (2001) in which of the sources show , with the majority in the range . Past studies have reported for the QSO SDSS J1148+5251 (Maiolino et al., 2005), and in a QSO CL 1358+62 (Marsden et al., 2005). Our new measurement suggests that the [C II]-to-FIR ratio (0.04%) in the high- hyper-luminous source BR1202-0725 is comparable to local ULIRGs. Table A Detection of [C II] line emission in the QSO BR1202-0725 summarizes these results.
The integrated [C II] line intensity is known to be a tracer of star formation activity in normal galaxies. We derive the star formation rate (SFR) of 2900 using the calibration of Maiolino et al. (2005). This is 1 – 2 orders of magnitude higher than the SFRs derived from optical recombination lines observed near BR1202N (i.e. 10 – 230 M⊙ yr-1; Hu, McMahon & Egami, 1996; Petitjean et al., 1996; Ohta et al., 2000; Ohyama, Taniguchi & Shioya, 2004), but consistent with the SFR derived from the SED fit to the millimeter/submillimeter continuum measurements (i.e. SFR = 2000 in BR1202N; see §4.2).
Another important diagnostic of the physical properties is the [C II]-CO flux ratio. Early studies suggest the close spatial and kinematical association between the [C II] and CO (1–0) emissions in nearby galaxies, suggesting that this ratio is a good tracer of star formation activity that is independent of the beam filling factor (Crawford et al., 1985; Stacey et al., 1991). Assuming the luminosity ratio between the CO (5–4) and CO (1–0) lines in BR1202N is similar to that of the Cloverleaf (Barvainis et al., 1994, 1997), the CO (1–0) luminosity is estimated to be L L⊙, yielding L[CII]/L. This value is highly uncertain since the CO (5–4) – CO (1–0) ratio may be different in BR1202-0725. Nevertheless, this is a factor of 2.5 larger than the average values of ULIRGs (i.e. L[CII]/L 1700; van der Werf, 1998), but comparable to the average values of normal galaxies (i.e. L[CII]/LCO(1-0) = 4400 – 6300; Crawford et al., 1985; Stacey et al., 1991). The higher observed ratio may suggest a factor of few higher G0/n ratio (where G0 and n are the far UV flux and the cloud density respectively) in BR1202N compared to the local ULIRGs (see Figure 9 of Kaufman et al., 1999).
4.2. Properties of the Continuum Emission
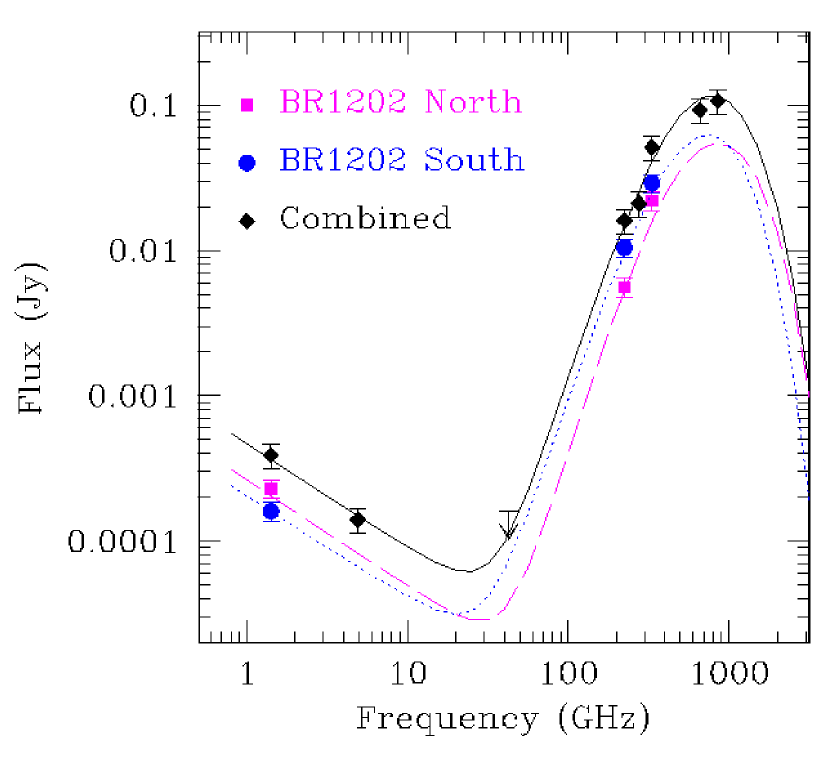
The spatially resolved submillimeter images allow us to investigate the properties of the individual components in BR1202-0725. The radio to FIR SED of BR1202-0725 is shown in Figure 2, where the individual flux densities are given for BR1202N and BR1202S for the 1.4 GHz (Carilli et al., 2002), 1.3 mm (Omont et al., 1996) and observations (see figure caption for the adopted parameters). The SEDs of the two sources are analyzed using the model by Yun & Carilli (2002), yielding L and L⊙, and SFR = 2000 and 4500 for BR1202N and BR1202S respectively. The discrepancy between the SFR derived by us and Yun & Carilli (2002)(2300 for the entire BR1202-0725) is due to the difference in the adopted cosmology. Note that while the millimeter/submillimeter continuum flux densities of BR1202N and BR1202S are comparable (§3), the radio continuum flux density of BR1202N is 3 times larger. This suggests a presence of a highly obscured AGN in BR1202N (see §4.3), or a strong effect of a highly energetic jet from BR1202S (Klamer et al., 2004).
Assuming a dust absorption coefficient of m2 kg-1 at (Hildebrand, 1983; Draine & Lee, 1984), the dust mass of the individual components is estimated to be M M⊙ and M M⊙. Using the H2 mass derived from the CO (5-4) emission (Omont et al., 1996), we find M/M for both components. This ratio is an order of magnitude lower than the mean value for LIRGs/ULIRGs (M/M; Sanders, Scoville & Soifer, 1991), nearby spiral galaxies222The CO to H2 conversion factor used by Omont et al. (1996), Sanders, Scoville & Soifer (1991) and Devereux & Young (1990) are all consistent to within 20%. In addition, the rest frame emission for BR1202-0725 traces the same warm dust (and hence the same Md) as measured by IRAS (Yun et al., 2006). (M/M; see Fig. 2b of Devereux & Young, 1990) and a sample of Spitzer 160 selected galaxies (M/M; Yun et al., 2006). These gas-to-dust ratios are highly uncertain because dust emissivity, temperature, and CO-to-H2 conversion factor are all poorly constrained. If the low ratio for BR1202-0725 is correct, however, it may indicate that the H2 mass is significantly underestimated in BR1202-0725, and/or the warm component of dust dominates the far infrared emission, suggesting that the entire ISM is involved in the starburst activity.
4.3. BR1202-0725: A Colliding Galaxy System at
Our analysis of previously unpublished archival Chandra data (ObsID 3025) clearly shows that BR1202S is an X-ray source and gives 26.4 net counts in 9.64 ksec. The derived flux from BR1202S is erg cm-2 s-1 which yields a luminosity of L erg s-1 (assuming = 2.0 and Galactic foreground NH = cm-2; Stark et al., 1992). X-ray emission is also seen within of the position of BR1202N. With just 2 counts in a single pixel, this detection seems marginal, but the local background of 0.03 counts/pixel implies that the likelihood of a random occurrence is only 0.04%. The derived flux from BR1202N is 10-16erg cm-2s-1 (95% confidence; Regener, 1951), implying L31044erg s-1.
If the X-ray emission from BR1202N is real, its high X-ray luminosity suggests that BR1202N also hosts a luminous AGN. In addition, our new [C II] line detection, large dust emission, and the presence of abundant molecular gas suggest that BR1202N is forming stars at a high rate. BR1202S and BR1202N thus form a system of two massive galaxies undergoing an interaction or a merger, separated by a projected distance of 25 kpc, observed when the universe was only 1.2 Gyrs old. The presence of a highly obscured AGN (and an optically bright QSO) during a massive merger is consistent with the scenario predicted in recent galaxy collision simulations that investigate the evolution of a central black hole (e.g. Hopkins et al., 2005).
A high degree of clustering near massive galaxies is expected in the theoretical models of large scale structure formation (e.g. White & Rees, 1978). This is supported by observations such as the higher surface density of submillimeter sources in the fields surrounding high- radio galaxies (Stevens et al., 2003). Although an earlier study by Giallongo et al. (1998) found little evidence for clustering of galaxies near BR1202-0725 with , two massive galaxies in proximity of each other makes BR1202-0725 a particularly interesting test ground for the hierarchical scenarios, soon after the reionization.
5. Summary
We present a resolution continuum image and a detection of the redshifted [C II] line emission from the QSO BR 1202-0725 obtained using the SMA. This is one of the first detections of the [C II] line from a high redshift source. The [C II] line is associated with BR1202N. The low [C II]-FIR ratio of is similar to local ULIRGs. X-ray emission is clearly detected from BR1202S, and at 99.6% confidence from BR1202N, suggesting that BR1202-0725 is the first example of a pair of AGN hosts at .
The authors thank the anonymous referee for valuable comments, which have improved this work significantly.
References
- Barvainis et al. (1994) Barvainis, R., Tacconi, L., Antonucci, R., Alloin, D., & Coleman, P. 1994, Nature, 371, 586
- Barvainis et al. (1997) Barvainis, R., Maloney, P., Antonucci, R., & Alloin, D., 1997, ApJ, 484, 695
- Blain et al. (2002) Blain, A. W., Smail, I., Ivison, R. J., Kneib, J. -P. & Frayer, D. T. 2002, PhR, 369, 111
- Bolatto et al. (2004) Bolatto, A. D., Di Francesco, J. & Willott, C. J. 2004, ApJL, 606, L101
- Boselli et al. (2002) Boselli, A., Gavazzi, G., Lequeux, J., & Pierini, D. 2002, A&A, 385, 454
- Carilli et al. (2002) Carilli, C. L. et al. 2002, AJ, 123, 1838
- Crawford et al. (1985) Crawford, M. K., Genzel, R., Townes, C. H., & Watson, D. M. 1985, ApJ, 291, 75
- Devereux & Young (1990) Devereux, N. A. & Young, J. S. 1990, ApJ, 359, 42
- Draine & Lee (1984) Draine, B. T. & Lee, H. M. 1984, ApJ, 285, 89
- Fontana et al. (1998) Fontana, A., D’Odorico, S., Giallongo, E., Cristiani, S., Monnet, G., & Petitjean, P. 1998, AJ, 115, 1225
- Giallongo et al. (1998) Giallongo, E., D’Odorico, S., Fontana, A., Cristiani, S., Egami, E., Hu, E., & McMahon, R. G., AJ, 115, 2169
- Guilloteau et al. (1999) Guilloteau, S., Omont, A., Cox, P., McMahon, R. G. & Petitjean, P. 1999, A&A, 349, 363
- Guilloteau (2001) Guilloteau, S. 2001, in ASP Conf. Ser. 235, Science with the Atacama Large Millimeter Array, ed. A. Wootten(San Francisco:ASP)
- Hildebrand (1983) Hildebrand, R. H. 1983, QJRAS, 24, 267
- Ho, Moran & Lo (2004) Ho, P. T. P., Moran, J. M. & Lo, Kwok Yung 2004, ApJ, 616, 1
- Hopkins et al. (2005) Hopkins, P. F., Hernquist, L., Cox, T. J., Di Matteo, T., Martini, P., Robertson, B., & Springel, V. 2005, ApJ, 630, 705
- Hu, McMahon & Egami (1996) Hu, E. M., McMahon, R. G. & Egami, E. 1996, ApJL, 459, L53
- Hollenbach & Tielens (1997) Hollenbach, D. J. & Tielens, G. G. M., 1997, ARAA, 35, 179
- Isaak et al. (1994) Isaak, K. G., McMahon, R. G., Hills, R. E. & Withington, S. 1994, MNRAS, 269, L28
- Kaufman et al. (1999) Kaufman, M. J., Wolfire, M. G., Hollenbach, D. J. & Luhman, M. L., 1999, ApJ, 527, 795
- Klamer et al. (2004) Klamer, I. J., Ekers, R. D., Sadler, E. M. & Hunstead, R. W. 2004, ApJL, 612, L97
- Luhman et al. (1998) Luhman, M. L. et al. 1998, ApJL, 504, L11
- Luhman et al. (2003) Luhman, M. L. et al. 2003, ApJ, 594, 758
- Maiolino et al. (2005) Maiolino, R., Cox, P., Caselli, P., Beelen, A., Bertoldi, F. et al. 2005, A&A, 480, L51
- Marsden et al. (2005) Marsden, G., Borys, C., Chapman, S. C., Halpern, M. & Scott, D. 2005, MNRAS, 359, 43
- Malhotra et al. (2001) Malhotra et al. 2001, ApJ, 561, 766
- Ohyama, Taniguchi & Shioya (2004) Ohyama, Y., Taniguchi, Y. & Shioya, Y. 2004, AJ, 128, 2704
- Ohta et al. (1996) Ohta, K., Yamada, T., Nakanishi, K., Kohno, K., Akiyama, M. & Kawabe, R. 1996, Nature, 382, 426
- Ohta et al. (2000) Ohta, K. et al. 2000, PASJ, 52, 557
- Omont et al. (1996) Omont, A., Petitjean, P., Guilloteau, S., McMahon, R. G., Solomon, P. M. & Pecontal, E. 1996, Nature, 382, 428
- Petitjean et al. (1996) Petitjean, P., Pecontal, E., Valls-Gabaud, D. & Charlot, S. 1996, Nature, 380, 411
- Pierini, Leech & Völk (2003) Pierini, D., Leech, K. J., & Völk, H. J. 2003, A&A, 397, 871
- Regener (1951) Regener, V. H. 1951, PhRv, 84, 161
- Sanders, Scoville & Soifer (1991) Sanders, D. B., Scoville, N. Z., & Soifer, B. T. 1991, ApJ, 370, 158
- Stacey et al. (1991) Stacey, G. J., Geis, N., Genzel, R., Lugten, J. B., Poglitsch, A., Sternberg, A., & Townes, C. H. 1991, ApJ, 373,444
- Stevens et al. (2003) Stevens, J. A. et al. 2003, Nature, 425, 264
- Stark et al. (1992) Stark, A. A., Gammie, C. F., Wilson, R. W., Bally, J., Linke, R. A., Heiles, C. & Hurwitz, M. 1992, ApJS, 79, 77
- van der Werf (1998) van der Werf, P. P. 1998, in ASP Conf. Ser. 156, Highly Redshifted Radio Lines, ed. C. L. Carilli, S. J. E. Radford, K. M. Menten, & G. I. Langston (San Francisco: ASP), 91.
- White & Rees (1978) White, S. D. M. & Rees, M. J. 1978, MNRAS, 183, 341
- Yun et al. (2000) Yun, M. S., Carilli, C. L., Kawabe, R., Tutui, Y., Kohno, K. & Ohta, K. 2000, ApJ, 528, 171
- Yun & Carilli (2002) Yun, M. S., & Carilli, C. L. 2002, ApJ, 568, 88
- Yun et al. (2006) Yun, M. S., et al. 2006, in prep.
| Date | Nants11Number of SMA antennas used. | 22On source integration time in hours. | Tsys33The average DSB system temperature in Kelvins. | RMS phase44The average RMS phase (in degrees) taken over all baselines for each track. These are calculated toward 3C279 for the first two tracks and 3C273 for the three tracks taken in 2006. |
|---|---|---|---|---|
| 02/22/2005 | 5 | 5.3 | 240 | 5 |
| 04/05/2005 | 6 | 5.2 | 310 | 15 |
| 03/21/2006 | 7 | 1.3 | 300 | 14 |
| 04/19/2006 | 8 | 4.5 | 250 | 6 |
| 05/11/2006 | 5 | 3.3 | 300 | 11 |