Identification of the OGLE-2003-BLG-235/MOA-2003-BLG-53
Planetary Host Star11affiliation: Based on observations made with the NASA/ESA Hubble
Space Telescope obtained at the Space Telescope
Science Institute under program GO-10426, which is operated by the
Association of Universities for
Research in Astronomy, Inc., under NASA contract NAS 5-26555.
Abstract
We present the results of HST observations of the host star for the first definitive extrasolar planet detected by microlensing. The light curve model for this event predicts that the lens star should be separated from the source star by mas at the time of the HST images. If the lens star is a late G, K or early M dwarf, then it will be visible in the HST images as an additional source of light that is blended with the source image. Unless the lens and source have exactly the same colors, its presence will also be revealed by a systematic shift between centroids of the source plus lens in different filter bands. The HST data indicates both of these effects: the HST source that matches the position of the source star is 0.21 magnitudes brighter in the ACS/HRC-F814W filter than the microlensing model predicts, and there is an offset of mas between the centroid of this source in the F814W and F435W filter bands. We conclude the planetary host star has been detected in these HST images, and this identification of the lens star enables a complete solution of the lens system. The lens parameters are determined with a Bayesian analysis, averaging over uncertainties in the measured parameters, interstellar extinction, and allowing for the possibility of a binary companion to the source star. This yields a stellar mass of and a planet mass of at an orbital separation of AU. Thus, the lens system resembles our own Solar System, with a planet of Jupiter-masses in a Jupiter-like orbit around a star of two-thirds of a Solar mass. These conclusions can be tested with future HST images, which should reveal a broadening of the blended source-plus-lens point spread function due to the relative lens-source proper motion.
1 Introduction
A new window on the study of extrasolar planets has been opened with the discovery of four planets by the gravitational microlensing method (Bond et al., 2004; Udalski et al., 2005; Beaulieu et al., 2006; Gould et al., 2006). This method (Mao & Paczyński, 1991; Gould & Loeb, 1992) probes some regions of extrasolar planet parameter space that are not accessible with other planet detection methods. For example, microlensing probes a random sample of stars toward the Galactic bulge and has no large selection effects based on stellar type. The sensitivity of microlensing to low-mass planets (Bennett & Rhie, 1996; Wambsganss, 1997) at separations of a few AU is also unique among current methods, as the recent discoveries of OGLE-2005-BLG-390Lb and OGLE-2005-BLG-169Lb have demonstrated (Beaulieu et al., 2006; Gould et al., 2006). It is also relatively straight-forward to determine the planet detection efficiency as a function of planet mass (Albrow et al., 2001; Gaudi et al., 2002), and the detection efficiency for such low-mass planets is more than an order of magnitude lower than for Jupiter-mass planets. The microlensing discovery of two low-mass planets, despite the much lower detection efficiency, indicates that planets of are more common than Jupiter-mass planets at separations of a few AU around the most common stars in our Galaxy, and the fraction of stars with planets of is estimated to be about 40%. This would seem to confirm a key prediction of the core accretion model for planet formation: that Jupiter mass planets are much more likely to form in orbit around G and K-dwarf stars than around M-dwarfs (Laughlin, Bodenheimer & Adams, 2004; Ida & Lin, 2004; Boss, 2006). In fact, Laughlin, Bodenheimer & Adams (2004) have argued that the Jupiter-mass planets found in microlensing events (Bond et al., 2004; Udalski et al., 2005) are more likely to orbit white dwarfs than M-dwarfs. Clearly, the microlensing detections would provide tighter constraints on planet formation theories if the properties of the host stars were known.
In this paper, we present an analysis of images taken with the Hubble Space Telescope’s Advanced Camera for Surveys (ACS) of the source and lens stars for the first microlensing event that yielded a definitive planet detection: OGLE-2003-BLG-235/MOA-2005-BLG-53. This event had a planetary lens system with a mass ratio of , so the planet is likely to have a mass similar to that of Jupiter or larger. Like the three other definitive microlensing planet detections to date, the light curve of this event has sharp features that resolve the finite angular size of the source star. This implies that the features of the lens system crossed the angular radius of the source star in days. This can be combined with the source star angular radius, as to yield the angular Einstein radius: mas. The angular source star radius has been determined from the source star magnitude and color (Bond et al., 2004) using the color-color relations of Bessell & Brett (1998) and the empirical relations between angular radius and surface V-K brightness of van Belle (1999) and Kervella et al. (2004). This corresponds to a linear source radius of , for kpc, which is consistent with the dereddened color of a G-dwarf source (Bond et al., 2004). Our value differs slightly from the value given in Bond et al. (2004) due to the improved zero-point for ground-based photometry given below. is related to the lens system mass by
| (1) |
where and are the lens and source distances, and is the total lens mass. Since is known (approximately) and , eq. 1 can be considered to be a mass-distance relation for the lens star.
Eq. 1 can be combined with a multicolor main sequence star mass-lumonosity relation (Kroupa & Tout, 1997; Gray, 1992; Drilling & Landolt, 2000) to determine the brightness and colors of the lens star as a function of its distance. This allows us to predict the properties of the combined image of the lens and source in the HST frames, as shown in Fig. 1. The fraction of the combined flux that is due to the lens, , is shown in the top panel. During the microlensing event, the lens and source were separated by mas, but the light curve indicates a relative proper motion of mas/yr. So, the lens-source separation was mas when the HST images were taken, 1.78 years after peak magnification, and color difference between the lens and source stars implies that the centroid position for the unresolved images of the lens and source will show a color dependence. This color dependent centroid shift is shown in the bottom panel of Fig. 1. This figure indicates that the lens star could contribute as much as % of the total lens+source flux and yield a B-I centroid shift of mas for a K-dwarf lens star of 0.6-0.8.
2 HST Data and Analysis
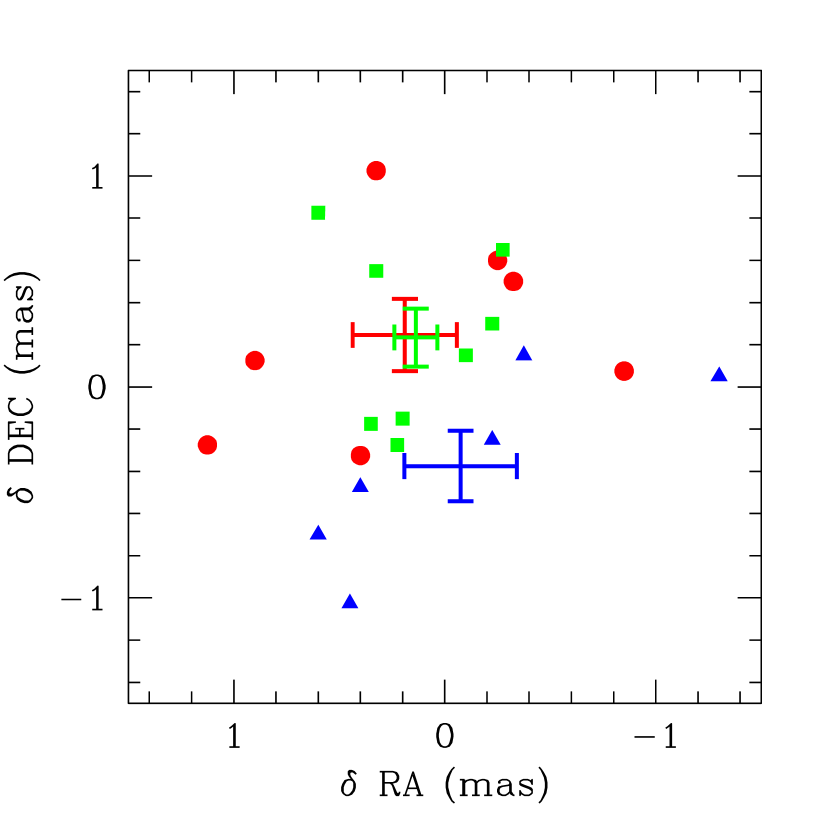
The HST data consist of 24 images with the ACS High Resolution Camera (HRC) in 3 passbands: F814W (sec exposures), F555W (sec exposures), and F435W (sec exposures). The data were analyzed with the software program img2xym_HRC, documented in Anderson & King (2004) to measure positions and fluxes for all the possible sources in each of the 24 exposures with the appropriate library PSF for each passband. We then used the WCS header and centroid positions for stars in j96c01010_drz.fits to define a reference frame. We used the crude positions in this frame for the initial 6-parameter linear transformations from the distortion-corrected frame of each exposure into the reference frame. Next, we combined the position for each star from the 24 exposures to get an average position for the star in the reference frame. We then iterated the procedure, using the above average positions as the basis for the transformations, recomputing the average positions again. We used these average positions as the basis for the final transformation from each exposure into the reference frame. Each transformation was based on about 200 stars (excluding the target star) and used only stars with positions consistent to within 0.04 pixel, so that the transformations should be good to better than 0.003 pixel (mas). This method was used to transform the position of the target star in each exposure into the reference frame, as shown in Fig. 2.
The HST photometry and astrometry were also compared directly to the OGLE I-band data. The only star in the HST frames within 0.3” of the source position is located 0.08” from the centroid of the difference image position of the source star. This object in the HST frames must be the source star, but some of the detected flux is likely to come from the lens star. This blended object has an I-band (F814W) magnitude of , whereas the microlensing fit indicates a source magnitude of (in the VEGAMAG system), where the uncertainty includes both the uncertainty in the microlensing fit and the relative normalization of the OGLE and HST photometry. The magnitude excess seen in the HST I-band frames almost certainly comes from the lens and/or binary companions to the lens or source star. If it comes from the lens, this would imply that , which would imply that the lens must be a main sequence star with according to the curve in Fig. 1.
The bottom panel of Fig. 1 indicates that we should expect color dependent centroid shifts of mas, mas, and mas. The observed centroids are shown in Fig. 2. (Two B-band and one I-band images have been removed from this comparison due to cosmic ray hits close to the target star, but including these images would not change our conclusions.) While the scatter between the individual measurements is larger than the difference between the centroids from the different passbands, there does appear to be a significant offset between the B-band and I-band centroids. The measured average centroid shifts are mas, mas, and mas (as shown in Fig. 1). These error bars are based on the dispersion in the best fit centroids in the individual images, and we have verified that the stars of similar brightness without close neighbors near the center of the image follow have a centroid shift distribution centered at zero consistent with their error bars. The measured centroids of the target are consistent with being colinear, but they are not independent. This value is consistent with expectations for a main sequence lens star of mass , while the and values are too small and too large by , respectively.
One complication to the interpretation of this event comes from the parameters of a microlensing parallax fit to this event. We find an apparent microlensing parallax signal that is significant at the level. This signal is too weak to precisely determine the direction of lens-source relative proper motion, but motion in the NW or SW direction is preferred. This contradicts the NNE direction indicated by the HST images. (The source is bluer than the lens, so the lens moves up and slightly to the left in Fig. 2). The parallax solution also prefers a smaller lens star mass, so it would have difficulty accounting for the excess I-band flux seen at the location of the source star. Thus, if we accept the parallax solution at face value, then another star located within mas of the source may be required. This is unlikely to occur by chance because the mean separation between stars in this field is mas, so an additional stellar companion to the source or lens star is the only reasonable possibility. However, a companion to lens or source could give rise to an additional acceleration (often called the xallarap effect) that can easily mimic a weak microlensing parallax signal (Poindexter et al., 2005). It is also possible that a false microlensing parallax signal could be caused by small systematic photometry errors related to seasonal variations in airmass or seeing. Because of these considerations, a potential microlensing parallax measurement is not included in our constraints.
3 Bayesian Analysis
The HST data discussed in § 2 and shown in Figs. 1 and 2 seem to favor a lens star mass of , but excess flux and centroid shift signals are in the 2.5-3.5 range. Also, there are a number of uncertainties in the event parameters, such as the source distance, that were ignored in Fig. 1. The constraints from all measurements can properly be included in a Bayesian analysis. We calculate the properties of events based upon the mass function and Galactic model used by Bennett & Rhie (2002), which employs a double-exponential disk and a Han & Gould (1995) bar model for the Galactic bulge. The source star is assumed to reside in the bulge, and the lens star can reside in either the bulge or the disk. In order to account for the apparent microlensing parallax or xallarap signal, we assume that the source star has a companion that is drawn from the same luminosity function that is used for the lens stars. In this analysis, we marginalize over the source distance and the and measurements. For each set of lens, source and source star companion magnitudes, we find the best fit source and lens star centroids to match the measurements shown in Fig. 2, subject to the constraint on .
We also allow variation in the assumed reddening and extinction. Following Bond et al. (2004), we assume reddening of for the source star, and we convert this to extinction values in the different color bands using the fitting formula of Cardelli et al. (1989) with to account for the anomalous extinction in the bulge (Udalski, 2003; Ruffle et al., 2004; Nishiyama et al., 2006). Since the lens is in the foreground of the source, the interstellar extinction for the lens star will be less than for the source. The dust in the Galactic disk is thought to follow, on average, a double-exponential distribution with a scale height of about 100 pc and the same scale length as the stellar distribution (Drimmel & Spergel, 2001), but the distribution along any line-of-sight is quite patchy. We model this uncertainty in the fraction of the total extinction that lies in the foreground of the lens with an exponential scale length of kpc, which corresponds to a scale height of about pc in the direction of this event. The variation in parameters such as and affect the calculations that determine , and , and the variation of these parameters is treated self-consistently.
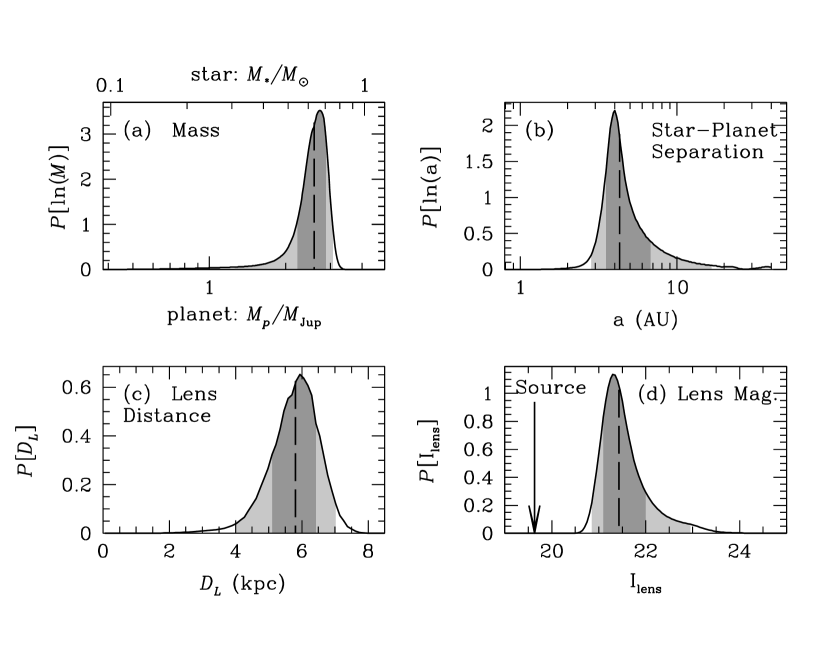
The results of our Bayesian analysis are presented in Fig. 3, and the resulting median parameter values are , , AU, kpc, and . These values are quite similar to the simple estimates given in Sec. 2, but the Bayesian analysis gives reasonable estimates of the uncertainties. With the inclusion of the HST data, the 90% c.l. range in lens star mass is 0.42-0.73, which is three times smaller than the allowed mass range without the HST data. The mass range would be substantially smaller with a higher signal-to-noise measurement of the centroid shift. (The excess brightness at the location of the source could be primarily due to a binary companion to the source, but a stronger detection of the centroid shift would exclude this possibility.) We should also note that as a result of an error in the previous analysis of the lens brightness constraint, the lens star mass range presented here is not completely included by the range presented in Bond et al. (2004).
4 Discussion and Conclusions
With the detection of the lens star for microlensing event OGLE-2003-BLG-235/MOA-2005-BLG-53 with HST images taken less than 2 years after peak magnification, we have demonstrated that the ambiguities in the interpretation of planetary microlensing light curves can readily be resolved with high angular resolution follow-up observations. The resolution of these ambiguities allows the planetary microlensing events to place more significant constraints on planet formation theories. For example, we can now confirm the core accretion theory prediction of Laughlin, Bodenheimer & Adams (2004) that the OGLE-2003-BLG-235/MOA-2005-BLG-53 planetary host star is not an M-dwarf. Instead, it is almost certainly a K-dwarf. If other gas giant planets discovered by microlensing, such as OGLE-2005-BLG-71Lb (Udalski et al., 2005) also orbit stars that are more massive than the typical microlens star, then this would confirm the core accretion theory prediction that gas giant planets form very rarely in orbit about low-mass stars (Ida & Lin, 2004; Laughlin, Bodenheimer & Adams, 2004). However, the suggestion by Laughlin, Bodenheimer & Adams (2004) that the lens star might be a white dwarf is not supported by the HST data since a white dwarf lens would be much too faint to be detected.
Although there is evidence that the lens star is detected in both the observed flux from the target star and the color dependent centroid shift, both of the signals are relatively weak. However, the centroid shift signal will grow with time, and will be 2.5 times stronger if similar observations are made in late 2007. It should also be possible to detect an additional effect: the broadening of the target star PSF. In late 2007, the lens and source will be separated by mas, or about half an HST-ACS/HRC pixel. According to detailed simulation by one of us (JA), an exposure of sec (about one orbit) should suffice to measure the PSF broadening in the F814W passband.
It should be possible to identify the lens star for most other planetary microlensing events. Because the relative proper motion, , is usually determined from light curve features for planetary microlensing events, we can routinely construct plots similar to Fig. 1 for other planetary events. The value for this event is smaller than average, so this event is not particularly favorable for such measurements. If the lens star had a lower mass, we might have to wait years after the event or obtain more exposure time to detect the centroid shift. The situation for the host star of the planet in event OGLE-2005-BLG-169, is more favorable because the relative proper motion is large, mas/yr, and the source star is about a magnitude fainter. As a result, the lens star can be detected in HST images 2 years after the event, even if it is at the bottom of the main sequence (Bennett, Anderson & Gaudi, in preparation). The only planetary microlensing event to date that may not allow the detection of the lens star is OGLE-2005-BLG-390 (Beaulieu et al., 2006), because the source star is a giant. However, the lens star for this event may be detectable in the future with the Very Large Telescope Interferometer (Beaulieu et al, in preparation). A space-based microlensing survey (Bennett & Rhie, 2002), like the proposed Microlensing Planet Finder (Bennett et al., 2004) would routinely detect the lens stars by the methods discussed in this paper without the need for follow-up observations with a different telescope.
References
- Albrow et al. (2001) Albrow, M. D., et al. 2001, ApJ, 556, L113
- Anderson & King (2004) Anderson, J. & King, I. R. 2004, Hubble Space Telescope Advanced Camera for Surveys Instrument Science Report 04-15
- Beaulieu et al. (2006) Beaulieu, J.-P., et al. 2006, Nature, 439, 437
- Bennett & Rhie (1996) Bennett, D.P. & Rhie, S.H. 1996, ApJ, 472, 660
- Bennett & Rhie (2002) Bennett, D. P. & Rhie, S. H., 2002, ApJ, 574, 985
- Bennett et al. (2004) Bennett, D. P., et al. 2004, SPIE, 5487, 1453
- Bessell & Brett (1998) Bessell, M. S. & Brett, J. M. 1988, PASP, 100, 1134
- Bond et al. (2004) Bond, I.A., et al. 2004, ApJ, 606, L155
- Boss (2006) Boss, A.P. 2006, ApJ, in press (astro-ph/0601486)
- Cardelli et al. (1989) Cardelli, J. A., Clayton, G. C., & Mathis, J. S. 1989, ApJ, 345, 245
- Drilling & Landolt (2000) Drilling, J.S. & Landolt, A.U. 2000, “Allen’s Astrophysical Quantities”, Cox, A.N., ed., Springer-Verlag, New York, pp. 388-393
- Drimmel & Spergel (2001) Drimmel, R., & Spergel, D. N. 2001, ApJ, 556, 181
- Gaudi et al. (2002) Gaudi, B. S., et al. 2002, ApJ, 566, 463
- Gould (1994) Gould, A., 1994, ApJ, 421, L71
- Gould & Loeb (1992) Gould, A. & Loeb, A. 1992, ApJ, 396, 104
- Gould et al. (2006) Gould, A., et al. 2006, ApJ, in press (astro-ph/0603267)
- Gray (1992) Gray, D.F. 1992, “The Observation and Analysis of Stellar Photospheres”, Cambridge University Press, New York.
- Han & Gould (1995) Han, C. & Gould, A. 1995, ApJ, 449, 521
- Kervella et al. (2004) Kervella, P., Thévenin, F., Di Folco, E., & Ségransan, D. 2004, A&A, 426, 297
- Ida & Lin (2004) Ida, S., & Lin, D.N.C. 2004, ApJ, 616, 567
- Kroupa & Tout (1997) Kroupa, P., & Tout, C.A. 1997, MNRAS, 287, 402
- Laughlin, Bodenheimer & Adams (2004) Laughlin, G., Bodenheimer, P., & Adams, F.C. 2004, ApJ, 612, L73
- Mao & Paczyński (1991) Mao, S. & Paczyński , B. 1991, ApJ, 374, L37
- Nishiyama et al. (2006) Nishiyama, S., et al. 2006, ApJ, 638, 839
- Poindexter et al. (2005) Poindexter, S., Afonso, C., Bennett, D. P., Glicenstein, J.-F., Gould, A., Szymański, M. K., & Udalski, A. 2005, ApJ, 633, 914
- Ruffle et al. (2004) Ruffle, P. M. E., Zijlstra, A. A., Walsh, J. R., Gray, M. D., Gesicki, K., Minniti, D., & Comeron, F. 2004, MNRAS, 353, 796
- Udalski (2003) Udalski, A. 2003, ApJ, 590, 284
- Udalski et al. (2005) Udalski, A. et al. 2005, ApJ, 628, L109
- van Belle (1999) van Belle, G. T. 1999, PASP, 111, 1515
- Wambsganss (1997) Wambsganss, T. R. 1997, MNRAS, 284, 172