GRB 050315: A step toward the uniqueness of the overall GRB structure
Abstract
Using the Swift data of GRB 050315, we progress on the uniqueness of our theoretically predicted Gamma-Ray Burst (GRB) structure as composed by a proper-GRB (P-GRB), emitted at the transparency of an electron-positron plasma with suitable baryon loading, and an afterglow comprising the so called “prompt emission” as due to external shocks. Thanks to the Swift observations, the P-GRB is identified and for the first time we can theoretically fit detailed light curves for selected energy bands on a continuous time scale ranging over seconds. The theoretically predicted instantaneous spectral distribution over the entire afterglow is presented, confirming a clear hard-to-soft behavior encompassing, continuously, the “prompt emission” all the way to the latest phases of the afterglow.
Subject headings:
gamma rays: bursts — gamma rays: observations — radiation mechanisms: thermal1. Introduction
GRB 050315 (Vaughan et al., 2006) has been triggered and located by the BAT instrument (Barthelmy, 2004; Barthelmy et al., 2005) on board of the Swift satellite (Gehrels et al., 2004) at 2005-March-15 20:59:42 UT (Parsons et al., 2005). The narrow field instrument XRT (Burrows et al., 2004, 2005) began observations s after the BAT trigger, one of the earliest XRT observations yet made, and continued to detect the source for days (Vaughan et al., 2006). The spectroscopic redshift has been found to be (Kelson & Berger, 2005).
We present here the results of the fit of the Swift data of this source in energy bands in the framework of our theoretical model (see Ruffini et al., 2001a, b, 2003, 2005c; Bianco & Ruffini, 2004, 2005a, 2005b, and references therein), pointing out a new step toward the uniqueness of the explanation of the overall GRB structure. In section 2 we recall the essential features of our theoretical model; in section 3 we fit the GRB 050315 observations by both the BAT and XRT instruments; in section 4 we present the instantaneous spectra for selected values of the detector arrival time ranging from s (i.e. during the so called “prompt emission”) all the way to s (i.e. the latest afterglow phases); in section 5 we present the conclusions.
2. Our theoretical model
A major difference between our theoretical model and the ones in the current literature (see e.g. Piran, 2004, and references therein) is that what is usually called “prompt emission” in our case coincides with the peak of the afterglow emission and is not due to the prolonged activity of an “inner engine” which, clearly, would introduce an additional and independent physical process to explain the GRB phenomenon (Ruffini et al., 2001b). A basic feature of our model consists, in fact, in a sharp distinction between two different components in the GRB structure: 1) the Proper-GRB (P-GRB), emitted at the moment of transparency of the self-accelerating -baryons plasma (see e.g. Goodman, 1986; Paczyński, 1986; Shemi & Piran, 1990; Piran et al., 1993; Mészáros et al., 1993; Grimsrud & Wasserman, 1998; Ruffini et al., 1999, 2000, 2001a, 2001b, 2006); 2) an afterglow described by external shocks and composed of three different regimes (see Ruffini et al., 1999, 2000, 2001b, 2003, and references therein). The first afterglow regime corresponds to a bolometric luminosity monotonically increasing with the photon detector arrival time, corresponding to a substantially constant Lorentz gamma factor of the accelerated baryons. The second regime consists of the bolometric luminosity peak, corresponding to the “knee” in the decreasing phase of the baryonic Lorentz gamma factor. The third regime corresponds to a bolometric luminosity decreasing with arrival time, corresponding to the late deceleration of the Lorentz gamma factor. In some sources the P-GRB is under the observability threshold. In Ruffini et al. (2001b) we have chosen as a prototype the source GRB 991216 which clearly shows the existence of the P-GRB and the three regimes of the afterglow. Unfortunately, data from BATSE existed only up to s, and data from R-XTE and Chandra only after s, leaving our theoretical predictions in the whole range between s and s without the support of the comparison with observational data. Nevertheless, both the relative intensity of the P-GRB to the peak of the afterglow in such source, as well as their corresponding temporal lag, were theoretically predicted within a few percent (see Fig. 11 in Ruffini et al. (2003)).
The verification of the validity of our model has been tested in a variety of other sources, beside GRB 991216 (Ruffini et al., 2003), like GRB 980425 (Ruffini et al., 2004b), GRB 030329 (Bernardini et al., 2006), GRB 031203 (Bernardini et al., 2005). In all such sources, again, the observational data were available only during the prompt emission and the latest afterglow phases, leaving our theoretical predictions of the in-between evolution untested. Now, thanks to the data provided by the Swift satellite, we are finally able to confirm, by direct confrontation with the observational data, our theoretical predictions on the GRB structure with a detailed fit of the complete afterglow light curve of GRB 050315, from the peak, including the “prompt emission”, all the way to the latest phases without any gap in the observational data.
3. The fit of the observations
The best fit of the observational data leads to a total energy of the black hole dyadosphere, generating the plasma, erg (the observational Swift is erg, see Vaughan et al., 2006), so that the plasma is created between the radii cm and cm with an initial temperature and a total number of pairs . The second parameter of the theory, the amount of baryonic matter in the plasma, is found to be such that . The transparency point and the P-GRB emission occurs then with an initial Lorentz gamma factor of the accelerated baryons at a distance cm from the black hole.
3.1. The BAT data
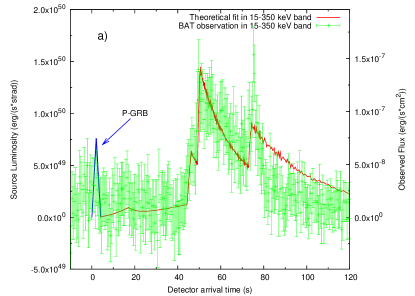
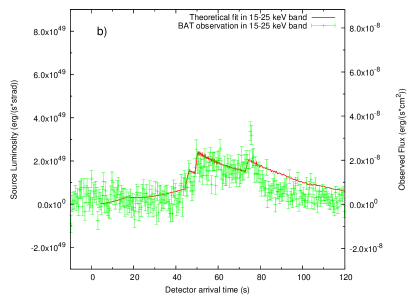
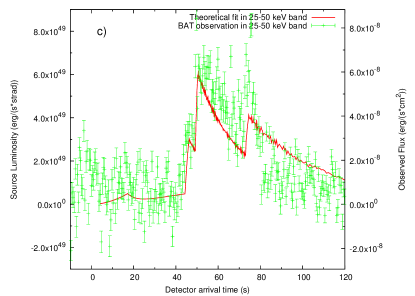
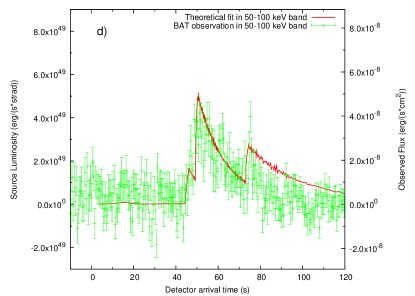
In Fig. 1 we represent our theoretical fit of the BAT observations in the three energy channels – keV, – keV and – keV and in the whole – keV energy band.
In our model the GRB emission starts at the transparency point when the P-GRB is emitted; this instant of time is often different from the moment in which the satellite instrument triggers, due to the fact that sometimes the P-GRB is under the instrumental noise threshold or comparable with it. In order to compare our theoretical predictions with the observations, it is important to estimate and take into account this time shift. In the present case of GRB 050315 it has been observed (see Vaughan et al., 2006) a possible precursor before the trigger. Such a precursor is indeed in agreement with our theoretically predicted P-GRB, both in its isotropic energy emitted (which we theoretically predict to be erg) and its temporal separation from the peak of the afterglow (which we theoretically predicted to be s). In Fig. 1a the blue line shows our theoretical prediction for the P-GRB in agreement with the observations.
After the P-GRB emission, all the observed radiation is produced by the interaction of the expanding baryonic shell with the interstellar medium. In order to reproduce the complex time variability of the light curve of the prompt emission as well as of the afterglow, we describe the ISM filamentary structure, for simplicity, as a sequence of overdense spherical regions separated by much less dense regions. Such overdense regions are nonhomogeneously filled, leading to an effective emitting area determined by the dimensionless parameter , where is the expanding baryonic shell visible area (see Ruffini et al., 2004a, 2005a, for details). Clearly, in order to describe any detailed structure of the time variability an authentic three dimensional representation of the ISM structure would be needed. However, this finer description would not change the substantial agreement of the model with the observational data. Anyway, in the “prompt emission” phase, the small angular size of the source visible area due to the relativistic beaming makes such a spherical approximation an excellent one (see also Ruffini et al., 2002, for details).
The structure of the “prompt emission” has been reproduced assuming three overdense spherical ISM regions with width and density contrast : we chose for the first region, at cm, cm and , for the second region, at cm, cm and and for the third region, at cm, cm and . The ISM mean density during this phase is particles/cm3 and . With this choice of the density mask we obtain agreement with the observed light curve, as shown in Fig. 1. A small discrepancy occurs in coincidence with the last peak: this is due to the fact that at this stage the source visible area due to the relativistic beaming is comparable with the size of the clouds, therefore the spherical shell approximation should be duly modified by a detailed analysis of a full three-dimensional treatment of the ISM filamentary structure. Such a topic is currently under investigation (see also Ruffini et al., 2002, for details). Fig. 1 shows also the theoretical fit of the light curves in the three BAT energy channels in which the GRB has been detected (– keV in Fig. 1b, – keV in Fig. 1c, – keV in Fig. 1d).
3.2. The XRT data
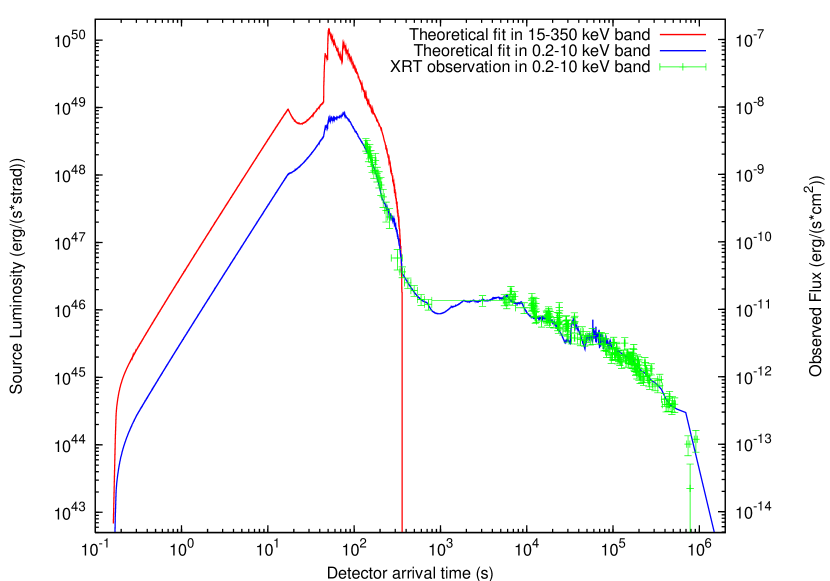
The same analysis can be applied to explain the features of the XRT light curve in the afterglow phase. It has been recently pointed out (Nousek et al., 2006) that almost all the GRBs observed by Swift show a “canonical behavior”: an initial very steep decay followed by a shallow decay and finally a steeper decay. In order to explain these features many different approaches have been proposed (Mészáros, 2006; Nousek et al., 2006; Panaitescu et al., 2006; Zhang et al., 2006). In our treatment these behaviors are automatically described by the same mechanism responsible for the prompt emission described above: the baryonic shell expands in an ISM region, between cm and cm, which is significantly at lower density ( particles/cm3, ) then the one corresponding to the prompt emission, and this produces a slower decrease of the velocity of the baryons with a consequent longer duration of the afterglow emission. The initial steep decay of the observed flux is due to the smaller number of collisions with the ISM. In Fig. 2 is represented our theoretical fit of the XRT data, together with the theoretically computed – keV light curve of Fig. 1a (without the BAT observational data to not overwhelm the picture too much).
What is impressive is that no different scenarios need to be advocated in order to explain the features of the light curves: both the prompt and the afterglow emission are just due to the thermal radiation in the comoving frame produced by inelastic collisions with the ISM duly boosted by the relativistic transformations over the EQTSs.
4. The instantaneous spectrum
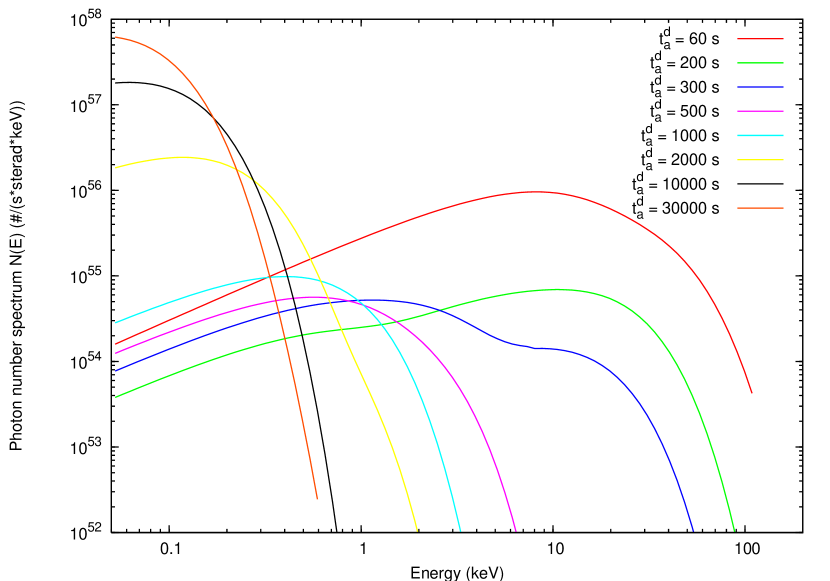
In addition to the the luminosity in fixed energy bands we can derive also the instantaneous photon number spectrum starting from the same assumptions. In Fig. 3 are shown samples of time-resolved spectra for eight different values of the arrival time which cover the whole duration of the event. It is manifest from this picture that, although the spectrum in the co-moving frame of the expanding pulse is thermal, the shape of the final spectrum in the laboratory frame is clearly non thermal. In fact, as explained in Ruffini et al. (2004a), each single instantaneous spectrum is the result of an integration of thousands of thermal spectra over the corresponding EQTS. This calculation produces a non thermal instantaneous spectrum in the observer frame (see Fig. 3).
A distinguishing feature of the GRBs spectra which is also present in these instantaneous spectra is the hard to soft transition during the evolution of the event (Crider et al., 1997; Frontera et al., 2000; Ghirlanda, Celotti & Ghisellini, 2002). In fact the peak of the energy distribution drifts monotonically to softer frequencies with time. This feature is linked to the change in the power-law low energy spectral index (Band et al., 1993), so the correlation between and (Crider et al., 1997) is explicitly shown.
It is important to stress that there is no difference in the nature of the spectrum during the prompt and the afterglow phases: the observed energy distribution changes from hard to soft, with continuity, from the “prompt emission” all the way to the latest phases of the afterglow.
5. Conclusions
Before the Swift data, our model could not be directly fully tested. With GRB 050315, for the first time, we have obtained a good match between the observational data and our predicted intensities, in energy bands, with continuous light curves near the beginning of the GRB event, including the “prompt emission”, all the way to the latest phases of the afterglow. This certainly supports our model and opens a new phase of using it to identify the astrophysical scenario underlying the GRB phenomena. In particular:
-
1.
We have demonstrated that the “prompt emission” is not necessarily due to the prolonged activity of an “inner engine”, but corresponds to the emission at the peak of the afterglow.
-
2.
We have a clear theoretical prediction on the total energy emitted in the P-GRB erg and on its temporal separation from the peak of the afterglow s. To understand the physics of the inner engine more observational and theoretical attention should be given to the analysis of the P-GRB.
-
3.
We have uniquely identified the basic parameters characterizing the GRB energetics: the total energy of the black hole dyadosphere erg and the baryon loading parameter .
-
4.
The “canonical behavior” in almost all the GRB observed by Swift, showing an initial very steep decay followed by a shallow decay and finally a steeper decay, as well as the time structure of the “prompt emission” have been related to the fluctuations of the ISM density and of the parameter.
-
5.
The theoretically predicted instantaneous photon number spectrum shows a very clear hard-to-soft behavior continuously and smoothly changing from the “prompt emission” all the way to the latest afterglow phases.
Only the first afterglow regime we theoretically predicted, which corresponds to a bolometric luminosity monotonically increasing with the photon detector arrival time, preceding the “prompt emission”, still remains to be checked by direct observations. We hope in the near future to find an intense enough source, observed by the Swift satellite, to verify this still untested theoretical prediction.
As a byproduct of the results presented in this Letter, we can explain one of the long lasting unanswered puzzles of GRBs: the light curves in the “prompt emission” show very strong temporal substructures, while they are remarkably smooth in the latest afterglow phases. The explanation follows from three factors: 1) the value of the Lorentz factor, 2) the EQTS structure and 3) the coincidence of the “prompt emission” with the peak of the afterglow. For , at the peak of the afterglow, the diameter of the EQTS visible area due to relativistic beaming is small compared to the typical size of an ISM cloud. Consequently, any small inhomogeneity in such a cloud produces a marked variation in the GRB light curve. On the other hand, for , in the latest afterglow phases, the diameter of the EQTS visible area is much bigger than the typical size of an ISM cloud. Therefore, the observed light curve is a superposition of the contribution of many different clouds and inhomogeneities, which produces on average a much smoother light curve (details in Ruffini et al., 2002, 2003).
References
- Band et al. (1993) Band, D., et al. 1993, ApJ, 413, 281.
- Barthelmy (2004) Barthelmy, S.D. 2004, SPIE, 5165, 175.
- Barthelmy et al. (2005) Barthelmy, S.D., et al. 2005, Sp. Sc. Rev., 120, 143.
- Bernardini et al. (2005) Bernardini, M.G., Bianco, C. L., Chardonnet, P., Fraschetti, F., Ruffini, R., & Xue, S. S. 2005, ApJ, 634, L29.
- Bernardini et al. (2006) Bernardini, M.G., Bianco, C. L., Chardonnet, P., Fraschetti, F., Ruffini, R., & Xue, S. S. 2006, in “Proceedings of the tenth Marcel Grossmann Meeting”, M. Novello, S.E. Perez-Bergliaffa (eds.), World Scientific, Singapore, in press.
- Bianco & Ruffini (2004) Bianco, C.L., & Ruffini, R. 2004, ApJ, 605, L1.
- Bianco & Ruffini (2005a) Bianco, C.L., & Ruffini, R. 2005a, ApJ, 620, L23.
- Bianco & Ruffini (2005b) Bianco, C.L., & Ruffini, R. 2005b, ApJ, 633, L13.
- Burrows et al. (2004) Burrows, D.N., et al. 2004, SPIE, 5165, 201.
- Burrows et al. (2005) Burrows, D.N., et al. 2005, Sp. Sc. Rev., 120, 165.
- Crider et al. (1997) Crider, A., et al. 1997, ApJ, 479, L39.
- Frontera et al. (2000) Frontera, F., et al. 2000, ApJS, 127, 59.
- Gehrels et al. (2004) Gehrels, N., et al. 2004, ApJ, 611, 1005.
- Ghirlanda, Celotti & Ghisellini (2002) Ghirlanda, G., Celotti, A., & Ghisellini, G. 2002, A&A, 393, 409.
- Goodman (1986) Goodman, J. 1986, ApJ, 308, L47.
- Grimsrud & Wasserman (1998) Grimsrud, O.M., & Wasserman, I. 1998, MNRAS, 300, 1158.
- Kelson & Berger (2005) Kelson, D., & Berger, E. 2005, GCN 3101.
- Mészáros et al. (1993) Mészáros, P., Laguna, P., & Rees, M.J. 1993, ApJ, 415, 181.
- Mészáros (2006) Mészáros, P. 2006, in “16th Annual October Astrophysics Conference in Maryland”, S. Holt, N. Gehrels, J. Nousek (eds.), AIP Conf. Proc., in press (astro-ph/0601661).
- Nousek et al. (2006) Nousek, J.A., et al. 2006, ApJ, in press (astro-ph/0508332).
- Paczyński (1986) Paczyński, B. 1986, ApJ, 308, L43.
- Panaitescu et al. (2006) Panaitescu, A., Mészáros, P., Gehrels, N., Burrows, D., & Nousek, J. 2006, MNRAS, 366, 1357.
- Parsons et al. (2005) Parsons, A., et al. 2005, GCN 3094.
- Piran et al. (1993) Piran, T., Shemi, A., & Narayan, R. 1993, MNRAS, 263, 861.
- Piran (2004) Piran, T. 2004, Rev. Mod. Phys., 76, 1143.
- Ruffini et al. (2005c) Ruffini, R., Bernardini, M.G., Bianco, C. L., Chardonnet, P., Fraschetti, F., Gurzadyan, V., Vitagliano, L., & Xue, S. S. 2005c, in “COSMOLOGY AND GRAVITATION: Brazilian School of Cosmology and Gravitation”, M. Novello, S.E. Perez Bergliaffa (eds.), AIP Conf. Proc. 782, 42.
- Ruffini et al. (2001a) Ruffini, R., Bianco, C. L., Chardonnet, P., Fraschetti, F., & Xue, S. S. 2001a, ApJ, 555, L107.
- Ruffini et al. (2001b) Ruffini, R., Bianco, C. L., Chardonnet, P., Fraschetti, F., & Xue, S. S. 2001b, ApJ, 555, L113.
- Ruffini et al. (2002) Ruffini, R., Bianco, C. L., Chardonnet, P., Fraschetti, F., & Xue, S. S. 2002 ApJ, 581, L19.
- Ruffini et al. (2003) Ruffini, R., Bianco, C. L., Chardonnet, P., Fraschetti, F., Vitagliano, L., & Xue, S. S. 2003, in “COSMOLOGY AND GRAVITATION: Xth Brazilian School of Cosmology and Gravitation; 25th Anniversary (1977-2002)”, M. Novello, S.E. Perez Bergliaffa (eds.), AIP Conf. Proc. 668, 16.
- Ruffini et al. (2004a) Ruffini, R., Bianco, C. L., Chardonnet, P., Fraschetti, F., Gurzadyan, V., & Xue, S. S. 2004a, Int. Journ. Mod. Phys. D, 13, 843.
- Ruffini et al. (2004b) Ruffini, R., Bianco, C. L., Chardonnet, P., Fraschetti, F., & Xue, S. S. 2004b, Adv. Sp. Res., 34, 2715.
- Ruffini et al. (2005a) Ruffini, R., Bianco, C. L., Chardonnet, P., Fraschetti, F., Gurzadyan, V., & Xue, S. S. 2005a, Int. J. Mod. Phys. D 14, 97.
- Ruffini et al. (2006) Ruffini, R., Bianco, C.L., Vereshchagin, G., & Xue, S.-S. 2006, in “Proceedings of the Relativistic Astrophysics and Cosmology - Einstein’s Legacy meeting”, B. Aschenbach, V. Burwitz, G. Hasinger, B. Leibundgut (eds.), Springer-Verlag, in press.
- Ruffini et al. (1999) Ruffini, R., Salmonson, J. D., Wilson, J. R., & Xue, S. S. 1999, A&A, 350, 334.
- Ruffini et al. (2000) Ruffini, R., Salmonson, J. D., Wilson, J. R., & Xue, S. S. 2000, A&A, 359, 855.
- Shemi & Piran (1990) Shemi, A., & Piran, T. 1990, ApJ, 365, L55.
- Vaughan et al. (2006) Vaughan, S., et al. 2006, ApJ, 638, 920.
- Zhang et al. (2006) Zhang, B., et al. 2006, ApJ, in press (astro-ph/0508321)