DEEP NEAR-INFRARED IMAGING OF
AN EMBEDDED CLUSTER
IN THE EXTREME OUTER GALAXY:
CENSUS OF SUPERNOVAE TRIGGERED
STAR FORMATION
111Based on data collected at Subaru Telescope,
which is operated by the National Astronomical Observatory of Japan.
Abstract
While conducting a near-infrared (NIR) survey of “Digel Clouds”, which are thought to be located in the extreme outer Galaxy (EOG), Kobayashi & Tokunaga found star formation activity in “Cloud 2”, a giant molecular cloud at the Galactic radius of 20 kpc. Additional infrared imaging showed two embedded young clusters at the densest regions of the molecular cloud. Because the molecular cloud is located in the vicinity of a supernova remnant (SNR) HI shell, GSH 138-01-94, it was suggested that the star formation activity in Cloud 2 was triggered by this expanding HI shell. We obtained deep J (1.25m), H (1.65m) and K (2.2m) images of one of the embedded clusters in Cloud 2 with high spatial resolution (FWHM ) and high sensitivity (K 20 mag, 10). We identified 52 cluster members. The estimated stellar density ( 10 pc-2) suggests that the cluster is a T-association. This is the deepest NIR imaging of an embedded cluster in the EOG. The observed K-band luminosity function (KLF) suggests that the underlying initial mass function (IMF) of the cluster down to the detection limit of is not significantly different from the typical IMFs in the field and in the near-by star clusters. The overall characteristics of this cluster appears to be similar to those of other embedded clusters in the far outer Galaxy. The estimated age of the cluster from the KLF , which is less than 1 Myr, is consistent with the view that the star formation was triggered by the HI shell whose age was estimated at 4.3 Myr (Stil & Irwin). The 3-dimensional geometry of SNR shell, molecular cloud and the embedded cluster, which is inferred from our data, as well as the cluster age strongly suggest that the star formation in Cloud 2 was triggered by the SNR shell.
1 Introduction
The extreme outer Galaxy (EOG), whose Galactic radius () is more than 18 kpc, is known to be a very low-density and low-metallicity region. Because the distribution limit of population I and II stars are 18-19 kpc and 14 kpc, respectively, the star forming process in such environment has not been studied as well as near-by star forming regions or star forming regions in the inner Galaxy due to the faintness of the sources. The EOG also serves as an excellent laboratory for the study of star forming process because there is no complex star formation history as in the inner Galaxy.
“Cloud 2” is one of the molecular clouds in the outermost Galaxy region discovered by Digel et al. (1994) based on CO observations of distant HI peaks in the Maryland-Green Bank survey (Westerhout & Wendlandt, 1982). It is located at a very large Galactic radius ( = 1828 kpc) in the second quadrant of the Galaxy (). It is the largest molecular cloud (M 1 104 M⊙; Digel et al. (1994)) among those in the outermost region. The Galactic radius of Cloud 2 has been estimated by various methods: kpc (heliocentric distance: 21 kpc) from the kinematic distance of CO (Digel et al., 1994), 23.6 kpc ( kpc) from the latest HI observation (Stil & Irwin, 2001), and 1519 kpc ( 8.212 kpc) from the optical spectroscopy of a B-type star, MR-1 (Muzzio & Rydgren, 1974; Smartt et al., 1996), which is thought to be associated with Cloud 2 (de Geus et al., 1993). Throughout this paper we adopt =19 kpc (12 kpc) because it is about the mean value of all the estimated distances and because spectroscopic distance of stars should be more accurate than kinematic distance. Metallicity at the Galactic radius of Cloud 2 is estimated at -1.0 dex from the standard metallicity curve by Smartt & Rolleston (1997). In fact, the metallicity of the B-type star, MR-1, is measured at 0.5 to 0.8 dex (Smartt et al., 1996; Rolleston et al., 2000) and that of the Cloud 2 itself, is measured at -0.7 dex from the radio molecular emission lines (Lubowich et al., 2004). These metallicity values are comparable to that of LMC ( dex) and SMC ( dex) (Arnault et al., 1988). Also, Cloud 2 was found to be located in the vicinity of a large SNR HI shell (GSH 138-01-94) which has an almost complete spherical shape with a radius of 180 pc (Stil & Irwin, 2001).
Kobayashi & Tokunaga (2000) found young stellar objects in Cloud 2 with a wide field near-infrared survey. Kobayashi et al. (2005) also found two young stellar clusters at the northern and southern CO peaks of Cloud 2 with deeper near-infrared imaging with UH 2.2m telescope. They suggested from the geometry of the clusters and SNR HI shell that the star formation activity in Cloud 2 was triggered by the SNR HI shell. Cloud 2 may be the clearest example of SN triggered star formation, which makes use of the advantage of the “star formation laboratory” in the EOG. As a next step, we obtained deep high-resolution images of the stellar clusters in Cloud 2 with the Subaru 8.2 m telescope for studying the details of the SN triggered star formation. Here we present the results for the stellar cluster in the northern CO peak of Cloud 2 (hereafter “Cloud2-N cluster”).
2 Observations and Data Reduction
2.1 Subaru IRCS imaging
We have obtained J(1.25 m), H(1.65 m) and K(2.2 m)-band deep images of the Cloud2-N cluster. The observation was conducted on 2000 December 1 UT with the Subaru Infrared Camera and Spectrograph IRCS (Tokunaga et al. 1998, Kobayashi et al. 2000, Terada et al. 2004) with the pixel scale of 0058/pixel. The entire infrared cluster was sufficiently covered with the 1′ field-of-view. IRCS employs the Mauna Kea Observatory (MKO) near-infrared photometric filters (Tokunaga, Simons & Vacca 2002). The total integration time was 600, 675, and 1350 sec for J, H, and K-bands, respectively. The observing condition was photometric and the seeing was excellent (03) through the observing period.
2.2 Data Reduction
All the data for each band were reduced with IRAF222IRAF is distributed by the National Optical Astronomy Observatories, which are operated by the Association of Universities for Research in Astronomy, Inc., under cooperative agreement with the National Science Foundation. with standard procedures: dark subtraction, flat-fielding, bad-pixel correction, median-sky subtraction, image shifts with dithering offsets, and combining. The stellar FWHM in final images of -bands are , respectively. photometry has been performed using IRAF APPHOT with a diameter aperture (10 pixel) except for a binary with separation for which a diameter aperture was applied with an aperture correction. 2MASS 02484460+5828284 () in the field was used as a photometric standard star after converting the 2MASS system to the MKO system using the color transformations from S. K. Legett (private comm.). The flux uncertainty in the aperture was estimated from the standard deviation of the flux in 900 independent apertures in the blank sky. Compared to the flux uncertainty estimated by APPHOT from pixel-to-pixel variation, is larger by a factor of 1.20, 1.14, 1.34 for -bands, respectively. The resultant limiting magnitudes in -bands were estimated at 21.12, 19.96, 20.03 mag (10), respectively. In total 138 stars were detected in the -band brighter than this limiting magnitude.
3 RESULTS
3.1 Identification of Cloud2-N Members
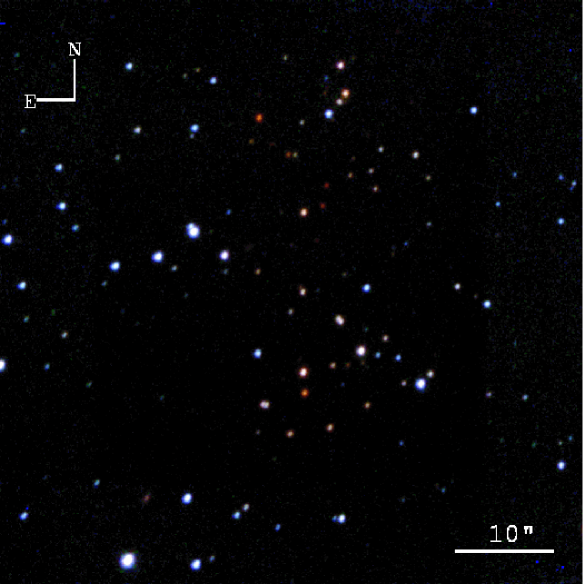
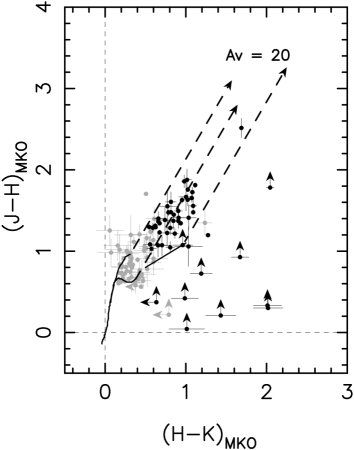
We constructed a pseudo color picture of the observed field (Fig. 1) and the versus color-color diagram of all the detected sources (Fig. 2). The cluster was first recognized by Kobayashi et al. (2005) as a loosely packed cluster of red sources in a region (see Fig. 1). The colors of all the visually selected red sources from Fig. 1 were found to have . The sources with bluer color () were found to be distributed uniformly in the field. Therefore, we identified the cluster members with the following two criteria: 1) , 2) distributed in region at the center. As a result, we found 52 cluster members out of 138 sources in the field. Because there are no foreground molecular clouds in front of Cloud 2 (Kobayashi & Tokunaga, 2000), the red colors of the cluster members should originate from the extinction by Cloud 2 itself as well as by circumstellar material (see section 5.3 for more discussion). Contamination from the background sources should be very small in view of the large of Cloud 2.
3.2 Extinction and Disk Color Excess
The extinction and disk color excess for each star were estimated using the color-color diagram. Those parameters will be used for constructing model KLFs in section 4. For reliable estimation of the parameters, stars only in the positions reddened from the classical T Tauri star (CTTS) locus (Meyer et al., 1997) and the dwarf locus (42 cluster members and 32 field stars) are used. For convenience the dwarf locus was approximated by the extension of the CTTS locus drawn out to mag. In the color-color diagram the extinction Av of each star was estimated from the distance along the reddening vector (Rieke & Lebofsky, 1985) between its location and the stellar loci. The resultant Av distributions of the cluster members and the field stars (Fig. 3) have a peak at 6.4 mag (AK = 0.72 mag) and 1.8 mag (AK = 0.20 mag), respectively. The distribution of the cluster members shows that the whole cluster is reddened uniformly by a screen of dust with Av=6 mag. This verifies the selection method of cloud members described in section 3.1. The distributions of the residual color of cloud members and field stars show a clear difference (Fig. 4). The distributions of for cluster members and field stars are similar to those for the typical star forming regions such as the Trapezium cluster (Muench et al., 2002): the peak of distribution is at mag and mag for field stars and cluster members, respectively. The difference of the average of field stars and cluster members (0.21 mag) can be attributed to thermal emission of circumstellar disks of cluster members. Assuming that disk emission appears in K-band and does not appear in H-band, the disk color excess of the cluster members in K-band, , is equal to 0.21 mag.
3.3 Stellar Density
Stellar density of the Cloud2-N cluster was estimated at pc-2 from the spatial distribution of the identified cluster members in the pc2 area. Star forming regions show a wide range of stellar density from pc-2 for T-associations to pc-2 for OB-associations in the area of pc diameter (e.g., Lada, 1999). The estimated stellar density suggests, therefore, that T-association-type star formation is on-going in Cloud2-N.
3.4 K-band Luminosity Function (KLF)
We constructed a K-band luminosity function (KLF) of the identified cloud members with the K-band apparent magnitude plotted on the horizontal axis and the number of stars plotted on the vertical axis. We estimated the detection completeness in each magnitude bin by putting artificial stars on random positions in the field and checking whether they are detected in the same way as for the photometry. Five stars are placed at a time in each magnitude bin and the check was conducted 200 times, resulting in about 1000 artificial stars per magnitude bin. The result is summarized in Table 1, and KLFs before and after the completeness correction are shown in Fig 5.
4 Model KLF
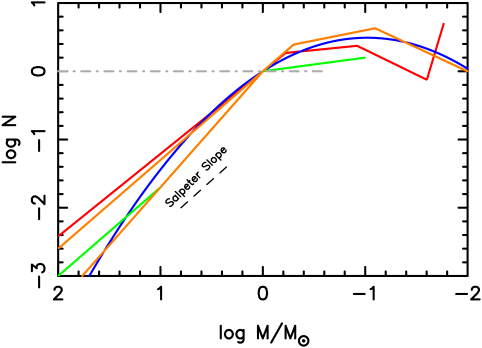
Although our final goal is to find out the IMF and star forming efficiency in low-metallicity environment in EOG, many physical parameters in such an environment are unknown. Therefore, as a first step, we assumed the typical IMFs in the field and in the near-by star clusters, and tried to see whether the resultant other parameters are consistent or not. The “typical IMFs” include the cluster IMF in the Trapezium (Muench et al., 2002), IMFs by Miller & Scalo (1979), Scalo (1998), and the average IMF by Kroupa (2002). Among many observed cluster IMFs, we used the Trapezium IMF because it is the most reliable IMF for young clusters (e.g., Lada & Lada, 2003). Figure 6 shows all these IMFs with their originally-defined mass ranges.
We constructed simple model KLFs for selected ages with the following procedures: 1) assume an IMF, 2) convert the mass function to a luminosity function using a mass-luminosity (M-L) relation from an isochrone model, 3) convert the luminosity to a K absolute magnitude, , with bolometric correction, 4) convert the to an apparent magnitude with the distant modulus of Cloud 2. We repeated this process for all four IMFs. In this process we assumed that all stars are formed instantaneously without any age spread. We constructed model KLFs with ages of 0.1, 0.5, 1, 2 Myr. The isochrone by D’Antona et al. (1994, 1998), and the bolometric correction by Muench et al. (2000) were applied. There is no isochrone model for low-metallicity environment like Cloud 2 ( dex). However, the M-L relation for Cloud 2 is expected to be similar to that for solar metallicity in view of the very little difference of M-L relation for the solar metallicity and the metallicity of 0.3 dex (D’Antona et al., 1994, 1998). Therefore, we assumed that the M-L relation for solar metallicity can be applied to the Cloud2-N cluster. The mass range used for constructing the KLF is 0.017 3 M⊙, which is the range of the above isochrone.
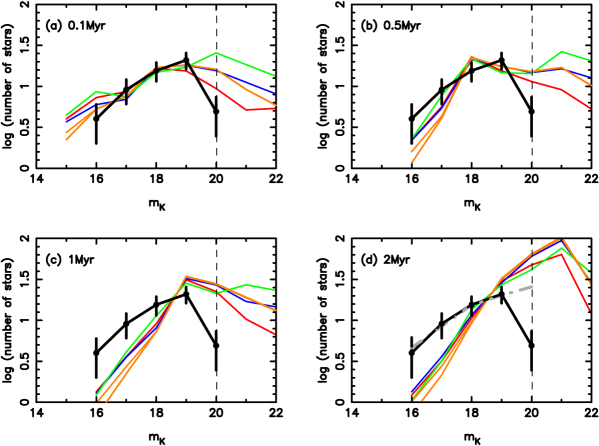
Lastly considering the and estimated in section 3.2, the model KLF was shifted to the fainter magnitude side by 0.72 mag () and to the brighter magnitude side by 0.21 mag (). Finally the model KLFs were normalized so that numbers of stars in the magnitude range 16.519.5 mag are the same as those for the Cloud2-N cluster. The resultant model KLFs are shown in Fig. 7 with the completeness-corrected KLF of the Cloud2-N cluster. The mass of the star with mag is 2.5M⊙ and that with mag is 0.12M⊙ at the age of 0.5 Myr. As shown in Fig. 7, the mass range used for constructing the KLFs (0.017 3 M⊙) sufficiently covers the observed KLF at the fainter magnitude side while the coverage is marginal at the brightest magnitude side especially for older ages ( Myr). Muench et al. (2000) pointed out that the insufficient mass range can cause an underestimate of the number of stars near the edge of the magnitude range (see section 3.1.3 and the upper panel in Fig. 5 in Muench et al. (2000)). In our case, this can affect only the brightest magnitude bin of the model KLFs. However, the shape of the model KLFs is well-determined without this magnitude bin and we conclude that the following discussions, especially on age determination, are not affected by this effect.
5 DISCUSSION
5.1 Age of the Cloud2-N cluster
Because KLFs of different ages are known to have different peak magnitudes, the age of the young clusters can be estimated. The comparison of the observed KLF with the model KLFs in Figure 7 suggests that the age of the Cloud2-N cluster is less than 1 Myr and most likely no more than 0.5 Myr. It is difficult to estimate the age of the cluster with an accuracy of 0.1 Myr because isochrone models for ages of less than 1 Myr is thought to be uncertain (Baraffe et al., 2002). However, we can at least conclude that the age of the Cloud2-N cluster is no more than 1 Myr from the above comparison (Fig. 7).
There are still two uncertainties which have not been considered in the model KLFs. First, the distance to Cloud 2 has a moderate uncertainty around the most likely value kpc (distance modulus (DM) = 15.4 mag) (see section 1). However, we found that the estimated age from model KLFs is still Myr for the nearest possible distance ( kpc, DM = 21.1 mag) and the age is even younger than 0.1 Myr for the most distant case ( kpc, DM = 14.6 mag). The second uncertainty comes from the possible large difference of IMF from the typical IMFs because of the special environment of the EOG. In this case, the age of the cluster could be much older than 1 Myr. The comparison of the observed KLF and the model KLFs for ages more than 2 Myr suggests that the IMF could have been significantly weighted to higher mass compared to the typical IMFs if the age of the cluster were more than 2 Myr. To check this we tried to fit the slope of the observed KLF in = 16 19 range assuming the age of 2 Myr (see the dot-dashed line in Figure 7d). The necessary IMF slope for this fitting required a very unrealistic slope of the IMF at the stellar mass 1 M⊙ (see the grey dashed line in Figure 6). This is also highly unlikely because the stellar density of the cluster suggests that it is T-association (see section 3.3), which does not have a significant number of high-mass stars. Therefore, even with the uncertainties, we can conclude that the age of the Cloud2-N cluster is less than 1 Myr.
5.2 Comparison with Other Embedded Clusters in the Far Outer Galaxy
Santos et al. (2000) discovered two distant embedded young clusters in far outer Galaxy ( kpc; kpc) with near-infrared imaging of a CO cloud associated with an IRAS source. Their detection-limit (mag) corresponds to a 1 Myr star seen through 10 mag of visual extinction. Snell, Carpenter, & Heyer (2002) has conducted a comprehensive NIR survey of embedded clusters in far outer Galaxy ( kpc) based on the FCRAO CO survey in the far outer Galaxy. They have found 11 embedded clusters with the detection limit of mag. For the most distant cluster, this magnitude corresponds to a 1 Myr old 0.6 star with no extinction, or a 1 Myr old 1.3 star seen through 10 mag of visual extinction. These pioneering works revealed the existence of embedded clusters in the far outer Galaxy for the first time. Most importantly Snell et al.’s comprehensive work found that the star formation activity that is similar to that found throughout the Galaxy is ubiquitously present in the far outer Galaxy.
Our NIR imaging is the first deep NIR imaging of the embedded cluster in the far outer Galaxy with the detection limit of , which is 3-4 mag deeper than the previous studies. Assuming that the age of the Cloud2-N cluster is 0.5 Myr old (section 5.1), the mass of the brightest star () is and the mass of the faintest star ( is , taking into account AV = 6.4 mag and the disk color excess mag (section 3.2). Despite the largest distance ( kpc; kpc) of the Cloud 2-N cluster among the embedded clusters in the far outer Galaxy, our deep imaging has reached to the limit close to the substellar mass range for the first time. Because the model KLFs based on the typical IMFs reasonably fit the observed KLF including the peak near , we suggest that the IMF of the Cloud 2-N cluster can be approximated with the typical IMFs. An assessment to more accurate IMF requires an independent study of the age of the cluster based on spectroscopy of each cloud members.
Snell et al. (2002) found cluster members for the 11 embedded clusters in the far outer Galaxy with the detection limit of mag ( mag). Santos et al. (2000) found cluster members for a cluster in the far outer Galaxy with the detection limit of mag ( mag). The numbers of stars with those detection limits are consistent with that in the near-by embedded clusters within 1 kpc from the solar system. We have detected 20 cluster members in Cloud2-N down to mag and 40 cluster members down to mag. Therefore, the properties of the Cloud 2-N cluster appear to be quite similar to the star clusters found by Snell et al and Santos et al.
5.3 Supernova Triggered Star Formation
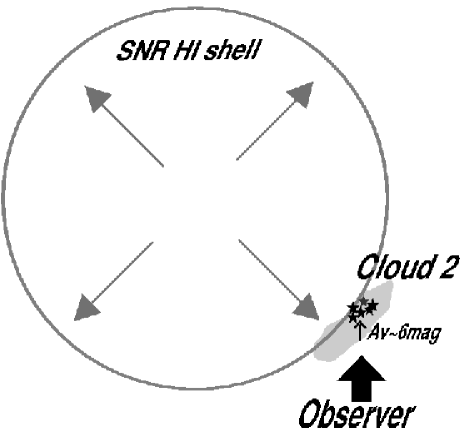
Kobayashi et al. (2005) suggested that the supernova remnant (SNR) HI shell (GSH138-01-94; Stil & Irwin, 2001) triggered the star formation activity in Cloud 2. The uniform extinction of the cluster members ( mag) measured in section 3.2 is close to the total extinction of Cloud2-N that is estimated at mag from 13CO data (Digel et al., 1994), suggesting that the formation of the Cloud2-N cluster occurs behind Cloud 2. The geometry of the SNR HI shell, Cloud 2-N, and Cloud2-N cluster is summarized in Fig. 8. In section 5.1, the age of Cloud2-N cluster was estimated at 1 Myr, which is much less than that of the SNR HI shell (4.3 Myr). These facts strongly suggest that the star formation activity in Cloud 2 was triggered by the SNR HI shell.
References
- Arnault et al. (1988) Arnault, P., Knuth, D., Casoli, F., & Combes, F. 1988, A&A, 205, 41
- Baraffe et al. (2002) Baraffe, I., Chabrier, G., Allard, F., & Hauschildt, P. H. 2002, A&A, 382 563
- Bessel & Brett (1988) Bessell, M. S. & Brett, J. M. 1988, PASP, 100 1134
- D’Antona et al. (1994) D’Antona, F. & Mazzitelli, I. 1994, ApJS, 41, 467
- D’Antona et al. (1998) D’Antona, F. & Mazzitelli, I. 1998, in Mem. Soc. Astron. Italiana, ed. G. Micela and R. Pallavicini, 68, 807
- de Geus et al. (1993) de Geus, E. J., Vogel, S. N., Digel, S. W., & Gruendl, R. A. 1993, ApJ, 413, L97
- Digel et al. (1994) Digel, S., de Geus E. J., & Thaddeus, P. 1994, ApJ, 422, 92.
- Kobayashi et al. (2000) Kobayashi, N. et al. 2000, Proc. SPIE, 4008, 1056
- Kobayashi et al. (2005) Kobayashi, N., Yasui, C., Tokunaga, A. T., & Saito, M. 2005, prpl. conf. 8639
- Kobayashi & Tokunaga (2000) Kobayashi, N., & Tokunaga, A. T. 2000, ApJ, 532, 432.
- Kroupa (2002) Kroupa, P. 2002, Science 295, 82
- Lada (1999) Lada, E. A. 1999. Lada, C.J. & Kylafis, N.D. eds. 1999, The Origin of Stars and Planetary Systems pp. 441-78
- Lada & Lada (2003) Lada, C. J., & Lada, E. A. 2003, ARA&A, 41, 57
- Lubowich et al. (2004) Lubowich, D. A., Brammer, G., Roberts, H., Millar, T. J., Henkel, C., & Pasachoff, J. M. 2004 oee sympE, 37L
- Meyer et al. (1997) Meyer, M. R., Calvet, N., & Hillenbrand, L. A. 1997, AJ, 114, 288
- Miller & Scalo (1979) Miller, G.E & Scalo, J.M. 1979, ApJS 41, 513
- Muench et al. (2000) Muench, A. A., Lada, E. A., & Lada, C. J. 2000, ApJ, 533, 358
- Muench et al. (2002) Muench, A. A., Lada, E. A., Lada, C. J., & Alves, J. 2002, ApJ, 573, 366
- Muzzio & Rydgren (1974) Muzzio, J. C., & Rydgren, A. E. 1974, AJ, 79, 864
- Rieke & Lebofsky (1985) Rieke, G. H., & Lebofsky, M. J. 1985, ApJ, 288, 618
- Rolleston et al. (2000) Rolleston, W. R. J., Smartt, S. J., Dufton, P. L., & Ryans, R. S. I. 2000, A&A, 363, 537
- Santos et al. (2000) Santos, C. A., Yun, J. L., Clemens, D. P., & Agostinho, R. J. 2000, ApJ, 540, 87
- Scalo (1998) Scalo, J. 1998, ASPC, 142, 201
- Smartt & Rolleston (1997) Smartt, S. J., & Rolleston, W. R. J. 1997, ApJ, 481, L47
- Smartt et al. (1996) Smartt, S. J., Dufton, P. L., & Rolleston, W. R. J. 1996, A&A, 305, 164
- Snell et al. (2002) Snell, R. L., Carpenter, J. M., & Heyer, M. H. 2002, ApJ, 578, 229
- Stil & Irwin (2001) Stil, J. M., & Irwin, J. A. 2001, ApJ, 563, 816.
- Terada et al. (2004) Terada, H., Kobayashi, N., Tokunaga, A. T., Pyo, T.-S., Nedachi, K, Weber, M, Potter, R., Onaka, P. M. 2004, Proc. SPIE, 5492, 1542
- Tokunaga et al. (2002) Tokunaga, A. T., Simons, D. A., & Vacca, W. D. 2002, PASP, 114, 180
- Tokunaga et al. (1998) Tokunaga, A. T., et al. 1998, Proc. SPIE, 3354, 512
- Westerhout & Wendlandt (1982) Westerhout, G., & Wendlandt, H.-U. 1982, A&AS, 49, 143
| K | completeness | ||
|---|---|---|---|
| (1) | (2) | (3) | (4) |
| 16.0 | 0.998 | 4 | 4.01 |
| 17.0 | 0.990 | 9 | 9.09 |
| 18.0 | 0.967 | 15 | 15.51 |
| 19.0 | 0.959 | 20 | 20.86 |
| 20.0 | 0.813 | 4 | 4.92 |