High-resolution X-ray spectroscopy of the Narrow line Seyfert 1 galaxy NGC 4051 with Chandra LETGS
Abstract
Context. With the new generation of high-resolution X-ray spectrometers the understanding of warm absorbers in Active Galactic Nuclei has improved considerably. However, the main question remains the distance and structure of the photoionised wind.
Aims. We study the absorption and emission properties of the photoionised gas near one of the brightest and most variable AGN, the Seyfert galaxy NGC 4051, in order to constrain the geometry, dynamics and ionisation structure of the outflow.
Methods. We analyse two observations taken with the Low Energy Transmission Grating Spectrometer (LETGS) of Chandra. We study the spectra of both observations and investigate the spectral response to a sudden, long-lasting flux decrease of a factor of 5 that occurred during the second observation.
Results. We confirm the preliminary detection of a highly ionised component with an outflow velocity of km s-1, one of the highest velocity outflow components seen in a Seyfert 1 galaxy. The sudden drop in intensity by a factor of five during the second observation causes a drop in ionisation parameter of a similar magnitude in the strongest and main ionisation component ( km s-1), allowing us for the first time to determine the recombination time of this component and thereby its distance in a robust way. We find an upper limit to the distance of m, ruling out an origin in the narrow emission line region. In addition, an emission component producing strong radiative recombination continua of C vi and C v appears during the low state. This can be explained by emission from an ionised skin of the accretion disk at a distance of only m from the black hole. Finally, the spectra contain a broad relativistic O viii line with properties similar to what was found before in this source with XMM-Newton; this line has disappeared during the low flux state, consistent with the disappearance of the inner part of the accretion disk during that low flux state.
Conclusions. Combining high-resolution spectroscopy with timing information, we have constrained the geometry of the emission and absorption components in NGC 4051.
Key Words.:
galaxies: Seyfert – quasars: individual: NGC 4051 – galaxies: active – X-rays: galaxies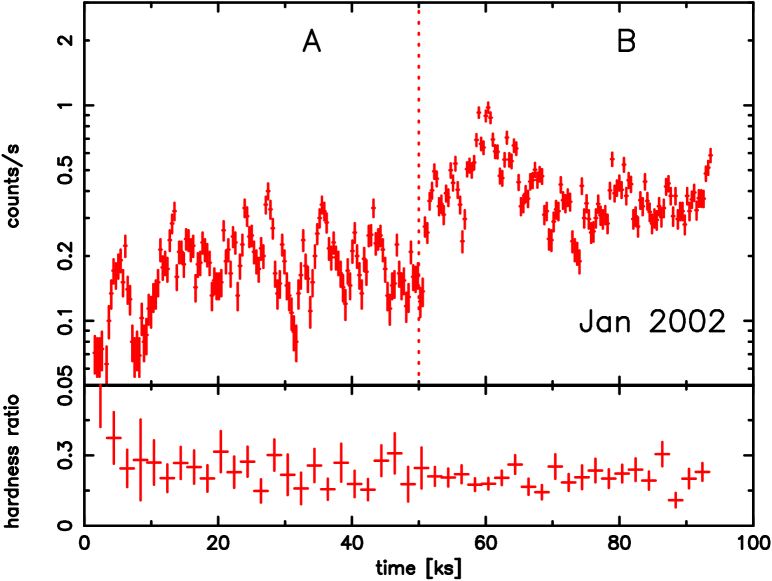
1 Introduction
The stupendous amount of energy emitted by an Active Galactic Nucleus is released by gas that flows towards a supermassive black hole in the centre of a galaxy, presumably via an accretion disk. The average energy of the emitted radiation increases towards the centre of the accretion disk, and thus X-rays provide the best probe of the gas flow in the immediate surroundings of the black hole. From the presence of jets, as well as from blue-shifted ultraviolet absorption lines, we learn that in addition to the flow towards the black hole, there is also gas flowing away from it. With the availability of X-ray spectrographs on Chandra and XMM-Newton, we can study these flows close to the black hole, by studying lines in the X-ray spectra. The presence of multiple absorption line systems, that differ in their level of ionisation or in their outflow velocity, constrains the geometry of the outflow (for example NGC 3783, Netzer et al. (2003); NGC 5548, Steenbrugge et al. (2005)).
In this paper we describe the X-ray spectra of the Active Galactic Nucleus of NGC 4051, obtained with the Low-Energy Transmission Grating on board of the Chandra satellite. Emission from the nucleus of NGC 4051 was already found by Hubble (1926), and the galaxy is one of the 6 observed by Seyfert (1943), and discussed in his seminal paper as one of the first 12 known Seyfert galaxies. Being a member of the Ursa Major cluster (Tully et al. 1996) it has a distance of 18.6 Mpc (Tully & Pierce 2000) and a redshift of 700 km s-1 (Verheijen & Sancisi 2001). NGC 4051 is a relatively bright optical object, at . In X-rays, the source was not detected with UHURU or Ariel-V, but was studied extensively with EXOSAT and ROSAT; its X-ray variability was recently analysed on the basis of RXTE and XMM-Newton data (McHardy et al. 2004). Its X-ray continuum has been described with a power law with photon index 1.8-2.0 (Nandra & Pounds 1994). A soft excess with respect to this power law is not well described by a multi-temperature disk, and Ogle et al. (2004) concluded that it is due to broad emission from relativistic O vii emission lines and to radiative recombination.
Two absorption line systems, at and km s-1, were found in the X-ray spectrum with the High Energy Transmission Grating of Chandra (Collinge et al. 2001). Multiple absorption systems were also found in the ultraviolet with the Space Telescope Imaging Spectrograph and in the Far Ultraviolet with the Far Ultraviolet Spectroscopic Explorer; one of these may coincide with the X-ray absorption system, all the others have smaller absolute velocities (Collinge et al. 2001; Kaspi et al. 2004).
Interestingly, a preliminary analysis of our first LETGS spectrum van der Meer et al. (2003) did not show that high velocity component, but indicated the presence of an outflow component at even higher velocity, km s-1. For that reason we requested our second observation. This second observation, taken when NGC 4051 was in a much higher flux state, allowed us to investigate the ionised outflow both in terms of outflow velocity and ionisation structure. In this paper we report the analysis of both observations with the LETGS.
2 Observations and data reduction
In this paper we describe two observations of NGC 4051 with the Low Energy Transmission Grating Spectrometer (LETGS, Brinkman et al. (2000)) of Chandra. The detector used was the High-Resolution Camera (HRC-S). The observations were done from December 31, 2001 17:40:41 to January 1, 2002 19:51:46 and July 23, 2003 00:34:15 to July 24 03:24:43, and with 94.2 and 96.6 ks net exposure time, respectively. Below we refer to these observations as the Jan 2002 and Jul 2003 observation, respectively. The data reduction is described in detail by Kaastra et al. (2002). Basically, after event selection we produce background subtracted spectra and light curves. As the HRC-S detector has limited energy resolution, higher spectral orders cannot be separated in the data but are taken into account properly during spectral fitting.
3 Data analysis and results
For all spectral fitting we used SPEX code developed at SRON (Kaastra et al. 1996). Details of the spectral model and the time intervals for which spectral fits are made are given later in this paper. We find that each spectrum requires several components to be fitted adequately. To minimise the number of components, we add them one by one, until the added component does not improve the fit significantly. It will be noted that the continuum emission components and the absorption components describe the global spectrum, whereas the narrow and broadened line emission features are limited to specific wavelengths. We therefore determined errors on the continuum emission and absorption systems while keeping the emission line parameters fixed to the values of the best fit; and determined errors on the emission line features while keeping the continuum and absorption lines fixed to the values of the best fit. The fit parameters are listed in Table 1. All models were corrected for Galactic absorption with a column density of m-2 (Elvis et al. 1989) and also for the small cosmological redshift of 700 km s-1. Finally, Table 2 gives the increase in when omitting a given spectral component from the final model. All errors correspond to (84 % confidence).
| January 2002 | A part | B part | July 2003 | C part | D part | |
| Continuum | ||||||
| power–law | ||||||
| Flux (2–10 keV)1 | ||||||
| Photon index | ||||||
| modified black–body | ||||||
| Flux2 | ||||||
| kT (keV) | ||||||
| Absorption components | ||||||
| warm absorber 13 | ||||||
| NH | — | — | — | — | ||
| — | — | — | — | |||
| vturb | — | — | — | — | ||
| vout | — | — | — | — | ||
| warm absorber 23 | ||||||
| NH | ||||||
| vturb | ||||||
| vout | ||||||
| warm absorber 33 | ||||||
| NH | — | |||||
| — | ||||||
| vturb | — | |||||
| vout | — | |||||
| Broad emission lines | ||||||
| O viii Ly line4 | ||||||
| flux | ||||||
| FWHM | [21] | [21] | [21] | [2.5] | [3.2] | |
| q | — | |||||
| — | ||||||
| O vii triplet4 | ||||||
| flux | — | — | — | |||
| — | — | — | ||||
| FWHM | — | — | — | |||
| C vi Ly line4 | ||||||
| flux | — | — | — | |||
| — | — | — | ||||
| FWHM | — | — | — | |||
| Narrow emission features | ||||||
| O vii forbidden line4 | ||||||
| flux | ||||||
| RRC5 | ||||||
| T | — | — | ||||
| EM | — | — | ||||
| EM | — | — | ||||
| EM | — | — | ||||
| EM | — | — | ||||
| EM | — | — | ||||
| EM | — | — |
1 Absorption-corrected flux in W m-2
2 Absorption-corrected bolometric flux in W m-2
3 The column density NH is in units of m-2. The ionisation parameter is
in units of W m, the turbulent velocity vturb and the outflow
velocity vout are in km s-1
4 The flux is in ph m-2 s-1, the wavelength
and the FWHM are in Å. In the case of the relativistic profile, is in
degrees. FWHM values in [] were not fitted but computed from the best-fit
relativistic line profile.
5 the temperature is in eV and the emission measure is in units of
m-3
| omitted component | number of | Jan 2002 | A | B | July 2003 | C | D |
|---|---|---|---|---|---|---|---|
| parameters | |||||||
| warm absorber 1 | 4 | — | — | — | — | ||
| warm absorber 2 | 4 | ||||||
| warm absorber 3 | 4 | — | |||||
| O VIII Ly line | 4 or 3 | ||||||
| O VII triplet | 3 | — | — | — | |||
| C VI Ly line | 3 | — | — | — | |||
| O VII forbidden line | 2 | ||||||
| RRC | 7 | — | — | ||||
| of full model | |||||||
| d.o.f. | 1478 | 1478 | 1478 | 2563 | 2563 | 1591 |
3.1 Flux level variations
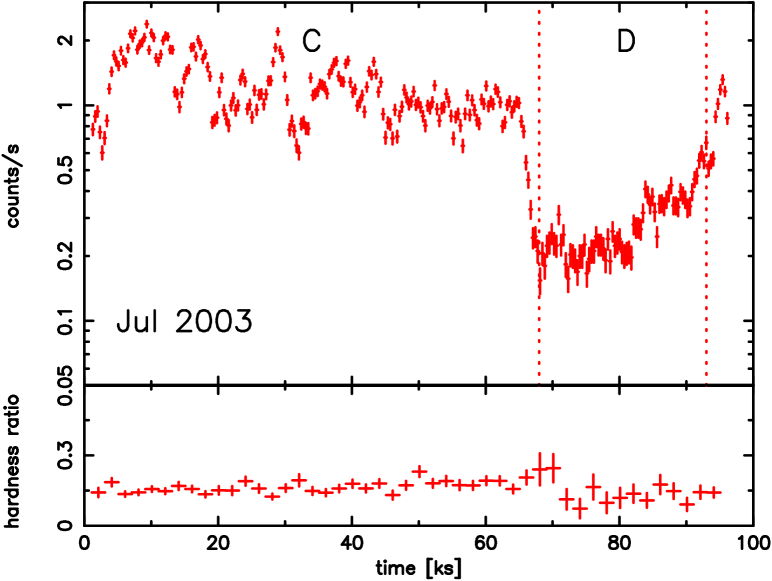
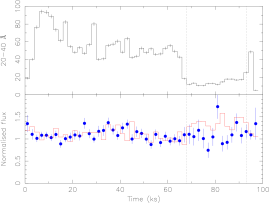
NGC 4051 was variable in both our observations, as shown in Fig. 1, where we plot the count rate obtained with the LETGS in zeroth spectral order. During the Jan 2002 observation the average brightness of the source increased about halfway the observation to a somewhat higher level; during the Jul 2003 observation the source was brighter yet during the first 65 000 s and then dropped in about 3000 s to the level of the second half of our first observation. It then recovered gradually to the high level again. On top of these long-term variations we also detect variability with smaller, but significant, amplitude on shorter time scales of a few thousand seconds. These rapid variations are smaller after the rapid flux decrease of the Jul 2003 observation. In the analysis below we will discuss the spectra at different flux levels, defined by the lightcurve of Fig. 1: A and B are the first and second half of the Jan 2002 observation, respectively, and C and D are the first and second interval of the Jul 2003 observation. Expressed in units of W m-2, the 0.5–2.0 keV fluxes of these spectra are 0.44, 1.11, 3.41 and 0.66 for A, B, C and D, respectively.
In Fig. 1 we also show the hardness ratio, defined as the ratio of the count rates in the 2-8 Å and 8-32 Å band passes. The hardness ratio of the Jan 2002 observation, is higher than that of the Jul 2003 observation, , where the number between brackets is the 1-sigma error in the last digit. The hardness variation between different flux levels is small, with for intervals A, B, C and D, respectively.
3.2 Continuum
In both observations the continuum cannot be fitted with only a simple power law. The soft excess can be modeled by adding a black body modified by coherent Compton scattering (Kaastra & Barr 1989). The parameters of the power law component of the Jan 2002 and Jul 2003 observations reflect the results found from the lightcurve and hardness ratio, which show that for the Jan 2002 observation the normalisation is three times smaller than for the Jul 2003 observation, while the slope is flatter, i.e. the spectrum is harder in Jan 2002 (see Table 1).
In contrast the normalisation of the modified black body is the same within the error in both observations. The black body temperature is higher in the Jul 2003 observation ( keV, vs. 0.102 keV in the Jan 2002 observation).
While looking at the different flux levels within each observation, we find that the modified black body component does not change between intervals A and B, whereas the powerlaw is harder at the lower flux of A than at the higher flux of B. In contrast, the change in flux level between C and D is reflected in the normalisations of the power law, and of the modified black body, whereas the slope of the power law is the same in C and D.
3.3 The ionised absorber
Thanks to the excellent spectral resolution of the LETG instrument the presence of a warm absorber in the spectrum is not controversial. We fitted the warm absorber with model XABS in SPEX. In this model, the ionic column densities are not independent quantities, but are linked via the ionisation parameter , where is the source luminosity, the hydrogen density and is the distance from the ionising source. In addition to , the fit parameters are the hydrogen column density of the absorber , the outflow velocity and the turbulent velocity of the medium . The advantage of the XABS model is that all relevant ions are taken into account including also the ones with the weakest absorption features.
3.3.1 The warm absorber in the January 2002 observation
During the January 2002 observation the source is in a low flux state and consequently the S/N ratio is lower. This has a negative effect on the detection of the fainter absorption lines which cannot be detected. Only a few strong absorption lines can be used for the determination of the warm absorber properties.
With XABS we find that two warm absorber components are needed. The component with the higher velocity (4450 km s-1) has a higher ionisation parameter and a higher column density than the component with the lower outflow velocity (620 km s-1; see Table 1). The absorption system with the higher outflow velocity improves the fit by for 4 additional degrees of freedom. This is the fastest outflow velocity yet found in a Seyfert 1 galaxy.
We fit the spectra A and B starting with the warm absorber components found in the total spectrum of Jan 2002. The separate spectra for A and B then are found to have within the error bars the same parameters for the warm absorber components as the total Jan 2002 spectrum. Due to the large uncertainty of the parameters for spectrum A, we are not very sensitive to detect changes; thus while the factor of 3 luminosity difference between A and B could in principle give rise to a similar change of the warm absorber properties, we cannot detect such a change.
3.3.2 The warm absorber in the July 2003 observation
To fit the Jul 2003 observation we need three absorption systems. Two of these are virtually identical to the components fitted in the Jan 2002 observation; the third component has a lower outflow velocity (420 km/s), and also a lower ionisation parameter and lower column density than the other two (see Table 1).
In spectrum D we detected only one absorption system, at an outflow velocity of about 790 km s-1. The absorption column is higher for spectrum D than the absorption column for the warm absorber component with the same velocity detected in interval C and in the total Jul 2003 observation; and the ionisation parameter is lower.
3.4 Broad emission lines
Besides absorption lines also strong emission features are present in every spectrum. We first describe the broad emission lines.
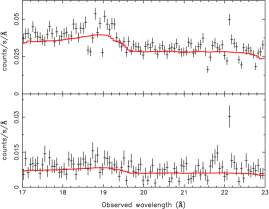
The presence of broad emission features is illustrated in Fig. 3 which shows excess flux above the power law and modified black body continuum for the Jul 2003 observation. Clear excess emission in a band with a width of at least an Å is present near 19 Å and 22 Å. This is the region of the 1s–2p transitions in O viii and O vii, respectively. In addition, there is excess emission near 34 Å, the region of the 1s–2p transition in C vi. The Jan 2002 observation also shows a significant excess but only near the O viii transition.
Close to the black hole the formation of an emission line is influenced by the strong gravity field and therefore the final emission line has a relativistic line profile. We modeled this relativistic profile as a narrow emission line convolved with the relativistic disk line profile of Laor (1991). The inner () and outer () disk radius were fixed in our models to the default values ( and ). The disk inclination and the disk emissivity slope (emissivity proportional to with the distance to the black hole) were allowed to vary. In the case when the emission line is created further away from the black hole this profile shows no or only a small deviation from the classical gaussian profile.
In order to model the broad emission lines and to search for possible time variability in particular parts of the observation we proceeded analogously as in the case of the absorption features. First we determined the best model for the emission lines for the full observations and after establishing that emission model we used it as the first approximation for the emission model in particular parts.
The parameters that we found for the broad lines are shown in Table 1.
3.5 Narrow emission features
In both full observations we detect a narrow O vii forbidden line. The O vii forbidden line at 22.10 Å is also visible in each individual spectrum and has the same strength in spectra A, B and C, but it is stronger in spectrum D. The line shows only a weak blueshift: the average outflow velocity is km s-1.
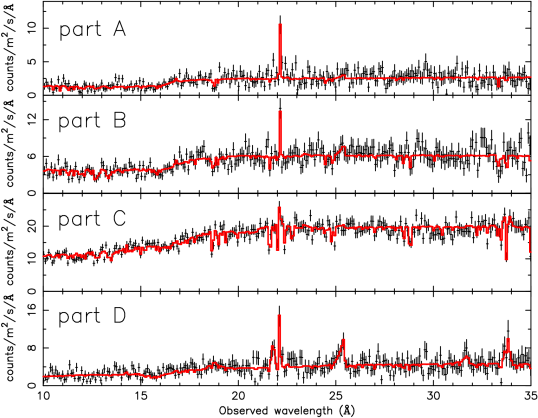
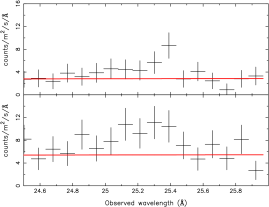
The main difference between spectrum D and the other spectra is the presence of strong Radiative Recombination Continua (RRCs) from C vi (25.30 Å) and C v (31.62 Å) in the spectrum, see Fig. 2 and Table 1. The temperature of the recombining photoionised gas is about eV. In addition the RRCs show a redshift with respect to the rest frame of the galaxy of km s-1. We do not find significant detections for RRCs of N vi (22.46 Å), N vii (18.59 Å), O vii (16.77 Å) and O viii (14.23 Å). In all other spectra we do not detect significant RRCs, so the numbers given in Table 1 should be interpreted as upper limits.
4 Discussion
4.1 The sudden decline of the source flux in 2003
In this section we focus upon the sudden decline of NGC 4051 in the July 2003 observation, at the boundary of part C and part D (Fig. 1). Within 3000 s, the flux dropped by a factor of and remained low for more than 20 000 s. Large flux variations are common in this object. In fact, around 29 ks after the start of the Jul 2003 observation, also a drop in intensity of a factor of occurred, but this was after a rise by a factor of 2.5 during the previous 2000 s, and as Fig. 1 shows, the recovery to higher flux level was much faster in that case.
The uniqueness of the transition between part C and D is the rather abrupt change preceded and followed by long periods of relative quiescence. This makes it possible for us to see the response of the continuum spectrum, the broad line emission and the warm absorber to this sudden flux drop.
The main change between C/D can be characterised as follows (see also Table 1):
-
1.
The modified black body component becomes somewhat hotter but with three times less bolometric flux. If we assume that this component represents the direct emission from the accretion disk, this can be explained if the inner part of the disk has disappeared and therefore does not radiate anymore. The only modest change in temperature then may imply that the range of disk temperatures in the disappeared part of the disk is not too different from that of the remaining part.
-
2.
The drop in power law flux is stronger, a factor of 6, while the photon index does not change. The disappearance of the inner part of the disk leads to less seed photons for the assumed inverse Compton scattering corona, not only because of the lower disk flux (3 time less disk flux) but also due to the relatively lower fraction of disk photons from the outer, remaining parts of the disk that are captured by a hot corona that is close to the black hole. The fact that the photon index hardly changes implies probably that apparently the optical depth and temperature of the corona remains the same
-
3.
The relativistic O viii line that can be seen in spectrum C is not visible in spectrum D. This also agrees with the scenario of sudden disappearance of the inner accretion disk.
We therefore suggest that the sudden decline between part C and part D is caused by the disappearance of the inner accretion disk. Such phase transitions are not uncommon in other galactic and extragalactic accretion disk systems. Whether the disappearing part of the disk is blown away through a strong wind, through jets or is being accreted onto the black hole is unclear.
The precise fraction of the disk that disappeared is a little hard to estimate and strongly model dependent; we only measure that about 2/3 of the bolometric modified black body flux disappears. Around a maximally rotating disk, 2/3 of the the emitted disk flux comes from within , but due to general relativistic effects (gravitational redshift, cone of avoidance causing most photons to be re-captured by the disk or black hole) this constitutes much less than 2/3 of the observed disk flux. On the other hand, for a non-rotating black hole, with a smaller cone of avoidance, 2/3 of the flux originates from within . Given this, we estimate as an order of magnitude that the disk within has disappeared. With a black hole mass of (McHardy et al. 2004), the light crossing time for the diameter of the disappeared region is 30 s. We observe that the fading takes a full 3000 s, hence the average disappearance speed is only 3000 km s-1.
4.2 The ionised absorber
4.2.1 The high ionisation component 2
In our highest quality spectrum, part C of the July 2003 observation, we detect three absorption systems (Table 1). Two of these are at a relatively low velocity (components 1 and 2) while component 3 has a high velocity.
The X-ray component 2, at an outflow velocity of -610 km s-1, has a column density of m-2. Apart from several L-shell lines from iron ions, its dominant imprint on the absorption spectrum are the Ly transitions of hydrogenic oxygen, nitrogen and carbon. Column density, outflow velocity as well as average 2–10 keV flux of spectrum C are very similar to the values found by Pounds et al. (2004) in their analysis of the RGS spectrum taken in May 2001. Therefore we identify our component 2 with their dominant component. However, in our case the ionisation parameter is a factor of 10 larger than the value obtained by Pounds et al. (2004). Various processes may contribute to this. First, while the 2–10 keV flux in both these observations are the same, our photon index is larger, leading to a much softer spectrum. For spectrum C the total ionising flux may be a factor of 4 higher, leading to a much higher ionisation parameter for gas at the same distance and density. A further difference is that during our observation the relative variability during observation C was relatively small (Fig. 1), while during the RGS observation the flux varied wildly (see for instance the light curve shown by McHardy et al. (2004)). Therefore, the ionisation parameter found by Pounds et al. (2004) might be an average between high and low states, if the warm absorber responds fast enough to the continuum variations. An indication for at least some spread of the ionisation parameter due to variability in the RGS data is that Pounds et al. (2004) also find a high ionisation component () at the same outflow velocity. In our more ”quiet” spectrum C, we do not find evidence for such a highly ionised component at the outflow velocity of km s-1.
Interestingly, when the continuum flux drops by a factor of five in s, defining the boundary between spectrum C and D, the ionisation parameter of component 2 drops by a similar factor (). Because of the fortunate circumstance that the flux variations during intervals C and D were relatively small, we therefore conclude that the warm absorber responds rapidly to the flux decrease.
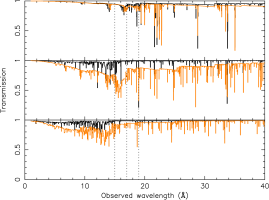
How fast does the absorber respond? To that aim, we have plotted the transmission of component 2 for parts C and D (Fig. 4, central panel). The most striking features is a broadband transmission decrease of 10–20 %. This by itself is not straightforward to measure in spectra with relatively poor statistics extracted for short time intervals, because a slight change in continuum parameters could mimic the transmission change. Also, the signal to noise ratio in individual lines is too low. However, Fig. 4 shows that there is a sharp decrease in the 15–17 Å band, caused by a deepening of the O vii edge and the development of the Fe-M Unresloved Transition Array (UTA) complex between 15–16 Å. Therefore we have made light curves in the 15–17 Å band (Fig. 5). A comparison with the 17–19 Å light curve shows that both bands follow each other quite well during the high state C, but in the low state D the 15–17 Å flux is on average 25 % lower than the flux above the O vii edge (17–19 Å band), in agreement with Fig. 4.
It is clear from Fig. 5 that the absorber responds definitely within 10 000 s to the continuum change; it may be much faster (down to the 1000 s scale or even faster), but the quality of our data does not allow us to prove that.
We have estimated recombination time scales for arbitrary ions from the general equation:
| (1) |
where is the density of ion , the electron density, the temperature-dependent recombination coefficient from ion to ion , and is the luminosity-dependent ionisation coefficient from ion to ion . For our order of magnitude estimate is is sufficient to neglect here any change in the shape of the ionising spectrum but to reckon only with the drop in luminosity . We start with the high-state equilibrium () and calculate the ion concentrations. We then decrease by a factor of 5 and evaluate (1) and determine the characteristic time scale defined by . In the high state (C), component 2 has an equilibrium temperature (for a stationnary state) of 20 eV. In the low state (D), component 2 has an equilibrium temperature of 5 eV. We therefore determine for temperatures between 5 and 20 eV. We find that O vii has a characteristic time scale of s for eV, and s for eV, where is the hydrogen density in units of m-3. For other ions, in particular Fe xiii – Fe xvii, the main contributors to the Fe-M complex between 15–16 Å in spectrum D, the time scales are 0.2 to 2.5 times the time scale for O vii.
We conclude that from our observed upper limit of the recombination time scale of s, it follows that the density m-3. Using the definition of the ionisation parameter (), we then obtain an upper limit m for the distance of the warm absorber of component 2 to the central source. From its measured column density of m-2, we find then an upper limit to the thickness of the absorber of m.
The distance upper limit of m implies that we can rule out an origin in the narrow emission line region for component 2. An origin at the inner edge of a dusty torus ( m, cf. Elvis et al. (2005)) cannot be fully ruled out but is unlikely given the fact that our recombination time is probably faster than s). Therefore, an origin in the outer parts of an accretion disk seems more appropriate. The relative thickness of the wind is extremely small; this suggests that we have a very narrow structure, or if the outflow covers a larger region, it must have a small volume filling factor.
We note that in a recent paper (Elvis et al. 2005) a recombination time of only 3000 s is proposed based on broad-band fits of time-resolved, low resolution EPIC spectra. That detection lacks sufficient proof because it is based upon a correlation study of derived ionisation parameter versus count rate; at low spectral resolution, however, it is not evident how to disentangle possible rapidly changing relativistic lines (Ogle et al. (2004) found such lines in the same XMM-Newton dataset) from a rapidly changing warm absorber. In our case, we use high-resolution spectra and have a much cleaner transition from a high to a low state.
4.2.2 Low ionisation component 1
At only a slightly smaller outflow velocity ( km s-1) compared to component 2, we find our second, lowly ionised component in spectrum C (Table 1, component 1). This component is most easily seen through the deep 1s–2p absorption lines of O vii, O vi and O v. The outflow velocity of both components 1 and 2 coincide with the broad troughs seen in the FUSE O vi line Kaspi et al. (2004) and in the range of UV absorption components seen in several lines observed by STIS Collinge et al. (2001). Component 1 has five times smaller column density than component 2, and is in good agreement with the low ionisation tail seen in the column density versus ionisation plot of Ogle et al. (2004).
We cannot see component 1 in the low state spectrum D, after the drop of a factor of 5 in intensity. The five times lower flux level combined with the shorter exposure time makes detection of any absorption component in spectrum D harder as compared to spectrum C. Further, even if the gas of this component responded similarly to the continuum decrease as component 2, it would be hard to find: Fig. 4 shows that the continuum opacity in both situations is low for component 1, and also there is no deep Fe-M UTA through that could be recognised after substantial binning of the data. We therefore cannot make any statement whether component 1 remained present, or that it got a lower ionisation.
4.2.3 High-velocity ionisation component 3
A high velocity component at an outflow velocity of km s-1 was first found by Collinge et al. (2001); we do not confirm that detection but instead find a much higher outflow velocity component at km s-1, as reported fist by van der Meer et al. (2003). This component appears to be present in both our spectra of 2002 and 2003, with almost the same column density and high ionisation parameter (). In general, this component has a low opacity. Its predicted response due to the flux decrease between part C/D in the July 2003 observation is shown in Fig. 4. If the warm absorber in this component would be of sufficient low density (we estimate m-2), it would respond rapidly to the flux decrease. That would result in a significant decrease of the transmission of about 20 % below the O viii edge around 14 Å. We do not see clear signatures of this in our spectra, but this may be hidden due to the lower opacity than component 2, and perhaps also a part of the enhanced opacity (if present) could be mimicked in our spectral fits by a slightly different slope for the power law component in spectrum D. In the absence of clearer evidence, the distance of component 3 remains unclear.
4.3 Broad emission lines
While in the observation of July 2003 we detect with significance three broad emission features (O viii Ly, the O vii triplet and C vi Ly) in the observation of January 2002 only one broad emission feature is present (the O viii Ly line). Adding a broad C vi Ly line or the O vii triplet does not improve the fit significantly.
There is a distinct difference between the line profile of the broad O viii Ly line in both observations. In the observation of January 2002, the line is extremely broad (FWHM 21 Å, with a sharp blue cut-off near 17 Å and an extended red tail. This line profile is caused by the steep emissivity law () combined with the small inner radius of the disk (corresponding to a rapidly rotating Kerr black hole). The emissivity slope , the inner disk radius and the disk inclination are in excellent agreement with the values given by Ogle et al. (2004). These authors observed NGC 4051 with the RGS instrument of XMM–Newton in May 2001, half a year before our observation. There is only a small difference in equivalent width: we find 4.7 Å while Ogle et al. find 2.6 Å. We conclude that in general the parameters of the relativistic line as found by us in the Jan 2002 spectrum are rather similar to the parameters found by Ogle et al.
However, Ogle et al. modeled the soft excess in NGC 4051 with the help of relativistic emission from the entire O viii emission lines series and RRCs. We tried to model the soft excess in the RGS (2-37Å) spectral band with the same model used by Ogle et al. (2004) (i.e., ignoring the modified black body component). This trial was not successfully neither for the January 2002 observation nor for the July 2003 observation (see Table 3). We conclude that in both LETGS observations the soft excess requires also the presence of the modified black body emission, rather than the higher Lyman transitions of O viii.
During the observation of July 2003 the profile seems to be produced under different conditions. We tested the possibility that also in this observation the O viii Ly profile is modified by relativistic effects. The inclusion of a relativistic broadened profile in the model is not statistically more significant than a simple gaussian profile. However, a gaussian model predicts a velocity broadening of the line of the order of km s-1 and this velocity broadening may hide some relativistic smearing. The best fit for a relativistic profile is achieved with an emissivity slope , with a FWHM of 2.5 Å. Thus the line profile is an order of magnitude narrower than in the observation of January 2002. A similar behaviour of the emissivity slope , as a function of the central source flux, was found also for another narrow line Seyfert 1 galaxy (MCG 6-30-15, Iwasawa et al. (1996)), but in that case for the Fe-K line. Considering the same scenario as for MCG 6-30-15, the red tail during January 2002 observation of NGC 4051 suggests that during that low state the line should be produced very close to the black hole where gravitational effects are significant. The blue horn is gravitationally shifted into the red wing and almost all of the line emission goes to the red wing. Conversely, during a high state most of the emission comes from a larger distance. Thus the blue peak comes mostly from the blue side of the disk and the red wing is depressed ((Iwasawa et al. 1996)).
The spectrum in July 2003 is dominated by the high state C. Surprisingly, after the sudden drop in intensity that occurs at the end of spectrum C, an extremely broad line as seen during the lower flux states A and B does not re-appear. Instead, there remains only a weak, relatively narrow broad emission line (FWHM 0.69 Å or 11 000 km s-1), which can be attributed to the outer accretion disk or the broad line region.
The fact that the O viii Ly line may be explained with a relativistic profile while the O vii triplet has a gaussian profile does not to need be contradictory. Most of the O viii Ly line can be formed by the gas which is closer to the black hole and the gas producing the O vii line may be placed further away. However an important caveat is that O vii triplet shape is more difficult to determine as it is a blend.
| Observation | model | dof | |
|---|---|---|---|
| January 2002 | relativistic lines modela | ||
| our best modelb | |||
| July 2003 | relativistic lines modela | ||
| our best modelb |
a the relativistic lines model consists of a power law
plus the entire series of O viii lines
broadened by the relativistic profile as in Ogle et al. (2004)
b our best model consists of a power law, modified black body and
a single relativistic O viii Ly line.
Relativistic line profiles in the soft X–ray band have been discovered first by Branduardi-Raymont et al. (2001) in some other narrow lines Seyfert 1 galaxies (MCG 6-30-15 and Mrk 766). In these sources, the disk line parameters derived from these lines and the Fe-K line are in good agreement. The XMM-Newton observation of NGC 4051 that showed a strong relativistic O viii line (Ogle et al. 2004) did not show a significant relativistic Fe-K line (Pounds et al. 2004). Unfortunately the LETGS is not sensitive enough in the the Fe-K band and thus we cannot directly compare the disk geometry as derived from iron and oxygen lines. For the physical implications of the relativistic lines in NGC 4051 we refer to Ogle et al. (2004).
4.4 Narrow features
During our observations we detect various narrow emission features in the spectra. The forbidden O vii line and RRCs of C v and C vi were the most dominant.
The O vii forbidden line is narrow and does not respond to the flux change (Table 1). This suggests that this line is produced by gas away from the central source, for example in the narrow line region.
There is no evidence for any variation of the centroid of the O vii forbidden line. Combining all observations, the centroid of Å as measured in the restframe of NGC 4051 corresponds to a net outflow velocity of km s-1.
The strongest RRCs are detected during a short time interval in the July 2003 observation (Fig. 2). The shape and centroid of individual RRCs is not only affected by the temperature of the recombining gas and the emission measure of the relevant ion, but also by the motion (velocity broadening) of the recombining gas. In a previous part of our paper (section 3.5) we determined the temperature and emission measure assuming zero velocity broadening. How can the velocity broadening affect the determination of the temperature and the emission measure? We have investigated this by including in our RRC spectral model a velocity broadening component. On the basis of the goodness of fit () we exclude that the recombining gas is moving faster than . The temperature and emission measure are within the error bars the same for models with a velocity broadening of and for models without velocity broadening.
If we interpret the velocity broadening as a typical Keplerian velocity at the location where the RRC is formed, we can derive some properties of the recombining gas. For a black hole mass of (McHardy et al. 2004) and the maximum velocity broadening of , we typically get a distance of the recombining gas of m or Schwarzschild radii.
From the fitted temperature of the RRC during part D ( eV) we derive an ionisation parameter . With the ionising luminosity of the source ( W), our distance derived above and the definition of we obtain a typical density of m-3. It is now also possible to estimate the volume of the RRC emitting source. Using the observed emission measure of the C vi RRC of m-3, a cosmic carbon abundance and a fraction of 50 % of the Carbon in the form of C vii (appropriate for ), we find an emitting volume of m3. Equating this to with the characteristic thickness of the emitter in the radial direction and the solid angle sustained by the emitter, we find
| (2) |
Another constraint follows from the column density through the emitting region. This can be written as or substituting more numbers m-2. Using that estimate, we can rule out an origin of the RRC emission in the warm absorber: the ionisation parameter would suggest an association with warm absorber component 2, but the column density of that component is at least 10 times smaller. Instead, the high (column) density may suggest an origin at the thin, ionised skin of the accretion disk at a few thousand Schwarzschild radii from the black hole.
We conclude with some consistency checks. First, the light crossing time through the emitting region is of order s, consistent with the duration of phase D. Note that we see the RRC during the full interval D (Fig. 6). Further, for we expect only a small fraction of gas recombining into O viii, but instead we expect a strong O vii RRC at 16.77 Å, but this feature is not clearly observed. However in this spectral region absorption from ions such as Fe ix may mask the presence of O vii RRC emission.
5 Conclusions
In this study we have investigated the spectral properties of NGC 4051, observed by Chandra-LETGS on two occasions for a total of 180 ks.
The time averaged spectrum of both the Jan 2002 and the Jul 2003 can be fitted by a modifyed black body and a power law, absorbed by ionised gas.
Two of the ionisation components (2 and 3) are well visibible both in Jan 2002 and in the high state (part C) of Jul 2003. These gas components are consistent with being stable over a long time scale ( months) both in ionisation level and outflow velocity.
In particular, we report the detection of the highest outflow velocity-gas ever observed ( km s-1), for component 3. The lower ionisation phase of the gas (component 1) is well detected only in the state C. This lack of detection is most probably due to the lower statistics affecting the other time segments.
In the last part of the Jul 2003 observation, (part D), only the second component is detected, but it shows a significant variation in the ionisation parameter which linearly responded to the continuum flux variation on a time scale 3000 s. From this we estimated a lower limit for the gas density ( m-3) and as a consequence a distance for the absorber m and a thickness of the gas layer m.
The emission spectrum is rich in narrow and broad emission lines:
The narrow lines (e.g. the O vii forbidden line) are not variable in time and therefore consistent with being produced in regions very distant from the black hole (e.g. the NLR).
The RRCs of C v and C vi showed instead a very rapid variability, significantly arising above the continuum after the flux drop in spectrum D. The estimated distance ( m) of the recombining gas shows that these RRCs are produced close to (or in) the accretion disc.
We also find that the column density of the gas producing the RRCs is incompatible with that found for the warm absorber, suggesting a different location for the absorbing and emitting media.
Broad lines of O viii, O vii and C vi are also evident in the spectrum. The O vii and C vi lines show a simple Gaussian profile with a FWHM ranging from 0.3 to 1.5 Å, suggesting an origin in the BLR.
On the contrary, the O viii Ly line is best modeled by a relativistically broadened profile. The tentatively detected variability on a months time scale is according to expectations for a line produced this close to a black hole. In accordance with previous studies, we find that the observed anticorrelation between the emissivity slope and the central source flux can be explained in terms of a relativistic accretion disc around a spinning black hole.
Acknowledgements.
SRON is supported financially by NWO, the Netherlands Organization for Scientific Research.References
- Branduardi-Raymont et al. (2001) Branduardi-Raymont, G., Sako, M., Kahn, S. M., et al., 2001, A&A, 365, L140
- Brinkman et al. (2000) Brinkman, A.C., Gunsing, A.C., Kaastra, J.S., et al., 2000, ApJ, 530, L111
- Collinge et al. (2001) Collinge, M. J., Brandt, W.N., Kaspi, S., et al. 2001, ApJ, 557, 2
- Elvis et al. (1989) Elvis, M., Wilkes, B.J., & Lockman, F.J., 1989, AJ, 97, 777
- Elvis et al. (2005) Elvis, M., Krongold, Y., Nicastro, F., Brickhouse, N., & Binette, L., 2005, in The X-ray Universe 2005, ESA SP-604, p. 539
- Hubble (1926) Hubble, E. P. 1926, ApJ, 64, 231
- Iwasawa et al. (1996) Iwasawa, K., Fabian, A.C., Reynolds, C.S., et al., 1996, MNRAS, 282, 1038
- Kaastra et al. (1996) Kaastra, J.S., Mewe, R., & Nieuwenhuijzen, H., 1996, in Frontiers Science Ser. 15, UV and X-ray Spectroscopy of Astrophysical and Laboratory Plasmas, Eds. K. Yamashita & T. Watanabe (Univ. Ac. Press, Tokyo), p. 411
- Kaastra et al. (2002) Kaastra, J.S., Steenbrugge, K.C., Raassen, A.J.J., et al., 2002, A&A, 386, 427
- Kaastra & Barr (1989) Kaastra, J.S., Barr, P. 1989, A&A, 226, 59
- Kaspi et al. (2004) Kaspi, S., Brandt, W.N., Collinge, M.J., Elvis, M., & Reynolds, C.S., 2004, AJ, 127, 2631
- Laor (1991) Laor, A. 1991, ApJ,376,90
- McHardy et al. (2004) McHardy, I.M., Papadakis, I.E., Uttley, P., Mason, K.O., & Page, M.J. 2004, MNRAS, 348, 783
- van der Meer et al. (2003) van der Meer, R.L.J., Kaastra, J.S., Steenbrugge, K.C., & Komossa, S., 2003, ASP Conf. Ser., 290, 133
- Nandra & Pounds (1994) Nandra, K, Pounds, K.A. 1994, MNRAS, 268, 405
- Netzer et al. (2003) Netzer, H., Kaspi, S., Behar, E., et al., 2003, ApJ, 599, 933
- Ogle et al. (2004) Ogle, P.M., Mason, K.O., Page, M.J., et al., 2004, ApJ, 606, 151
- Pounds et al. (2004) Pounds, K.A., Reeves, J.N., King, A.R., & Page, K.L., 2004, MNRAS, 350, 10
- Seyfert (1943) Seyfert, C. K. 1943, ApJ, 97, 28
- Steenbrugge et al. (2005) Steenbrugge, K.C., Kaastra, J.S., Crenshaw, D.M., et al., 2005, A&A, 434, 569
- Tully & Pierce (2000) Tully, R.B. & Pierce, M.J., 2000, ApJ, 533, 744
- Tully et al. (1996) Tully R.B., Verheijen M.A.W., Pierce M.J., Huang J.-S., & Wainscoat R.J., 1996, AJ, 112, 2471
- Verheijen & Sancisi (2001) Verheijen, M.A.W., & Sancisi, R., 2001, A&A, 370, 765