A new probe of dense gas at high redshift: detection of HCO+(5–4) line emission in APM 08279+5255 111Based on observations carried out with the IRAM Plateau de Bure Interferometer. IRAM is supported by INSU/CNRS (France), MPG (Germany) and IGN (Spain)
Abstract
We report the detection of HCO+ (5–4) emission from the Broad Absorption Line (BAL) quasar APM 08279+5255 at z=3.911 based on observations conducted at the IRAM Plateau de Bure interferometer. This represents the first detection of this molecular ion at such a high redshift. The inferred line luminosity, uncorrected for lensing, is =(3.50.6)1010K km s-1 pc2. The HCO+ J=5–4 source position coincides within the errors with that reported from previous HCN J=5–4 and high-J CO line observations of this quasar. The HCO+ line profile central velocity and width are consistent with those derived from HCN. This result suggests that HCO+ (5–4) emission comes roughly from the same circumnuclear region probed by HCN. However, the HCN (5–4)/HCO+ (5–4) intensity ratio measured in APM 08279+5255 is significantly larger than that predicted by simple radiative transfer models, which assume collisional excitation and equal molecular abundances. This could imply that the [HCN]/[HCO+] abundance ratio is particularly large in this source, or that the J=5 rotational levels are predominantly excited by IR fluorescent radiation.
1 Introduction
The quasar APM 08279+5255 at redshift =3.91 is one of the most luminous sources in the universe even after correcting for the high lensing factor (7) of its huge measured infrared luminosity (L1015L☉). Emission of high-J CO lines (J=9–8 and 4–3), mapped by Downes et al. (1999) with the IRAM Plateau de Bure Interferometer (PdBI), suggests the presence of a circumnuclear disk of hot and dense molecular gas. The VLA detected also the emission of the CO (1–0) and CO (2–1) lines in this source (Papadopoulos et al., 2001; Lewis et al., 2002). The question of how much dense molecular gas lies inside APM 08279+5255 was revisited by Wagg et al. (2005) who reported the detection of HCN (5–4) emission in this quasar using the IRAM PdBI. The exceptionally strong intensity of HCN (5–4) with respect to all CO lines measured in APM 08279+5255 leaves room for different interpretations however. First, if the excitation of all lines is mainly collisional, the high HCN/CO luminosity ratios could stem from a large enhancement of the abundance of HCN relative to CO or to a comparatively higher gas density for the gas emitting in HCN lines. Alternatively, this could reflect non-collisional excitation of high-J HCN lines through infrared pumping around the active galactic nucleus (AGN).
Opposing theoretical scenarios can explain why the HCN/CO abundance ratio may be anomalous in APM 08279+5255. HCN abundances could be enhanced relative to other molecular species under the influence of intense X-ray emission from the AGN (Lepp & Dalgarno, 1996; Maloney et al., 1996). On the other hand, selective oxygen depletion could decrease the abundance of oxygen-bearing molecular species (e.g., CO) around AGNs (Sternberg et al., 1994). The use of different tracers that aim at quantitatively probing the dense molecular gas in luminous and ultraluminous infrared galaxies (LIRGs:L1011L☉ and ULIRGs:L1012L☉) is mandatory to elucidate between the conflicting scenarios. To date, HCN has been widely used to trace dense gas in galactic cores, nearby galaxies and even ULIRGs. Of particular note, the luminosity of the HCN (1–0) line shows a remarkable correlation with LIR (e.g., Solomon et al., 1992; Gao & Solomon, 2004a, b; Wu et al., 2005). However, recent results of a combined HCN and HCO+ survey of a sample of LIRGs and ULIRGs which show a larger HCN/HCO+ intensity ratio towards ULIRGs with powerful AGNs, has been used to question the validity of HCN as a quantitative tracer of dense molecular gas in extreme ULIRGs (Graciá-Carpio et al., 2006). The results of this HCO+ survey of LIRGs and ULIRGs highlight the need of exploring the dense molecular gas fraction in extreme ULIRGs like APM 08279+5255 with complementary HCO+ line observations. A comparison of HCO+ and HCN line intensities in high-z ULIRGs may allow the effects of excitation to be disentangled from those of chemistry and help the derivation of the physical conditions in these extraordinary objects.
Here we present the detection of HCO+ (J=5–4) line emission in APM 08279+5255 at z=3.911 made with the IRAM PdBI. This represents the first detection of this molecular ion at such a high redshift. We discuss in the context outlined above the implications of this result for the interpretation of molecular line observations of gas-rich high-redshift galaxies.
2 Observations
We observed APM 08279+5255 with the IRAM 6-element array in B configuration on March 13, 2006. The spectral correlator was adjusted to and centered on redshifted HCO+ (5–4) (rest frequency at 445.903 GHz) to cover an effective bandwidth of 580 MHz (equivalent to 1800km s-1). The size of the synthesized beam was 1.461.20 (PA=94∘) at the observing frequency (90.797GHz). APM 08279+5255 was observed for a total integration time of 9.5 hrs on-source. During the observations the atmospheric phase stability on the most extended baselines was always better than 20∘, typical for excellent winter conditions. The absolute flux density scale was calibrated using 3C 84 and 0836+710, and should be accurate to better than 10%. We have used the GILDAS package for the data reduction and analysis. The average 1–noise in channels of 20 MHz-width is estimated to be 0.5 mJy beam-1. The phase tracking center of these observations is at (, )=(08, 52∘4517.7) coincident with that used by Wagg et al. (2005) in their HCN observations. To calculate luminosities, we assume a –cosmology described by Ho=70 km s-1, =0.7 and =0.3 (Spergel et al., 2003). Throughout the paper, the velocity scale is referred to the CO redshift z=3.911.
3 Results
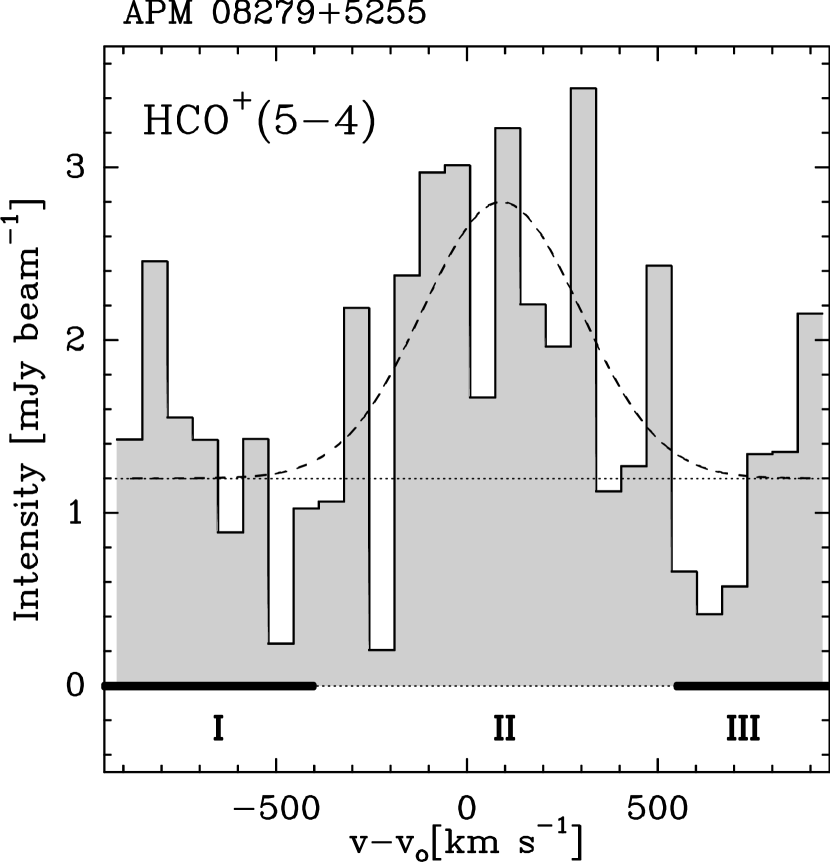
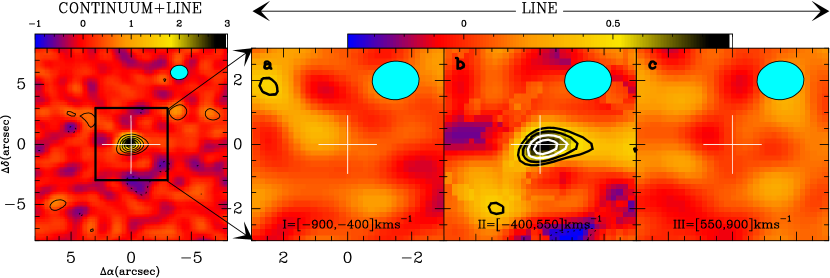
We have detected the HCO+ (5–4) line and the dust continuum emission (at 670) both emitted in the submillimeter range and redshifted to 3.3mm in APM 08279+5255. The overall results are summarized in Table 1. Figure 1 shows the spectrum of the HCO+ (5–4) line (continuum not subtracted) towards the peak of integrated intensity at (, )=(08, 52∘4517.4) (see Figure 2). Within the errors the peak position is in agreement with that determined from previous mm-continuum maps (Downes et al., 1999; Wagg et al., 2005). The velocity coverage encompasses the full extent of the HCO+ line emission. Data from the line-free sidebands with velocities below km s-1 and above km s-1 (intervals I and III, defined in Figure. 1), were combined with natural weighting to estimate the continuum emission at 90.8 GHz to be mJy, in good agreement with the value of 1.20.3 mJy at 93.9 GHz of Downes et al. (1999).
The channel maps of Figure 2 obtained for the three velocity intervals defined in Figure 1 (I, II and III) clearly show that HCO+ (5–4) line emission is only detected from km s-1 to km s-1 (interval II), with no significant line emission outside this velocity range (i.e., in intervals I or III). The integrated HCO+ (5–4) line intensity map shows a 7 detection in APM 08279+5255 of 0.870.13 Jy km s-1. This translates into a line luminosity = K km s-1 pc2, obtained from equation (3) of Solomon et al. (1997). The line emission peaks roughly at the same position as the continuum. Within the errors, HCO+, HCN and high-J CO lines peak at the same position. Furthermore, the line width (49080 km s-1) and central velocity (9050 km s-1) of the HCO+ (5–4) line closely agree with those of the HCN line. In particular, the central velocities of the HCN and HCO+ lines are both 80–90 km s-1 redshifted with respect to CO; this is an indication that HCN and HCO+ come from the same circumnuclear region in APM 08279+5255.
4 Dense Gas in APM 08279+5255: excitation and inferred chemical abundances
Taken at face value, the mere detection of CO (4–3), CO (9–8), and mostly of HCN (5–4) and HCO+ (5–4) line emission hints that there is a significant reservoir of hot and very dense molecular gas in APM 08279+5255. Partly implicit in this scenario, however, is the assumption that the excitation of the HCN and HCO+ lines is mainly collisional. The inferred chemical abundances depend on this critical assumption, as discussed below (Section 4.1). We study the influence that non-collisional excitation of the J=5–4 lines of HCN and HCO+ may have on the derived chemical abundances for these molecular species in Section 4.2.
4.1 Collisional excitation
Wagg et al. (2005) performed escape-probability radiative transfer calculations to re-examine the fit of Downes et al. (1999) to the CO 9–8/4–3 ratio measured in APM 08279+5255 including also higher-J CO transitions observed by Weiss et al. (2006, in preparation). Their conclusion is that a single component model with a gas temperature T80 K, a molecular hydrogen density n(H2)4104 cm-3 and a CO column density N(CO)/v=41017 cm-2 fits all the CO ratios. The extrapolation of the CO model to match the observed HCN (5–4) line intensity leads Wagg et al. to conclude that the [HCN]/[CO] abundance ratio in APM 08279+5255 (but not necessarily the [HCN]/[H2] ratio) is surprisingly large: (1–2)10-2. This is an order of magnitude larger than the typical abundance ratio measured on small scales in galactic hot cores.
The detection of HCO+ (5–4) line emission provides new constraints on the chemistry of APM 08279+5255. In particular, we can estimate the [HCN]/[HCO+] abundance ratio in this source inside the collisional excitation scheme with certain assumptions (the main one being the adoption for HCO+ and HCN of the same physical parameters derived from CO lines). The bottom line result issued from these calculations is that the HCN (5–4)/HCO+ (5–4) luminosity ratio measured in APM 08279+5255 (1.1) is 3 times larger than expected if the molecular abundances of the two species are assumed to be comparable. The critical densities of the HCO+ v=0 ground transitions are a factor of 10 lower than those of HCN. At equal abundances and in the regime of subthermal excitation, HCO+ v=0 J1 rotational levels are expected to be more populated than those of HCN. Therefore, if we aim at matching the line ratio reported above, we need HCN to be significantly overabundant with respect to HCO+, by a factor of [HCN]/[HCO+]10.
We can explore the robustness of this conclusion by reconsidering some of the underlying assumptions inherent in these calculations. First, we have implicitly assumed that both the filling factor and the magnification factor of the HCO+, HCN, and high-J CO lines are similar. The similar line profiles and source parameters (size and position) derived from HCO+ and HCN are compatible with this picture. It is conceivable, however, that the emission of HCO+ and HCN may come from gas with higher densities than derived from the single-component CO model. In particular we have explored a range of solutions matching the CO (9–8)/CO (4–3) ratio of APM 08279+5255 with higher densities and similar or slightly lower temperatures for the gas. An optimum fit can be found for n(H2)4105 cm-3 and T50-60 K. If this solution is applied to HCN and HCO+, in order to match the HCN (5–4)/HCO+ (5–4) luminosity ratio of APM 08279+5255, we need [HCN]/[HCO+]10. In summary, the overabundance of HCN with respect to HCO+ is also required in the higher density scenario.
4.2 Non-collisional excitation: infrared pumping?
The excitation of HCN and HCO+ lines in a source with an infrared luminosity as high as that of APM 08279+5255 may not be only collisional, but also radiative. Like CO, the HCO+ and HCN millimeter line emissions are believed to arise in a thick circumnuclear disk of radius 100-200 pc where a sizable fraction of the dust is heated to K by the AGN (Lewis et al., 1998; Beelen et al., 2006). The mid-IR emission from this disk ( Jy at 12 m) is by far the brightest known in any known quasar to date. The mid-IR radiation can excite the first bending modes of both HCN (m) and HCO+ (m) and, by fluorescence, can populate the levels of the ground state. We note that, prior to any IR pumping or collisional excitation, the cosmic background temperature at the redshift of APM 08279+5255 (13.4 K) is high enough to populate the J=3 ground state level: the fractional population of this level would be as large as 0.17 for a rotational temperature 13.4 K. The radiative selection rules are such that IR radiation will pump up molecules from this level to the level, which will decay to the level. The frequencies and Einstein coefficients of the ro-vibrational transitions of HCN and HCO+ are similar ( 1s-1), so that both molecules behave similarly as concerns radiative excitation. Whether the J= 5 HCN and HCO+ levels are sufficiently populated at fluorescence equilibrium to explain the observed lines depends then on the source geometry and on the molecular abundances. Downes et al. (1999) argue that the mid-IR source must be smaller than the molecular source, because dust opacity prevents the AGN radiation to penetrate far inside the molecular torus. However, Nenkova et al. (2002) argue that the disks are likely to be clumpy and that the clumps throughout the disk are efficiently heated by the AGN. Such heating would explain the observed 200 K dust component. In addition, direct heating can occur within the torus, if the latter hosts a strong starburst.
Assuming that the hot dust and the molecules are well mixed inside the disk and that the dust is optically thick at 10m, fluorescent excitation could be quite effective. For a mid-IR source temperature of =200 K, the fraction of the sky subtended by this source at the molecules needs only to be
for radiative pumping to be effective (Carroll & Goldsmith, 1981). It is interesting to note in this respect that the number of 12m (and 14m) photons escaping from the disk exceeds by a factor of 5 the number of HCO+ (HCN) photons observed in the J= 5-4 (670 m) line. The opacity of the J 3, ro-vibrational lines needs only to be to explain the observed HCO+ and HCN J= 5-4 line emissions, which for equal molecular abundances will have similar intensities. Such an opacity will be reached for column densities of HCO+ and HCN of N(X)/1013 cm-2, or times the CO column density derived by Wagg et al. (2005). In summary, inside the infrared pumping scheme, we do not need the abundance of HCN to be anomalously high with respect to CO and HCO+.
5 Discussion and Conclusions
The two scenarios invoked above, both accounting for the unexpectedly large HCN(5–4)/HCO+(5–4) ratio measured in APM 08279+5255, have completely different but equally relevant implications for the interpretation of high-J molecular line observations of dense gas in other high-redshift galaxies.
Inside the collisional excitation model it is implied that the abundance of HCN in APM 08279+5255 is anomalously high with respect to CO and HCO+. Different mechanisms can increase the abundance of HCN with respect to CO and HCO+ (e.g., see discussion of Graciá-Carpio et al., 2006). This includes high-ionization chemistry driven by X-rays around an AGN, chemical enhancement of HCN in star-forming regions and, if molecules coexist with the hot dust, enhanced destruction of HCO+ by reaction with water wapor evaporated from the dust. The ingredients (an AGN, a massive star forming episode and hot dust) are all present in APM 08279+5255, even though X-ray ionization seems unlikely to raise [HCN]/[HCO+] well above 1 (Lepp & Dalgarno, 1996). We can also tentatively discard selective depletion of oxygen bearing species as an explanation for the inferred [HCN]/[HCO+] abundance ratio in APM 08279+5255. Usero et al. (2004) analyzed the case of the Seyfert 2 galaxy NGC 1068 and found that the solution provided by oxygen depletion models matching an abundance ratio of [HCN]/[CO]10-3 (i.e., 10 times lower than that of APM 08279+5255) leads to an excessively large [HCN]/[HCO+] abundance ratio (20).
Of particular note, the advantage of the radiative excitation scheme over the collisional excitation model is double. First, radiative excitation does not require very high gas densities to explain the HCN/HCO+ line ratios observed in APM 08279+5255, even through the CO line ratios seem to imply medium-high densities. Furthermore, infrared pumping can also account for the near equality of the HCN and HCO+ J=5-4 line intensities while keeping an abundance ratio [HCN]/[HCO+] within the range 0.5-2, typical of that observed in dense molecular clouds in the Galaxy and in nearby galaxies (e.g., see Table 8 of Wang et al., 2004).
The availability of only one observed transition of HCN and HCO+ prevents us from making a more educated choice of the right scenario for APM 08279+5255. Future observations that include lower and higher-J transitions of both HCO+ and HCN will be required to confront a set of observed line ratios with the predictions issued from chemical and excitation models.
References
- Beelen et al. (2006) Beelen, A., Cox, P., Benford, D. J., Dowell, C. D., Kovacs, A., Bertoldi, F., Omont, A., & Carilli, C. L. 2006, ArXiv Astrophysics e-prints, arXiv:astro-ph/0603121
- Carroll & Goldsmith (1981) Carroll, T. J., & Goldsmith, P. F. 1981, ApJ, 245, 891
- Downes et al. (1999) Downes, D., Neri, R., Wiklind, T., Wilner, D. J., & Shaver, P. A. 1999, ApJ, 513, L1
- Gao & Solomon (2004a) Gao, Y., & Solomon, P. M. 2004a, ApJS, 152, 63
- Gao & Solomon (2004b) Gao, Y., & Solomon, P. M. 2004b, ApJ, 606, 271
- Graciá-Carpio et al. (2006) Graciá-Carpio, J., García-Burillo, S., Planesas, P., & Colina, L. 2006, ApJ, 640, L135
- Lepp & Dalgarno (1996) Lepp, S., & Dalgarno, A. 1996, A&A, 306, L21
- Lewis et al. (1998) Lewis, G. F., Chapman, S. C., Ibata, R. A., Irwin, M. J., & Totten, E. J. 1998, ApJ, 505, L1
- Lewis et al. (2002) Lewis, G. F., Carilli, C., Papadopoulos, P., & Ivison, R. J. 2002, MNRAS, 330, L15
- Maloney et al. (1996) Maloney, P. R., Hollenbach, D. J., & Tielens, A. G. G. M. 1996, ApJ, 466, 561
- Nenkova et al. (2002) Nenkova, M., Ivezić, Ž., & Elitzur, M. 2002, ApJ, 570, L9
- Papadopoulos et al. (2001) Papadopoulos, P., Ivison, R., Carilli, C., & Lewis, G. 2001, Nature, 409, 58
- Solomon et al. (1992) Solomon, P. M., Downes, D., & Radford, S. J. E. 1992, ApJ, 387, L55
- Solomon et al. (1997) Solomon, P. M., Downes, D., Radford, S. J. E., & Barrett, J. W. 1997, ApJ, 478, 144
- Spergel et al. (2003) Spergel, D. N., et al. 2003, ApJS, 148, 175
- Sternberg et al. (1994) Sternberg, A., Genzel, R., & Tacconi, L. 1994, ApJ, 436, L131
- Usero et al. (2004) Usero, A., García-Burillo, S., Fuente, A., Martín-Pintado, J., & Rodríguez-Fernández, N. J. 2004, A&A, 419, 897
- Wagg et al. (2005) Wagg, J., Wilner, D. J., Neri, R., Downes, D., & Wiklind, T. 2005, ApJ, 634, L13
- Wang et al. (2004) Wang, M., Henkel, C., Chin, Y.-N., Whiteoak, J. B., Hunt Cunningham, M., Mauersberger, R., & Muders, D. 2004, A&A, 422, 883
- Wu et al. (2005) Wu, J., Evans, N. J., Gao, Y., Solomon, P. M., Shirley, Y. L., & Vanden Bout, P. A. 2005, ApJ, 635, L173
| Parameter | Value |
|---|---|
| 08 | |
| 52 | |
| aaVelocity referred to z=3.911 (derived from CO lines) | km s-1 |
| 0.870.13 Jy km s-1 | |
| bbUncorrected for lensing | K km s-1 pc2 |
| 90.8GHz continuum | 1.20.13 mJy |