Hard X-ray Bursts Detected by the IBIS Telescope Onboard the INTEGRAL Observatory in 2003-2004
to be published in Astronomy Letters, Vol. 32, No. 7, pp. 456–477 (2006)
1 Space Research Institute, Russian Academy of
Sciences, Profsoyuznaya 84/32, 117997 Moscow, Russia
2 Max-Planck-Institut für Astrophysik, Karl-Schwarzschild-Str. 1, Postfach 1317, D-85741 Garching, Germany
Submitted on 16.12.2005
Abstract. All of the observations performed with the IBIS telescope onboard the INTEGRAL observatory during the first one and a half years of its in-orbit operation (from February 10, 2003, through July 2, 2004) have been analyzed to find X-ray bursts. IBIS/ISGRI detector lightcurves total count rate in the energy range 15-25 keV revealed 1077 bursts of durations from to s detected with a high statistical significance (only one event over the entire period of observations could be detected by a chance with a probability of 20%). Apart from the events associated with cosmic gamma-ray bursts (detected in the field of view or passed through the IBIS shield), solar flares, and activity of the soft gamma repeater SGR1806-20, we were able to localize 105 bursts and, with one exception, to identify them with previously known persistent or transient X-ray sources (96 were identified with known X-ray bursters). In one case, the burst source was a new burster in a low state. We named it IGR J17364-2711. Basic parameters of the localized bursts and their identifications are presented in the catalog of bursts. Curiously enough, 61 bursts were detected from one X-ray burster – GX 354-0. The statistical distributions of bursts in duration, maximum flux, and recurrence time have been analyzed for this source. Some of the bursts observed with the IBIS/ISGRI telescope were also detected by the JEM-X telescope onboard the INTEGRAL observatory in the standard X-ray energy range 3-20 keV.
PACS numbers: 95.85.Nv, 95.85.Pw, 97.60.Jd, 97.80.Jp, 98.70.Qy, 98.70.Rz
DOI: 10.1134/S1063773706070048
Key words: neutron stars, X-ray bursts, bursters.
∗ e-mails chelovekov@hea.iki.rssi.ru, sergei@hea.iki.rssi.ru
INTRODUCTION
The X-ray bursts detected by telescopes and detectors onboard orbital astrophysical observatories are mainly associated with thermonuclear explosions on the surfaces of weakly magnetized accreting neutron stars in low-mass X-ray binaries (type-I bursts). Favorable conditions for the accumulation due to accretion of a fairly thick layer of matter on the stellar surface and the attainment of the pressure and temperature required for thermonuclear ignition and explosive burning at its base are created only in such objects. The luminosities of such sources (bursters) at the burst time can increase by two or three orders of magnitude relative to their quiescent state, reaching a critical Eddington level erg s-1, where and are the mass and radius of the neutron star, is its gravitational radius, and is the hydrogen abundance.
Solar flares and cosmic gamma-ray bursts (GRBs), events from sources of recurrent bursts (magnetars), and individual events related to unsteady accretion in binary systems (type-II bursts from low-mass X-ray binaries and bursts from high-mass X-ray binaries with accretion from an inhomogeneous stellar wind of the companion star) are also observed in the Xray energy range. Compared to all these events, type-I X-ray bursts and their sources are of special, independent interest to researchers, because their observational properties are very peculiar and because they carry direct information about the processes near the surfaces of neutron stars under conditions of superstrong gravitational field and pressure, ultrahigh temperatures, and relativistic velocities. The detection of type-I bursts, along with the detection of coherent pulsations, serves as one of the most important and most reliable criteria for identifying the nature of the compact object (a neutron star) in X-ray binaries.
The fact that bursts are commonly observed from weak X-ray sources (or transients during their low state) opens up a possibility for using them in searching for hitherto unknown bursters with persistent X-ray fluxes below the level of reliable detection by currently available wide-field X-ray instruments. Such sources can be detected only during bursts, when their X-ray luminosities increase by tens or hundreds of times for a short time1. The INTEGRAL observatory is equipped with unique wide-field telescopes that allow sky fields with an area of more than 1000 square degrees to be simultaneously studied with a flux sensitivity higher than 1 mCrab (over several hours of observations) and an angular resolution reaching several arcminutes. In addition, it devotes up to 85% of the physical time to continuous observations of the region of the Galactic center and the Galactic plane, where the bulk of the Galactic stellar mass is concentrated. Therefore, INTEGRAL is best suited for conducting such a search.
In this paper, to find X-ray bursts, we analyze the time histories of the total count rate from the ISGRI detector of the IBIS telescope onboard the INTEGRAL orbital observatory in the energy range 15-25 keV based on observations during the first one and a half years of its in-orbit operation (from February 10, 2003, through July 2, 2004). For all of the detected bursts, we attempted to localize (using the IBIS sky mapping capabilities) and identify them with persistent X-ray sources within the field of view. We compiled a catalog of identified bursts and constructed their time histories in a softer X-ray energy range using data from the JEM-X monitor onboard the INTEGRAL observatory if this was permitted by the observational conditions. The maximum objective of this study was an attempt to detect hitherto unknown bursters or short-lived X-ray transients.
INSTRUMENTS, OBSERVATIONS, AND DATA ANALYSIS
The INTEGRAL international orbital gamma-ray observatory (Winkler et al. 2003) was placed in orbit by a Russian PROTON launcher on October 17, 2002 (Eismont et al. 2003). There are four instruments onboard the observatory: the SPI gammaray spectrometer, the IBIS gamma-ray telescope, the JEM-X X-ray monitor, and the OMC optical monitor. Here, we use data from the upper detector layer (ISGRI) of the IBIS telescope (Lebrun et al. 2003; Ubertini et al. 2003) and the JEM-X monitor (Lund et al. 2003).
The ISGRI detector layer of the IBIS telescope is an array of semiconductor CdTe elements that are sensitive to photons in the energy range 15-200 keV and that provide an energy resolution of111 The sources themselves can also be detected accidentally, during deep observations or surveys carried out by very sensitive mirrorX-ray telescopes.However, their nature s much more difficult to identify in this case. 7% at 100 keV. The IBIS telescope incorporates a coded mask that allows this device to be used not only for spectral and timing analyses of the emission, but also for reconstructing the image of the sky region in the field of view of the telescope (FWZR, the fully coded area is ) with an angular resolution of 12 arcmin (FWHM) and localizing X-ray and gamma-ray sources to within 1-2 arcmin. The JEM-X monitor is also a telescope with a coded aperture, but it is adapted to the standard X-ray energy range 3-35 keV. A gas chamber that provides an energy resolution of 16% at 6 keV is used as the position sensitive detector. The 13.2∘ field of view (FWZR, the fully coded area is 4.8∘ in diameter) is limited by a collimator. The angular resolution of 3.35 arcmin allows bright sources to be localized more accurately than those with the IBIS telescope.
Our analysis of the data from both telescopes was based on the INTEGRAL standard data processing software package (OSA), version 4.2. We searched for bursts using the time profiles of the count rates for all of the events recorded by the ISGRI detector in the energy range 15-25 keV, irrespective of the photon arrival direction. Based on the list of events compiled at the GTI phase of the OSA 4.2 standard ISGRI data processing procedure, we reproduced the time histories of the count rates for each individual INTEGRAL observation (corresponding to an individual pointing) with a time resolution of 1, 5, and 10 s. A total of 13777 individual INTEGRAL observations from February 10, 2003, through July 2, 2004, were analyzed. All these data are now publicly available in the INTEGRAL archive. The duration of individual observations reached 4–5 ks; the total exposure time of all the observations used was 33.7 Ms. Figure 1 shows an exposure map for the IBIS observations used here.
The derived lightcurves were analyzed for the presence of bursts. An excess of the signal-to-noise ratio above a preset threshold in a particular time bin served as a criterion for a burst. The attention was focused on the count rate with a time step of 5 s that is most sensitive (i.e., provides the maximum ratio in an individual bin) to ordinary X-ray bursts from bursters. Since the number of events recorded by the detector in each time bin obeys a Poisson distribution, there is a low, but finite probability of recording a random spike even in the absence of a real burst. To filter out such random spikes, we set a fairly high threshold, . It ensures that the probability of recording one random burst with in the entire time series being checked (with time bins at a bin length of 5 s) does not exceed %. Since the total count rate of the detector depended on the emission from all sources within the IBIS field of view, the mean count rate and the noise level in our formulas were determined independently from each individual pointing. The results of the described analysis were also checked by a visual examination of the count rate time histories. The same analysis was performed for the time histories with a resolution of 10 s.

For all of the detected bursts, we reconstructed the images of the sky area in the IBIS/ISGRI field of view (the IMA phase of the OSA 4.2 procedure) accumulated with the same exposure at the burst time and immediately before the burst (see Fig. 2). We compared the statistical significance of detecting sources in these images to reveal and identify the burst source.
The entire set of procedures has much in common with the IBAS system of the INTEGRAL observatory: an automatic search for GRBs within the IBIS/ISGRI field of view and a wide spread of notifications of them (Mereghetti et al. 2003). The differences lie in the fact that the IBAS system (1) uses a harder and wider energy ranges, (2) GRB-unrelated events were ignored in the period 2003-2004, and (3) the algorithms and programs were developed for realtime automatic work with telemetry data.
RESULTS
Our analysis of the IBIS/ISGRI detector lightcurves revealed 1077 bursts; the sources of 115 of them were also detected in the images of the sky region in the IBIS field of view. Six such events were caused by cosmic GRBs that occurred within the IBIS field of view. We were able to associate other events, with one exception, with known persistent X-ray sources. To clarify the nature of 962 nonlocalized bursts, we performed their cross correlation with the lists of GRBs and solar flares recorded by the anticoincidence shield (ACS) of the SPI gamma-ray spectrometer onboard the INTEGRAL observatory and by the GOES satellites. The results of this analysis are presented in Table 1.
| Instrument | ISGRI | ISGRI | ISGRI+ | ISGRI+ | ISGRI+ |
|---|---|---|---|---|---|
| GOES | ACS | GOES+ACS | |||
| Bursts | 1077 | 115 | 145 | 86 | 17 |
Localized and identified ISGRI bursts.
Nonlocalized ISGRI bursts.
Table 2 lists the X-ray bursts detected by the IBIS/ISGRI detector and identified with X-ray bursters. Its columns give the burst source name, the maximum flux time, the burst duration , the maximum flux determined from a time bin of 1, 2, 3, or 5 s, and the statistical significance of detecting the burst source: (a) in the image obtained during the time bin or s near the burst maximum and (b) from the time history of the ISGRI total count rate (from the ratio in the same bin ). The values of and used are given in columns 6 and 10 of the table, respectively. In no case was the corresponding persistent source detected in the image over the period that preceded the burst onset by 1.5-2 burst durations. All of the measurements were performed in the energy range 15-25 keV. The table also gives information about the success of detecting a given burst by the JEM-X monitor. The profiles of the bursts included in the table are shown in Fig. 3.
| No. | Source | Burst maximum | , | JEM-X | ||||||
|---|---|---|---|---|---|---|---|---|---|---|
| Date, | Time, | Flux, | , | IM, | LC, | , | ||||
| UTC | h:m:s | Crab | s | с | с | |||||
| 2003 | ||||||||||
| GX 354-0 | 28.02 | 07:55:06 | 1 | 5 | + | |||||
| GX 354-0 | 01.03 | 00:04:50 | 1 | 5 | ||||||
| GX 354-0 | 01.03 | 16:05:33 | 1 | 5 | ||||||
| GX 354-0 | 02.03 | 07:42:22 | 1 | 5 | ||||||
| 4U 1636-536 | 04.03 | 19:18:02 | 2 | 5 | ||||||
| 4U 1702-429 | 09.03 | 21:51:13 | 1 | 5 | ||||||
| 4U 1608-522 | 09.03 | 22:35:05 | 1 | 5 | ||||||
| GX 354-0 | 12.03 | 10:22:26 | 1 | 5 | ||||||
| 4U 1702-429 | 12.03 | 11:11:03 | 1 | 5 | ||||||
| 4U 1608-522 | 13.03 | 13:49:37 | 1 | 5 | ||||||
| 4U 1702-429 | 15.03 | 02:38:07 | 1 | 5 | + | |||||
| 4U 1702-429 | 15.03 | 18:22:49 | 2 | 5 | ||||||
| GX 354-0 | 15.03 | 20:36:46 | 3 | 5 | ||||||
| GX 354-0 | 03.04 | 08:40:18 | 1 | 5 | ||||||
| Aql X-1 | 06.04 | 07:42:15 | 2 | 5 | + | |||||
| 4U 1724-307 | 06.04 | 18:32:31 | 2 | 5 | ||||||
| GX 354-0 | 06.04 | 19:45:29 | 2 | 5 | + | |||||
| GX 354-0 | 07.04 | 03:26:31 | 1 | 5 | ||||||
| 4U 1636-536 | 11.04 | 18:13:18 | 6 | 5 | ||||||
| 4U 1702-429 | 15.04 | 06:47:16 | 1 | 5 | ||||||
| 4U 1812-12 | 21.04 | 03:36:36 | 1 | 10 | ||||||
| 4U 1812-12 | 25.04 | 10:54:25 | 1 | 5 | ||||||
| 2S 0918-549 | 16.06 | 20:09:13 | 1 | 5 | ||||||
| 4U 1702-429 | 18.08 | 10:05:10 | 1 | 5 | ||||||
| GX 354-0 | 24.08 | 22:20:44 | 2 | 5 | ||||||
| SAX J1712.6-3739 | 25.08 | 18:45:43 | 2 | 5 | ||||||
| GX 354-0 | 27.08 | 19:59:14 | 2 | 5 | ||||||
| GX 354-0 | 28.08 | 01:24:04 | 5 | 5 | + | |||||
| GX 354-0 | 28.08 | 06:01:30 | 2 | 5 | + | |||||
| GX 354-0 | 29.08 | 14:31:29 | 2 | 5 | ||||||
| GX 354-0 | 29.08 | 19:23:36 | 2 | 5 | ||||||
| GX 354-0 | 31.08 | 15:54:18 | 3 | 5 | + | |||||
| GX 354-0 | 03.09 | 03:26:34 | 2 | 5 | + | |||||
a - The bin near the burst maximum used to calculate the flux.
b - The burst duration.
c - The source detection significance in the image during the bin .
d - The source detection significance from the detector count rate in the bin .
e - The bursts that were also detected by the JEM-X telescope.
Table 2: Contd.
| No. | Source | Burst maximum | , | JEM-X | ||||||
|---|---|---|---|---|---|---|---|---|---|---|
| Date, | Time, | Flux, | , | IM, | LC, | , | ||||
| UTC | h:m:s | Crab | s | с | с | |||||
| 2003 | ||||||||||
| GX 354-0 | 03.09 | 08:39:32 | 2 | 5 | + | |||||
| GX 354-0 | 03.09 | 18:02:39 | 5 | 5 | ||||||
| 4U 1812-12 | 06.09 | 00:23:32 | 1 | 5 | ||||||
| GX 354-0 | 07.09 | 20:30:07 | 5 | 5 | ||||||
| GX 354-0 | 08.09 | 13:41:36 | 1 | 5 | ||||||
| 4U 1724-307 | 08.09 | 18:48:30 | 1 | 5 | + | |||||
| GX 354-0 | 08.09 | 19:41:21 | 1 | 5 | + | |||||
| GX 354-0 | 09.09 | 03:11:36 | 1 | 5 | ||||||
| GX 354-0 | 09.09 | 16:28:54 | 3 | 5 | ||||||
| GX 354-0 | 09.09 | 22:22:24 | 1 | 5 | + | |||||
| GX 354-0 | 11.09 | 05:04:28 | 1 | 10 | ||||||
| GX 354-0 | 11.09 | 10:57:50 | 2 | 5 | ||||||
| GX 354-0 | 11.09 | 21:59:51 | 1 | 5 | + | |||||
| GX 354-0 | 12.09 | 03:12:25 | 1 | 5 | + | |||||
| GX 354-0 | 12.09 | 09:22:40 | 1 | 5 | + | |||||
| GX 354-0 | 13.09 | 16:40:43 | 5 | 5 | ||||||
| GX 354-0 | 13.09 | 22:28:39 | 1 | 5 | ||||||
| GX 354-0 | 14.09 | 15:02:23 | 1 | 5 | + | |||||
| GX 354-0 | 14.09 | 20:55:10 | 2 | 5 | ||||||
| GX 354-0 | 15.09 | 09:40:18 | 3 | 5 | ||||||
| GX 354-0 | 15.09 | 15:49:09 | 1 | 5 | ||||||
| SLX 1735-269 | 15.09 | 17:42:29 | 1 | 5 | + | |||||
| GX 354-0 | 17.09 | 02:42:50 | 1 | 5 | ||||||
| GX 354-0 | 17.09 | 08:58:31 | 1 | 5 | ||||||
| GX 354-0 | 18.09 | 10:33:36 | 1 | 5 | ||||||
| GX 354-0 | 19.09 | 16:12:10 | 1 | 5 | + | |||||
| GX 354-0 | 20.09 | 05:40:37 | 1 | 5 | ||||||
| GX 354-0 | 20.09 | 23:47:03 | 1 | 5 | ||||||
| GX 354-0 | 21.09 | 14:07:40 | 1 | 5 | ||||||
| GX 354-0 | 22.09 | 17:38:26 | 2 | 5 | ||||||
| GX 354-0 | 23.09 | 02:16:11 | 1 | 5 | ||||||
| SLX 1735-269 | 23.09 | 05:11:43 | 5 | 5 | ||||||
| GX 354-0 | 23.09 | 10:53:38 | 1 | 5 | ||||||
a - The bin near the burst maximum used to calculate the flux.
b - The burst duration.
c - The source detection significance in the image during the bin .
d - The source detection significance from the detector count rate in the bin .
e - The bursts that were also detected by the JEM-X telescope.
Table 2: Contd.
| No. | Source | Burst maximum | , | JEM-X | ||||||
| Date, | Time, | Flux, | , | IM, | LC, | , | ||||
| UTC | h:m:s | Crab | s | с | с | |||||
| 2003 | ||||||||||
| GX 354-0 | 23.09 | 18:15:09 | 1 | 5 | ||||||
| SLX 1735-269 | 23.09 | 23:13:11 | 5 | 5 | ||||||
| GX 354-0 | 24.09 | 03:52:12 | 1 | 5 | ||||||
| GX 354-0 | 24.09 | 11:01:26 | 1 | 5 | + | |||||
| SAX J1712.6-3739 | 24.09 | 14:00:09 | 2 | 10 | ||||||
| GX 354-0 | 24.09 | 18:20:21 | 1 | 5 | ||||||
| 4U 1608-522 | 26.09 | 02:38:55 | 1 | 5 | ||||||
| 4U 1608-522 | 26.09 | 15:34:51 | 1 | 5 | + | |||||
| 4U 1608-522 | 27.09 | 04:03:44 | 1 | 5 | + | |||||
| 4U 1812-12 | 27.09 | 16:08:45 | 1 | 5 | ||||||
| GX 354-0 | 04.10 | 22:06:42 | 2 | 5 | ||||||
| GX 354-0 | 05.10 | 09:34:42 | 1 | 5 | ||||||
| 2004 | ||||||||||
| GX 354-0 | 17.02 | 04:47:50 | 1 | 5 | ||||||
| IGR J17364-2711 | 17.02 | 14:41:30 | 1 | 10 | ||||||
| GX 354-0 | 27.02 | 10:55:16 | 1 | 5 | + | |||||
| GX 354-0 | 27.02 | 13:32:36 | 2 | 5 | + | |||||
| GX 354-0 | 27.02 | 15:32:03 | 1 | 5 | + | |||||
| GX 354-0 | 02.03 | 07:34:38 | 2 | 5 | ||||||
| GX 3+1 | 02.03 | 09:25:34 | 2 | 5 | + | |||||
| 4U 1724-307 | 03.03 | 04:14:60 | 3 | 5 | + | |||||
| 4U 1608-522 | 20.03 | 20:59:32 | 1 | 5 | ||||||
| 4U 1608-522 | 21.03 | 01:03:47 | 1 | 5 | + | |||||
| Aql X-1 | 24.03 | 17:03:35 | 2 | 5 | ||||||
| GX 354-0 | 29.03 | 02:40:47 | 3 | 5 | ||||||
| GX 354-0 | 30.03 | 03:25:33 | 5 | 5 | ||||||
| SLX 1744-299 | 30.03 | 03:37:46 | 5 | 5 | ||||||
| KS 1741-293 | 30.03 | 03:43:45 | 5 | 5 | ||||||
| GX 354-0 | 31.03 | 03:09:05 | 5 | 5 | ||||||
| GX 354-0 | 01.04 | 23:36:53 | 5 | 5 | ||||||
| Aql X-1 | 28.04 | 07:54:48 | 2 | 5 | ||||||
| Aql X-1 | 01.05 | 22:56:47 | 1 | 5 | + | |||||
a The bin near the burst maximum used to calculate the flux.
b The burst duration.
c The source detection significance in the image during the bin .
d The source detection significance from the detector count rate in the bin .
e The bursts that were also detected by the JEM-X telescope.
There are several multipeaked bursts among the events listed in Table 2. For these bursts, column 4 gives the time of the maximum flux over the entire burst, not in the first peak. To determine the burst duration , we analyzed the time history of the ISGRI count rate in the corresponding session with a resolution of 1 s. The burst onset and end were defined as the times the count rate exceeded the session-averaged level by 10%. The maximum burst flux was determined when analyzing the image of the sky area in the IBIS field of view reconstructed with the OSA 4.2 software package during . The fluxes in Table 2 are in units of the IBIS/ISGRI flux from the Crab Nebula, which allows them to be used for physical estimations, for example, for estimating the burst fluence.
![[Uncaptioned image]](/html/astro-ph/0605638/assets/x4.png)
![[Uncaptioned image]](/html/astro-ph/0605638/assets/x5.png)
![[Uncaptioned image]](/html/astro-ph/0605638/assets/x6.png)
![[Uncaptioned image]](/html/astro-ph/0605638/assets/x7.png)
![[Uncaptioned image]](/html/astro-ph/0605638/assets/x8.png)
![[Uncaptioned image]](/html/astro-ph/0605638/assets/x9.png)

A New X-ray Burster
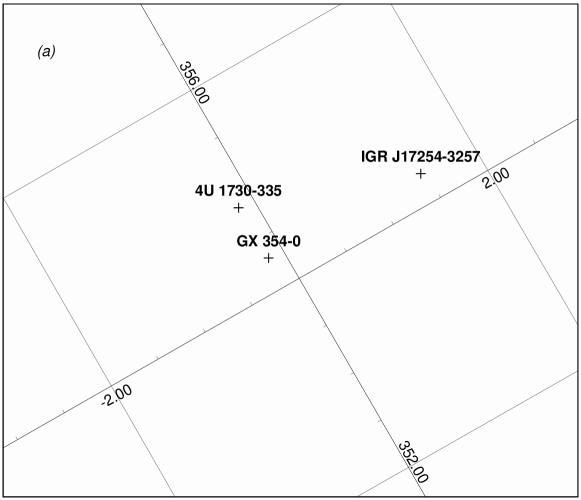
The X-ray burst no. 80 in Table 2 was detected by the IBIS/ISGRI telescope on February 17, 2004, from a hitherto unknown burster located in the Galactic center region (at ′ from the source SLX 1735-269). Figure 4a shows an image of the sky area in the field of view (a map) obtained in the energy range 15-25 keV over 10 s during a burst. The new source that we named IGR J17364-2711, the only statistically significant source in this image, was detected at . Its position, and (epoch 2000.0), was determined with an accuracy of 2 arcmin222 Because of a peculiarity of the IBIS coded mask, there is duality in determining the position of the source in several cases. The other possible position of the source of the burst under consideration, and , is less likely than the above one, although it cannot be completely rejected.. The maximum photon flux reached Crab, which corresponded to a 15–25 keV luminosity erg s-1 at the distance of the Galactic center kpc. The burst spectrum was very soft and the photon flux at energies keV fell below the detection level. Assuming the spectrum to have a Wien shape with a temperature keV typical of bursts with photospheric expansion, we find the bolometric luminosity of this burst, erg s-1. In complete agreement with the assumption of photospheric expansion, this luminosity is actually close to the Eddington limit. Unfortunately, the burst was not detected in the standard X-ray energy range, since during the simultaneous observations with the JEM-X monitor it was at the very edge of the JEM-X field of view, which is narrower than the IBIS one. Thus, it was not possible to refine .
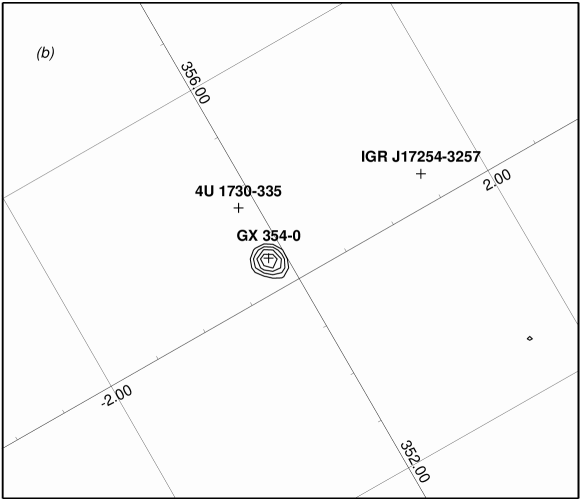
Figure 4b shows an image of the same sky area as that in Fig. 4a, but it was obtained over the entire observing session of February 16–17, 2004, except the pointing during which the burst occurred. In the image, we clearly see four sources detected in this region. There is no IGR J17364-2711 among them. The corresponding limit on its persistent 15–25 keV flux is 4 mCrab. Assuming the source to have a power-law spectrum with an index , we obtain a fairly stringent limit on its 2–30 keV luminosity, erg s-1. This source complements the list of X-ray bursters (see, e.g., Cocchi et al. 2001; Cornelisse et al. 2002) that have never been observed in a state of persistent X-ray emission, but that have been detected only during rather rare bursts. Note that the nearest source detected in the soft (0.1–2.4 keV) X-ray energy range during the highly sensitive ROSAT all-sky survey, 1RXS J173602.0-272541, is located at an angular distance of ′ from IGR J17364-2711.
Previously Known Bursters
In general, the bursts detected by the IBIS/ISGRI telescope are harder and more intense than ordinary events of this type. Therefore, it is quite pertinent to provide here information about these sources.
2S 0918-549 is a member of a very close X-ray binary with a helium white dwarf as the donor. It was identified as a burster by Jonker et al. (2001). Over the entire history of its observations, seven type-I X-ray bursts (int Zand et al. 2005), including the very long burst observed by the BeppoSAX satellite on October 1, 1996, for min (the exponential decay time was 117 s), have been detected from this source. The remaining bursts did not exceed 6-29 s in duration. The maximum fluxes for most of the bursts reached 2-3 (in the very long burst, 3.7) Crab in the standard X-ray energy range. Two additional weak bursts from the source could not be classified as type-I bursts on the basis of the available data. Analysis of the IBIS/ISGRI data revealed the tenth of the X-ray bursts ever detected from this burster (Table2, burst 23). The maximum 15-25 keV flux was 3.6 Crab.
4U 1608-522 is known as a soft X-ray transient with a lifetime of 2–3 months and a recurrence time of about one year. The first X-ray bursts fromtheNorma constellation presumably associated with it were detected by the Vela 5 and Uhuru observatories (Belian et al. 1976; Grindley and Gursky 1976). Subsequently, 22 bursts were detected from 4U 1608-522 by the Hakucho observatory. Their analysis showed a strong correlation between the burst properties and the persistent flux from the source: the burst duration in its on state was s, while in the off state it varied between 10 and 30 s; the maximum burst flux in the latter case was appreciably weaker (Murakami et al. 1980a). Interestingly, although the burst rate generally did not depend on the flux, the two bursts detected in the off state occurred with an interval of only min (Murakami et al. 1980b). Analysis of the 17 bursts observed from 4U 1608-522 by the Tenma observatory revealed the appearance of a hard component in the source s spectrum both in the quiescent state and during the burst, when the flux fell below a certain level (Nakamura et al. 1989). The hard component during the burst was explained by Comptonization of the blackbody radiation in the high temperature plasma surrounding the neutron star. The double-peaked structure in the soft ( keV) energy channels in the profile of the X-ray burst detected from the source in 1987 by the EXOSAT observatory was also explained by Comptonization. No photospheric expansion with which this structure is usually associated was detected in this burst (Gottwald et al. 1987). In 2005, a superburst with a duration of several hours was detected from 4U 1608-522 (Remillard and Morgan 2005; Kuulkers 2005).
Table2 lists the seven bursts detected by the IBIS telescope from this source: two in March 2003, two in March 2004, and three in September 2003 (bursts 7, 10, 73, 74, 75, 87, and 88). Their detection in the ISGRI energy range is indicative of a fairly large hardness, suggesting that they occurred during the sources low state. The short burst duration of 8-14 s, which is more characteristic of bursts in the source s high state, can again be associated with the hard energy range in which the observations were performed. A decrease in duration in the hard energy channels compared to the soft ones is typical of type-I bursts. The bursts had a classical shape: a fast rise and a slower exponential decay. In the standard X-ray energy range (three events, 74, 75, and 88, were also detected by the JEM-X monitor), a double-peaked structure appeared in the burst profiles near the flux maximum.
4U 1636-536 has been known as an X-ray burster since 1976, when several bursts were detected from it by the OSO-8 satellite (Swank et al. 1976a). Owing to their high rate and regularity, the bursts from this source were analyzed by all of the succeeding X-ray observatories, including SAS-3, Hakucho, Tenma, EXOSAT, KVANT, RXTE, and BeppoSAX. A significant variability (see, e.g., Lewin et al. 1987) both in the burst profile shape and peak flux (by a factor of 6) and in the recurrence time (by a factor of 24) was found. The IBIS/ISGRI telescope detected two bursts of moderate intensity Crab and duration s (bursts 5 and 19 in Table 2) from this source.
4U 1702-429 was identified as a burster in 1979 based on observations from the Hakucho satellite (Makishima et al. 1982). Bursts from it may have also been observed previously by the OSO-8 (Swank et al. 1976b) and SAS-3 (Marshall et al. 1977) satellites. Subsequently, bursts from the source were analyzed by the EXOSAT (Oosterbroek et al. 1991), KVANT (Emelyanov et al. 2001), GRANAT(Grebenev et al. 2000), RXTE (Markwardt et al. 1999), and BeppoSAX (Cornelisse et al. 2003) observatories. Analysis of the sources burst activity revealed its variations on a time scale of about one year. Six bursts detected by the IBIS/ISGRI telescope (Table 2, bursts 6, 9, 11, 12, 20, and 24) were identified with 4U 1702-429. The first three bursts had a double-peaked feature in the profile near the flux maximum (Fig. 3). For burst 11 observed by the JEM-X monitor, such a structure was also found in the profile in the standard X-ray energy range. These profiles were generally morphologically similar and the burst began almost simultaneously in both energy ranges. On the other hand, the peak flux was reached earlier and the burst lasted longer in the standard energy range.
The X-ray transient SAX J1712.6-3739 was discovered by the BeppoSAX observatory on August 24, 1999, at the time of its outburst (int Zand et al. 1999). The weak ( mCrab in the energy range 0.1–2.4 keV) X-ray source 1RXS J171237.1-373834 from the ROSAT all-sky survey fell within the error circle. Several days later, on September 2, 1999, a type-I X-ray burst was detected by BeppoSAX from this direction after the fading of the transient (Cocchi et al. 1999). This burst has long remained the only known one. Using the IBIS/ISGRI telescope, we were able to detect two more bursts from the source (nos. 26 and 71 in Table 2). Both bursts had a triangular profile. We failed to trace the evolution of the bursts in the standard X-ray energy range, since the source was outside the JEM-X field of view in both cases.
The burster 4U 1724-307 is located in the globular cluster Terzan 2. Grindley (1978) showed that 4U 1724-307 was the source of the intense and long ( s) burst detected in 1975 by the OSO-8 satellite (Swank et al. 1977). At least three additional intense bursts similar to the 1975 burst with strong photospheric expansion have been detected to date from the source (by the ART-P telescope onboard the GRANAT observatory, the PCA instrument onboard the RXTE observatory, and the MECS instrument onboard the BeppoSAX observatory; Guainazzi et al. 1998; Molkov et al. 2000). More than twenty weaker bursts have also been detected.
In Table 2, three bursts (16, 39, and 86) are associated with this source. Burst 39 supplements the list of its known superstrong bursts. Since the source was at the center of the IBIS and JEM-X field of view at the time of this burst, Fig. 3 shows the time profiles of this event in two energy ranges. We see from this figure that they differ greatly: whereas in the soft energy range the burst had a narrow precursor and a broad main event with a sharp rise and a long ( s) exponential decay, i.e., had all of the features characteristic of type-I bursts (Hoffman et al. 1977), in the hard energy range it had an almost triangular profile, the flux reached its maximum considerably later than in the soft energy range, and the burst itself lasted only s. Note that burst 86, which was also detected by JEM-X, in the soft energy range has a profile that does not differ greatly from its IBIS profile.
GX 354-0 (4U 1728-337) clearly stands out among the bursters from which the IBIS/ISGRI telescope detected X-ray bursts. This source is responsible for 61 bursts in Table 2. Discovered in 1976 (Lewin 1976; Hoffman et al. 1976), it rapidly became one of the best known bursters. Its burst recurrence time ranges from several hours to several tens of hours. The large number of bursts detected from GX 354-0 by the IBIS/ISGRI telescope allowed the statistical distributions of its bursts in recurrence time, duration, and maximum flux to be analyzed.

Figure 5 shows the distribution of X-ray bursts in recurrence time (the interval between the detection times of two successive events). We took into account only 36 events with h. Since the time of continuous observations of the source usually did not exceed 20 h, bursts that were not detected by the detector are almost certain to have occurred between more widely spaced events. Assuming that the properties of the continuum emission from the source (e.g., the accretion rate) did not change and that the distribution of bursts in generally obeyed Poissonian statistics, we fitted it by the formula
Here, the function
takes into account the threshold nature of thermonuclear flashes (the next burst can occur only after the time it takes to accrete a critical mass of matter on the stellar surface) and specifies the mean burst rate. We additionally took into account the fact that some of the bursts could be missed. Therefore, the events corresponding to double
and triple the recurrence time
may be present in Fig. 5.
As the solid curve in Fig. 5 shows, the above formulas provide satisfactory agreement with the observational data. The value normalized to degrees of freedom is . The best-fit parameters are h-1 and hours. The fraction of the events that were mistaken for successive ones proved to be fairly large, and (their contribution is indicated by the dashed line in the figure). The mean burst recurrence time for this source is hours.

In Fig. 6, burst recurrence time (upper panel) and duration (lower panel) are plotted against maximum flux . We failed to find any regularities in the relationship between these quantities. However, if we examine the relationship between the burst fluence (a quantity equal to the product of the mean flux and the duration, ) and the recurrence time , a certain regularity shows up (Fig. 7). We fitted it by a linear law . This behavior seems natural: the longer the interval between the bursts is, the more matter is accumulated on the neutron star surface and the more intense the coming burst is. It may even be assumed that where is the mean continuum flux from the source (in units of the flux from the Crab Nebula) and is a factor that shows the extent to which the energy release via accretion is more efficient than the energy release through thermonuclear burning. The situation was slightly complicated by the presence of events corresponding to multiple recurrence times in the sample. To reduce their influence, we included only events with h in our fit. The derived parameters are Crab s and Crab s h-1. The corresponding mean flux is mCrab.

In Fig. 8, burst fluence is plotted against burst duration . Here, we also see a regularity whose fitting by a linear law yielded Crab s and Crab s s-1. Such a linear dependence naturally arises in the case of intense bursts with near-Eddington fluxes, but it apparently remains qualitatively valid for weaker bursts as well.

Figure 9 shows the distributions of the detected bursts in maximum flux and duration . On the whole, the bursts are distributed in flux fairly uniformly up to 3.2 Crab. An excess of bursts is observed in the regions of maximum fluxes and 2.2–3.2 Crab. At this juncture, it is probably premature to talk about the existence of two types of bursts characteristic of this source. The distribution of bursts in duration is more nonuniform. Most of the bursts have durations in the range 5–7 s. Using the above dependences , , and , we can attempt to approximate the distribution of the detected bursts in duration:
where . The result of this approximation is indicated in Fig. 9 by the solid line.We had to correct the normalization of this distribution to allow for the difference in the numbers of bursts presented in Figs. 5 and 9.

SLX 1735-269 has a hard power-law X-ray spectrum. As a result, the nature of its compact object has long remained uncertain (see, e.g., Grebenev et al. 1997). The first X-ray burst from this source that put an end to the debate about its nature was detected only recently (Bazzano et al. 1997). In Table 2, this burster is responsible for bursts 55, 65, and 68. The properties of the first burst with an unusually long duration ( s in the IBIS/ISGRI energy range and more than s in the JEM-X energy range) were studied in detail by Molkov et al. (2005). The burst was so intense that it led to a saturation of the JEM-X telemetry channel and the filtering switchon. This is why its profile has an unusual shape in the standard X-ray energy range in Fig. 3. Molkov et al. (2005) provided a reconstructed X-ray profile of this burst. Bursts 65 and 68 lasted s and were considerably less intense than the first burst.
The transient KS 1741-293 was discovered and identified as a burster (two bursts) by the KVANT module during its outburst of August 20–22, 1989 (int Zand et al. 1991). It was at the very edge of the error circle for the source of the X-ray bursts detected by the SAS-3 satellite from the Galactic center region (MXB 1743-29; Lewin et al. 1976). This may be the same source. However, since the position of MXB 1743-29 is inaccurate and the region is densely populated, a chance coincidence seems more likely. Besides, as int Zand et al. (1991) pointed out, the time profiles of their bursts and the bursts detected by the SAS-3 satellite differ greatly.
KS 1741-293 was in a higher state during the INTEGAL observations of the Galactic center region in the spring of 2003 (Belanger et al. 2004) and the spring of 2004 (Grebenev et al. 2004). The only burst identified with it in Table 2 (burst 93) was detected on March 30, 2004.
GX 3+1 (4U 1744-265) is one of the brightest X-ray sources in the field of the Galactic center. It has been known as a burster since 1983 (Makishima et al. 1983). The IBIS/ISGRI telescope detected one burst (no. 85 in Table 2) of moderate intensity from it with an almost triangular profile. In the soft X-ray energy range (the burst was also detected by the JEM-X monitor), its profile was closer to the canonical profile of a type-I burst (Fig. 3).
SLX 1744-299 was discovered by the Spacelab-2 observatory in 1987 (Skinner et al. 1987). Subsequently, an X-ray burst was detected from this direction (Skinner et al. 1990); it showed that, in fact, a pair of close (separated by only ′) sources, SLX 1744-299 and SLX 1744-300 (the latter is a burster), is hidden here. In 1990, five more bursts, including a very intense and long ( s) burst, were detected during intensive observations of the Galactic center region by the ART-P telescope onboard the GRANAT observatory (Pavlisnky et al. 1994). The long burst was identified with SLX 1744-299; i.e., the first source also turned out to be a burster. The IBIS/ISGRI telescope detected burst 92 in Table 2 from these sources.
4U 1812-12 was first identified as a burster by Murakami et al. (1983). Since then and until the INTEGRAL observations, a total of 12 bursts were detected from it (Fleischman et al. 1985; Cocchi et al. 2000). Four of the bursts detected by IBIS/ISGRI were associated with this burster (bursts 21, 22, 36, and 76 in Table 2). All these bursts had a distinct double-peaked profile structure; bursts 22, 36, and 76 may be said to have two separate peaks of equal amplitude spaced 15-20 s apart. Similar profiles were observed for most of the bursts detected in 1996-1999 by the BeppoSAX observatory (Cocchi et al. 2000). This was explained by the attainment of a super-Eddington luminosity during the burst and was used to estimate the distance to the source, kpc.
The transient burster Aql X-1 (4U 1908+005) has much in common with 4U 1608-522 discussed above. X-ray bursts from it were first observed in May 1980 by the Hakucho observatory (Koyama et al. 1981). The IBIS/ISGRI telescope detected four bursts from this burster during the period of observations under consideration (bursts 15, 89, 96, and 97 in Table 2). Bursts 15 and 97 were also observed by the JEM-X monitor. The detection of burst 15 by JEM-X was first reported by Molkov et al. (2003), who discussed in detail the INTEGRAL observations of the X-ray outburst of the source occurred in the spring of 2003. These authors also mentioned the detection of another X-ray burst h after the first burst. Our analysis shows that this burst was too soft to be detectable by ISGRI. The time profiles of bursts 96 and 97 in the hard energy range have a double-peaked structure with a detached precursor. In the soft energy range (at least for burst 97), the precursor merges with the main event and the maximum flux is reached in the interval between the two hard peaks. The burst duration in the X-ray energy range appreciably exceeded its duration at hard energies.
Other Burst Sources
We were able to associate 18 of the localized bursts with sources unrelated to bursters. Given the peculiarities of this work, we only mention them. One, two, and five bursts were detected from the microquasar GRS 1915+105, the pulsar Vela X-1, and the source 4U 1700-377, respectively. Four bursts were identified with the soft gamma repeater SGR 1806-20 (see also Gotz et al. 2005). Six bursts were identified with GRBs occurred in the IBIS field of view (they were previously detected by the IBAS system). A total of 10 GRBs were detected in the IBIS field of view over the period of our observations, but the statistical significance of detecting the four remaining bursts in the light curves in the fairly soft energy range under consideration was lower than . As we mentioned above, 69 more events detected by ISGRI were also detected by the anticoincidence shield of the SPI gamma-ray spectrometer, but were not detected by the GOES monitors, i.e., they are probably GRBs that occurred outside the IBIS field of view.
Even after the inclusion of all these events and 145 probable solar flares (events recorded by the GOES monitors), 748 bursts that were detected by IBIS/ISGRI, but were not unidentified remain. Some of them are undoubtedly associated with instrumental effects, for example, with the excitation of ISGRI elements for a short time. Many bursts turned out to be too weak to be reliably revealed in the image. We plan to continue our analysis of unidentified bursts and to present its results in a separate paper.
DISCUSSION
The main goal of this study was to search for new X-ray bursters in a low (off) state and transient bursters with low persistent luminosities. We discovered one hitherto unknown burster named IGR J17364-2711 during its burst.
Is this number large or small for a Ms exposure of the Galactic center region (see Fig. 1)? First, let us estimate the burst recurrence time for the new source:
Here, is a factor that shows the efficiency of energy release via accretion compared to energy release via thermonuclear burning on the neutron star surface. We assumed all of the bursts from this source to be similar to the burst detected by the ISGRI detector, i.e., to have a duration s and a maximum flux Crab, and took the persistent photon flux from the source to be Crab in the energy range 15–25 keV (which corresponds to a typical (for low-mass X-ray binaries) off-state 2–30 keV luminosity erg s-1 at a distance of 8.5 kpc for a spectrum similar to that of the Crab Nebula). The detection of only one burst in Ms of observations implies that there can be no more than 180 such binaries in this Galactic region where we simultaneously observe up to 80% ( in a field) of the Galactic bulge stars, not counting the stars () of other Galactic components (see Grebenev et al. 1996). This number is comparable to the number of persistent and transient sources, including the bursters, known in the field. More severe constraints on the number of unknown bursters that are constantly in a low (off) state can be obtained using the X-ray luminosity function of the Galaxy (see, e.g., Emel yanov et al. 2001). However, given the hard energy range in which bursts were observed and the related selection of their sources, caution should be exercised here.
Indeed, the X-ray bursts detected by the IBIS/ISGRI telescope and presented in Table 2 differ not so much by the high intensity as by the spectral hardness, which allows their sources to be separated into a special group of bursters. During most of the observations, other known bursters with a high and stable burst rate (GS1826-238, A1742-294, 4U1820-303, 4U1705-440, 4U1735-444, and others) were constantly within the IBIS field of view. No burst was detected from them. At the same time, for example, 61 bursts were detected from GX 354-0, which accounts for more than half of all the ISGRI events identified with bursters. This result cannot be explained by the selection effect; it suggests that the behavior of the source itself is peculiar.
Many of the detected bursts have a double-peaked time profile (see Fig. 3). Generally, this suggests that a critical Eddington flux is reached during a thermonuclear explosion on the neutron star surface; as a result, the atmosphere of the neutron star begins to outflow and its photosphere begins to expand. The expansion of the photosphere is accompanied by its cooling. This gives rise to a dip in the time profile, which is particularly large at hard energies, and to a double-peaked structure. This picture is complicated by Comptonization effects, which increase in importance in a radiation-dominated medium, and by peculiarities of the thermonuclear reactions. Unfortunately, in most cases, we failed to obtain the burst time profiles in the standard X-ray energy range. The JEM-X field of view is only % of the IBIS field of view. Therefore, the JEM-X monitor was able to observe only 28 of the 97 IBIS bursts under consideration.
ACKNOWLEDGMENTS
We wish to thank S.V. Molkov and R.A. Krivonos for helpful discussions. This work is based on the observational data obtained by the INTEGRAL observatory and provided through the Russian and European INTEGRAL Science Data Centers. The study was supported by the Russian Foundation for Basic Research (project no. 05-02-17454), the Presidium of the Russian Academy of Sciences (the Nonstationary Astronomical Phenomena Program), and the Program of the Russian President for Support of Leading Scientific Schools (project no. NSh-2083.2003.2).
REFERENCES
1. A. Bazzano, M. Cocchi, P. Ubertini, et al., IAU Circ. 6668 (1997).
2. G. Belanger, A. Goldwurm, P. Goldoni, et al., Astrophys. J. 601, L163 (2004).
3. R.D. Belian, J.P. Conner, and W.D. Evans, Astrophys. J. 206, L135 (1976).
4. R. Cornelisse, F. Verbunt, J.J. M.in t Zand, et al., Astron. Astrophys. 392, 885 (2002).
5. R. Cornelisse, J.J.M. in’t Zand, F. Verbunt et al., Astron. Astrophys. 405, 1033 (2003).
6. M. Cocchi, L. Natalucci, J. J.M.in t Zand, et al., IAU Circ. 7247 (1999).
7. M. Cocchi, A. Bazzano, L. Natalucci, et al., Astron. Astrophys. 357, 527 (2000).
8. M. Cocchi, A. Bazzano, L. Natalucci, et al., Astron. Astrophys. 378, L71 (2001).
9. N.A. Eismont, A.V. Ditrikh, G.Janin, et al., Astron. Astrophys. 411, L37 (2003).
10. A.N. Emel’yanov, V.A. Arefiev, E.M. Churazov et al., Astron. Lett, 27, 781 (2001).
11. J. R. Fleischman, Astron. Astrophys. 153, 106 (1985).
12. M. Gottwald, L. Stella, N.E. White, and P. Barr, MNRAS 229, 395 (1987).
13. D. Gotz, S. Mereghetti, S. Molkov, et al., Astron. Astrophys. 445, 313 (2005).
14. S.A. Grebenev, M.N. Pavlinsky, and R.A. Sunyaev, in Proc. of the Conf. “Roentgenstrahlung from the Universe” (Ed. H.U. Zimmermann, J.E. Truemper, H. Yorke, Germany, Wuerzburg, MPE Report 263, 1996), p.141.
15. S.A. Grebenev, M.N. Pavlinsky, R.A. Sunyaev, in Proc. of the 2nd INTEGRAL Workshop “The Transparent Universe” (Ed. C. Winkler, T.J.-L. Courvoisier, Ph. Durouchoux, France, St. Malo, ESA SP-382, 1997), p. 295.
16. S.A. Grebenev, A.A. Lutovinov, M.N. Pavlinsky, et al., preprint IKI RAN, 2031 (2000).
17. S.A. Grebenev, M.G. Revnivtsev, R.A. Sunyaev, Astron. Telegram 257 (2004).
18. J. Grindley and H. Gursky, Astrophys. J. 209, L61 (1976).
19. J.E. Grindley, Astrophys. J. 224, L107 (1978).
20. M. Guainazzi, A.N. Parmar, A. Segreto, et al., Astron. Astrophys. 339, 802 (1998).
21. J.A. Hoffman, W.H.G. Lewin, J. Doty, et al., Astrophys. J. 210, L13 (1976).
22. J.A. Hoffman, W.H.G. Lewin, and J. Doty), Astrophys. J. 217, L23 (1977).
23. P.G. Jonker, M. van der Klis, J. Homan, et al., Astrophys. J. 553, 335 (2001).
24. K. Koyama, H. Inoue, K. Makishima, et al., Astrophys. J. 247, L27 (1981).
25. E. Kuulkers, Astron. Telegram 483 (2005).
26. F. Lebrun, J.P. Leray, P. Lavocat, et al., Astron. Astrophys. 411, L141 (2003).
27. W.H.G. Lewin, IAU Circ. 2922 (1976).
28. W.H.G. Lewin, J.A. Hoffman, J. Doty, et al., MNRAS 177, 83P (1976).
29. W.H.G. Lewin, W. Penninx, J. van Paradijs, et al., Astrophys. J. 319, 893 (1987).
30. N. Lund, C. Budtz-Jorgensen, N.J. Westergaard, et al., Astron. Astrophys. 411, L231 (2003).
31. K. Makishima, H. Inoue, K. Koyama, et al., Astrophys. J. 255, 49 (1982).
32. K. Makishima, K. Mitsuda, H. Inoue, et al., Astrophys. J. 267, 310 (1983).
33. C.B. Markwardt, T.E. Strohmayer, and J.H. Swank, Astrophys. J. 512, 125 (1999).
34. H. Marshall, F.K. Li, and S. Rappaport, IAU Circ. 3134 (1977).
35. S. Mereghetti, D. Gotz, J. Borkowski, et al., Astron. Astrophys. 411, L291 (2003).
36. S.V. Molkov, S.A. Grebenev, and A.A. Lutovinov, Astron. Astrophys. 357, L41 (2000).
37. S. Molkov, A. Lutovinov, S. Grebenev, Astron. Astrophys. 411, L357 (2003).
38. S. Molkov, M. Revnivtsev, A. Lutovinov, and R. Sunyaev, Astron. Astrophys. 434, 1069 (2005).
39. T. Murakami, H. Inoue, K. Koyama, et al., Astrophys. J. 240, 143 (1980a).
40. T. Murakami, H. Inoue, K. Koyama, et al., Publ. Astron. Soc. Japan 32, 543 (1980b).
41. T. Murakami, H. Inoue, K. Koyama, et al., Publ. Astron. Soc. Japan 35, 531 (1983).
42. N. Nakamura, T. Dotani, H. Inoue, et al., Publ. Astron. Soc. Japan 41, 617 (1989).
43. T. Oosterbroek, W. Penninx, M. van der Klis, et al., Astron. Astrophys. 250, 389 (1991).
44. M.N. Pavlinsky, S.A. Grebenev, R.A. Sunyaev, Astrophys. J. 425, 110 (1994).
45. R. Remillard and E. Morgan, Astron. Telegram 483 (2005).
46. G.K. Skinner, A.P. Willmore, C.J. Eyles, et al., Nature 330, 544 (1987).
47. G.K. Skinner, A.J. Foster, A.P. Willmore, C.J. Eyles, MNRAS 243, 72 (1990).
48. J.H. Swank, R.H. Becker, S.H. Pravdo, et al., IAU Circ. 3000 (1976a).
49. J.H. Swank, R.H. Becker, S.H. Pravdo, et al., IAU Circ. 3010 (1976b).
50. J.H. Swank, R.H. Becker, E.A. Boldt et al., Astrophys. J. 212, L73 (1977).
51. P. Ubertini, F. Lebrun, G. Di Cocco, et al., Astron. Astrophys. 411, L131 (2003).
52. C. Winkler, T.J.-L. Courvoisier, G. Di Cocco, et al.), Astron. Astrophys. 411, L1 (2003).
53. J.J.M. in’t Zand, J. Heise, A.C. Brinkman, et al., Adv. Space. Res. 11, (8)187 (1991).
54. J.J.M. in t Zand, J. Heise, A. Bazzano, et al., IAU Circ. 7243 (1999).
55. J.J.M. in t Zand, A. Cumming, M. V. van der Sluys, et al., Astron. Astrophys. 441, 675 (2005).