Halo assembly bias and its effects on galaxy clustering
Abstract
The clustering of dark halos depends not only on their mass but also on their assembly history, a dependence we term ‘assembly bias’. Using a galaxy formation model grafted onto the Millennium Simulation of the CDM cosmogony, we study how assembly bias affects galaxy clustering. We compare the original simulation to ‘shuffled’ versions where the galaxy populations are randomly swapped among halos of similar mass, thus isolating the effects of correlations between assembly history and environment at fixed mass. Such correlations are ignored in the halo occupation distribution models often used populate dark matter simulations with galaxies, but they are significant in our more realistic simulation. Assembly bias enhances 2-point correlations by 10% for galaxies with brighter than , but suppresses them by a similar amount for galaxies brighter than . When such samples are split by colour, assembly bias is 5% stronger for red galaxies and 5% weaker for blue ones. Halo central galaxies are differently affected by assembly bias than are galaxies of all types. It almost doubles the correlation amplitude for faint red central galaxies. Shuffling galaxies among halos of fixed formation redshift or concentration in addition to fixed mass produces biases which are not much smaller than when mass alone is fixed. Assembly bias must reflect a correlation of environment with aspects of halo assembly which are not encoded in either of these parameters. It induces effects which could compromise precision measurements of cosmological parameters from large galaxy surveys.
keywords:
cosmology: theory, galaxies: evolution, galaxies: clustering1 Introduction
In a recent study Gao et al. (2005, hereafter GSW05) showed that the clustering of dark matter halos can depend strongly on their formation redshift. Many current galaxy clustering models adopt simplified prescriptions for populating halos with galaxies based on an implicit assumption which is inconsistent with this result, namely that the assembly history of a halo of given mass (and thus its galaxy content) is statistically independent of its larger scale environment (e.g. Kauffmann et al., 1997; Jing et al., 1998; Peacock & Smith, 2000; Benson et al., 2000; Berlind et al., 2003; Yang et al., 2003). GSW05 found that those halos with that assembled at high redshift are substantially more clustered than halos of similar mass that assembled more recently. Earlier studies had missed the strength of this dependence (e.g. Lemson & Kauffmann, 1999; Sheth & Tormen, 2004), apparently because they were based on simulations of insufficient size and resolution to reliably reach the relevant regime. Following GSW05, other authors have demonstrated significant dependences of clustering on halo properties such as concentration and subhalo occupation number, which are strongly correlated with formation redshift (e.g. Wechsler et al., 2006; Zhu et al., 2006).
If the assembly history of dark matter halos is correlated with their large-scale environment, we may expect the same to be true for their galaxy content. This will then affect the large-scale clustering of galaxies in a way which depends on how galaxy properties are established during halo assembly, i.e. on the physics of galaxy formation. A number of recent studies have addressed this question, approaching it from both observational and theoretical points of view (e.g. Yoo et al., 2006; Harker et al., 2006; Yang et al., 2006; Abbas & Sheth, 2006; Reed et al., 2006). Yang et al. (2006) find that, at fixed mass, the clustering of galaxy groups correlates quite strongly with the star formation rate of the central galaxy. On the other hand, Skibba et al. (2006) and Abbas & Sheth (2006) found the clustering in their analysis of SDSS data to be consistent with models with no dependence of halo galaxy populations on halo environment. Yoo et al. (2006) randomly shuffle galaxies between halos of similar mass in a small volume simulation (box side length ) and find effects that are at the level of the statistical uncertainty of their calculation. Much of this work was a response to the presentation of early results from the present project during summer 2005111http://www.mpa-garching.mpg.de/swhite/talk/NNG05.pdf.
The Halo Occupation Distribution (or HOD) method for predicting galaxy clustering has become popular because it bypasses the need to model the physics of galaxy formation when analysing the spatial distribution of galaxies on large scales, for example to constrain the shape and amplitude of the primordial spectrum of density fluctuations. In ‘classic’ HOD models the galaxy population of a halo depends on its mass alone. This makes it possible to marginalise over the parameters describing possible occupation distributions in order to constrain more “fundamental” quantities. Many intended applications require precise measurements and realistic error estimates, so it is important to quantify any systematic uncertainties introduced implicitly by the HOD method. Future large-scale surveys hope to clarify the nature of Dark Matter and of Dark Energy through percent-level measurements of the clustering of very large numbers of galaxies at both low and high redshift (e.g. PanSTARRS (Kaiser et al., 2002) or the Dark Energy Survey (Abbot et al., 2005)). Interpretation will require theoretical models with uncertainties significantly below this level.
In this paper, we quantify how correlations between halo environment and halo assembly history affect galaxy clustering. We use a simulation of the formation and evolution of the galaxy population within a very large region () in the concordance CDM cosmogony (Croton et al., 2006). This simulation was carried out by integrating simplified equations for the evolution of the baryonic component within a stored representation of the evolving dark matter distribution of the largest high-resolution cosmological simulation carried out to date, the so-called ‘Millennium Simulation’ (Springel et al., 2005). Since our galaxy formation modelling explicitly follows the assembly of each dark matter structure, it automatically takes care of effects induced by correlations of halo environment with halo assembly history. We test whether such effects are significant by randomly swapping the galaxy populations of halos of identical mass. Such shuffling does alter galaxy clustering on large scales, although it would not if the ‘classic’ HOD assumption were correct. Our results should reliably indicate the characteristic strength of such systematic effects, even if our specific galaxy formation model is later superseded.
The outline of this paper is as follows. In Section 2 we briefly introduce our simulation and our galaxy formation model. Section 3 then describes in detail how we shuffle galaxy populations between halos of similar properties (i.e. similar mass, but perhaps also similar concentration or formation redshift). The differences in clustering between the galaxy distribution in the original simulation and those produced by such shuffling are explored as a function of the luminosity and colour of galaxies in Section 4. This quantifies the systematic errors to be expected in HOD models and addresses the issue of whether they can be reduced by making the HOD depend on additional halo properties. We conclude in Section 5 with a brief discussion and summary.
2 Simulation Data
The Millennium Simulation follows evolution in the distribution of just over 10 billion dark matter particles in a periodic box of side Mpc. The mass per particle is . The adopted cosmological parameter values are , , , , and , consistent with a combined analysis of the 2dFGRS (Colless et al., 2001) and first year WMAP data (Spergel et al., 2003; Seljak et al., 2005). The dark matter distribution is stored at 64 times spaced approximately logarithmically in expansion factor at early times, and at approximately 300 Myr intervals after . Friends-of-friends (FOF) halos are identified in the simulation at each stored output with a linking length 0.2 times the mean particle separation. Substructure is then identified within each halo using an improved and extended version of the SUBFIND algorithm of Springel et al. (2001). Having found all halos and their subhalos at all output times, hierarchical merging trees are constructed which describe in detail how each structure grows as the universe evolves. These trees are identical to those used by GSW05 and are the representation of the evolving dark matter distribution within which the simulation of galaxy formation is carried out. Further details of the dark matter simulation and of these procedures can be found in Springel et al. (2005).
Our simulation of the formation and evolution of the galaxy population follows the methodology introduced by Kauffmann et al. (1999) and extended by Springel et al. (2001). Virialised dark matter halos at each redshift are assumed to have collapsed with their “fair” share of baryons (e.g. times their total mass) from which galaxies form and evolve. The simulation follows the evolution of the galaxy population in each merger tree. It includes a wide range of galaxy formation physics using simple, physically based models tuned to represent both relevant observational data and more detailed simulations (for detail see Croton et al., 2006). Importantly, it is the detailed merging, accretion and disruption histories of the dark matter halos and their substructures that drive the baryonic modelling and thus ultimately determine the galaxy content of the halos. Croton et al. (2006) and Springel et al. (2005) show that this two-stage simulation scheme can produce a galaxy population consistent with many observed properties of the local population. These include the galaxy luminosity function, the bimodal distribution of colours, the morphology distribution, the Tully-Fisher relation, and 2-point galaxy correlation functions for samples selected by luminosity and type. However, this model is not, of course, perfect. For example, Weinmann et al. (2006) show that it incorrectly predicts some aspects of the colour distribution of satellite galaxies in group-sized halos, and this may impact measurements that are dependent on colour selection. To minimise such uncertainties we will always consider relative measures of bias between shuffled and unshuffled catalogues to indicate the expected size of the assembly bias effect. Due to the large volume of the Millennium Simulation our simulated galaxy catalogue is unprecedented in size, containing galaxies brighter than .
3 The shuffling technique
If galaxy populations within dark matter halos of a given mass are statistically independent of all halo properties other than mass, as assumed in the simplified clustering models described in the Introduction, then galaxy clustering should not depend on how the individual realisations of the satellite–central galaxy population are distributed among the various halos of that mass. We test this by comparing galaxy correlation functions estimated from the catalogue described in Section 2 with identically defined correlation functions estimated from “shuffled” catalogues in which satellite–central galaxy populations are randomly exchanged between halos of similar mass. If halo assembly history is indeed independent of halo environment, such shuffling should have no effect on the estimated correlations.
More specifically, for each FOF dark matter halo we first record the position off-sets of all its galaxies with respect to the ‘central’ galaxy. This central galaxy sits at the bottom of the halo’s potential well, while further galaxies are satellites which may or may not be associated with subhalos catalogued by SUBFIND. We then rank-order all halos by virial mass and divide them into mass bins of width (although because of the rapidly decreasing number of halos in the tail of the mass function the two most massive bins are widened to and . Note that the gradient of the assembly bias effect across this mass range is small, as shown in Figure 3 of Wechsler et al. (2006). Note also that here and elsewhere we define as the mass within the largest sphere surrounding the halo’s potential minimum with mean enclosed density at least 200 times the critical value). We then randomly shuffle the galaxy populations of the halos in each bin. When doing this, we take the new central galaxy of each halo to have the same position as the original central galaxy and we determine the positions of the new satellites using their recorded off-sets from their central galaxy. Each central galaxy thus moves together with its own set of satellites. In the language of HOD modellers (e.g. Cooray & Sheth, 2002) this procedure exactly preserves all 1-halo contributions to galaxy clustering statistics. Any differences between the original and the shuffled catalogues can arise from 2-halo terms only. The shuffling is done 10 times with different random seeds to create 10 different shuffled galaxy catalogues. It can also be carried out among halos for which a second variable, such as halo formation redshift, has been matched in addition to halo mass. We show the effect of such extra constraints in Section 4.3.
To quantify the difference in clustering between the actual and the shuffled galaxy catalogues we measure the 2-point autocorrelation function for each and plot their relative bias, , defined by
| (1) |
Here is the 2-point function of the shuffled catalogue at pair separation , and is the corresponding 2-point function for the original (unshuffled) catalogue. Note that a value of implies that the shuffling dilutes the clustering of the original distribution. Note also that whenever we estimate below, exactly the same galaxy set is use to estimate both and . Only the positions of the galaxies are changed by the shuffling.
4 Results
4.1 The strength of second parameter effects
In Fig. 1 we plot the relative bias between our 10 shuffled galaxy catalogues and the original Millennium Run catalogue as a function of pair separation, and for subsets of galaxies selected in various ways. In this subsection we show results for subcatalogues which contain only galaxies in subhalos with mass (as defined by SUBFIND, see Springel et al., 2005) greater than (i.e. simulation particles). This means that we consider only galaxies which reside in well-resolved dark matter (sub)structures at . In the top panel, relative bias functions are shown for this sample as a whole and for subsamples split by colour at (see Fig. 9 of Croton et al., 2006). The bottom panel presents a similar analysis but further restricts the catalogues to contain only the central galaxies of the halos. Note that for all statistics there is a very small scatter between the 10 relative bias measurements. This demonstrates that ‘small sample’ effects are negligible for the questions we address here.
Consider first the top panel of Fig. 1. The galaxy population as a whole (the solid lines) shows a systematic bias of on large scales. Shuffling has reduced the strength of clustering by a small but significant amount. Note that this result is independent of the galaxy formation model, since shuffling does not change the set of central galaxy positions but merely reassigns populations of well-resolved subhalos among halos of similar mass. Clearly the assembly histories of dark halos are not independent of their clustering properties (as GSW05 already showed) and this does affect galaxy clustering222A preliminary k-space analysis by Nikhil Padmanabhan using one of our shuffled catalogues suggests that the effects of assembly bias on the power spectrum amplitude are non-negligible out to scales of at least (), after which noise dominates the signal. We leave a detailed power spectrum analysis of assembly bias for future work.. Red galaxies (long-dashed lines) are biased in the same way as the sample as a whole but at the level, while blue galaxies (dashed-dotted lines) are biased with the opposite sign at the level. These results do, of course, depend on the galaxy formation model which determines whether galaxies are red or blue. The overall bias is effectively a weighted average of these two partially compensating effects. Note that bias is negligible on small scales and grows to a value which is almost constant for . This reflects the fact that only the 2-halo term contributes (i.e. clustering between galaxies which live in different halos). This is diluted on small scales by 1-halo clustering which is identical in all catalogues. The change in clustering amplitude for galaxies (here ) is smaller than that found by GSW05 for dark matter halos (which was up to a factor of ). This is because we sum clustering contributions from halos with a wide range in mass, thereby diluting the predominantly low-mass GSW05 effect.
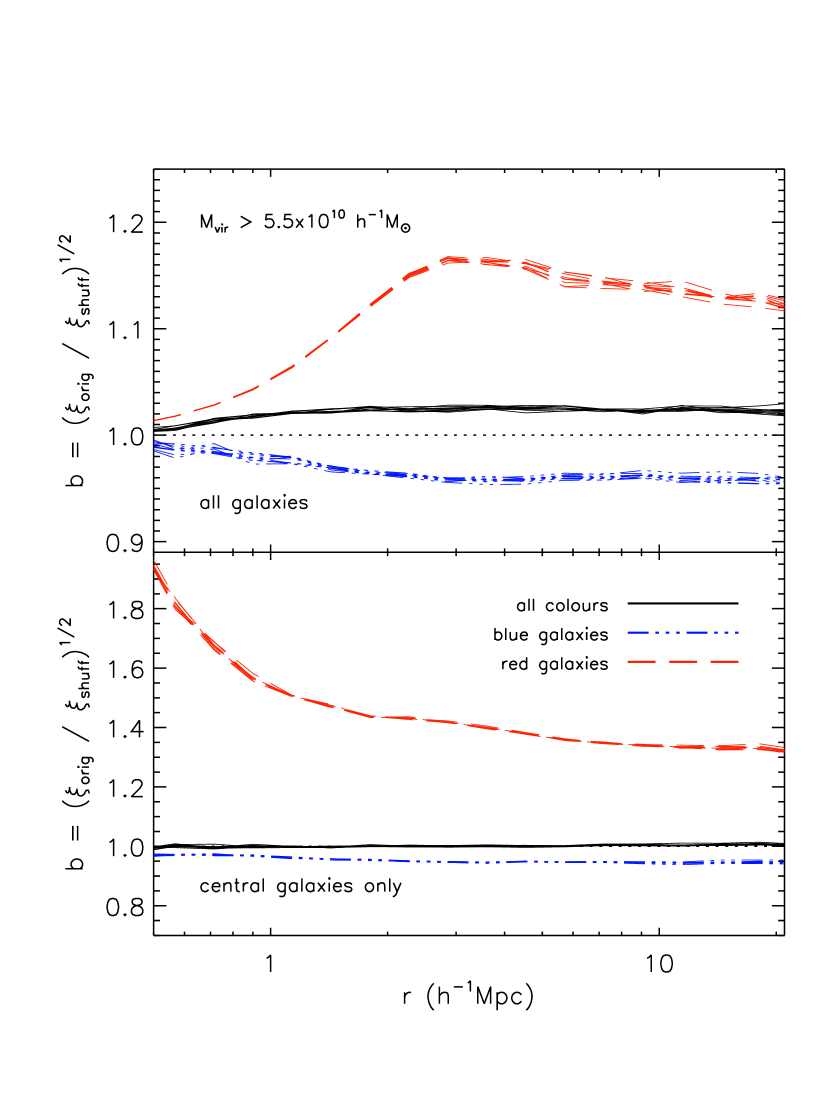
When we consider the clustering of central galaxies only the total number of galaxies in these catalogues is reduced by approximately 30% and the relative bias functions change considerably. By definition, there is now one and only one galaxy in each dark halo so there is no 1-halo contribution to the correlation functions. In addition, the correlation function for the population as a whole is invariant under shuffling. Thus the solid lines in the lower panel of Fig. 1 all coincide with . There are, however, substantial effects when the population is split by colour, demonstrating that the colour of the central galaxy in a halo of given mass depends significantly on the halo’s environment. Halos with red central galaxies show a strong relative bias ( on large scales, rising to on small scales) while halos with blue central galaxies show a weaker one which is very similar to that for all blue galaxies (). The strong effect for red central galaxies reflects the fact that such objects are found primarily in two very specific types of halo: massive halos where cooling and star-formation have been curtailed by AGN feedback; and lower mass halos which have just passed through a more massive system, thereby losing their hot gas atmospheres and so their source of fuel for star formation. Both cases are associated with a massive halo, hence the high clustering amplitude. The great majority of central galaxies are associated with more isolated and/or lower mass halos and have ongoing star formation; these objects are blue.
4.2 Assembly bias as a function of galaxy luminosity
We now generalise the above results including all galaxies which are well resolved by the formation model regardless of their subhalo mass at . Fig. 2 shows the relative bias between the shuffled and the original galaxy populations as a function of both colour and luminosity. On scales 1-halo terms do not contribute to the correlations and the relative bias is approximately constant for all samples we have considered. For simplicity we therefore average the relative bias measurements for each of our 10 shuffled catalogues over the separation range and we characterise the result by the mean and scatter of these values. In the following we refer to this quantity as the assembly bias as it measures the bias induced by the environmental dependence of halo assembly history at fixed halo mass.
The top panel of Fig. 2 shows this assembly bias for absolute magnitude limited subsamples of galaxies as a function of their magnitude limit. Again we plot results for galaxies of all colours (solid line) and for blue (dot-dashed line) and red (long-dashed line) galaxies separately. The bottom panel shows an identical analysis but for samples restricted to central galaxies. Note that selecting galaxy subsamples by limiting stellar mass rather than luminosity produces similar behaviour to that presented below. This is expected given that the scatter in for the galaxies is typically small in comparison with the magnitude range over which the assembly bias changes.
If we focus first on the upper panel of Fig. 2, we see that correlations between assembly history and environment at fixed halo mass can either enhance (for faint galaxies) or dilute (for bright galaxies) the strength of galaxy clustering, with a transition near the characteristic luminosity of the galaxy luminosity function. Fainter than bias values for the red and blue subpopulations are symmetrically offset from the curve for the population as a whole by about 5%. Brighter than this, the bias for the population as a whole approaches that for the red subpopulation, reflecting the fact that there are few blue galaxies at these magnitudes. At blue galaxies have an assembly bias of about 0.9, showing that they occupy halos with significantly lower density environments than randomly selected halos of the same mass.
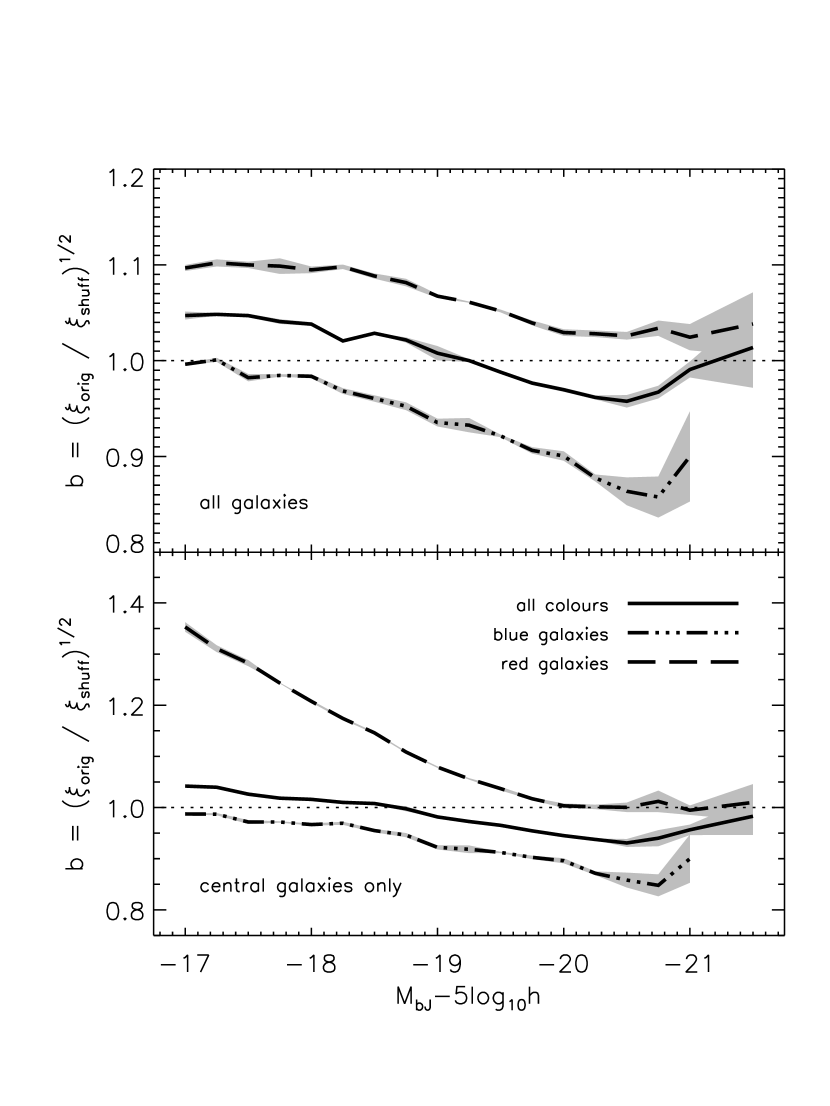
In the bottom panel of Fig. 2 we show the assembly bias for absolute magnitude limited samples of central galaxies (i.e. for samples of halos defined by the luminosity and colour of their central galaxies). A notable difference from the central galaxy samples studied in the bottom panel of Fig. 1 (which were defined by the mass of their halos) is that the assembly bias differs from unity not only for the red and blue subsamples but also for samples without colour selection. This difference is caused by scatter in the relation between halo mass and central galaxy luminosity which correlates with halo environment in a way that is different for halos with faint () and with bright () central galaxies. Low-mass halos with brighter than average central galaxies are in denser than average environments, while the opposite is true for higher mass halos. At all magnitudes blue central galaxies inhabit halos with lower density environments than red central galaxies. This is in part because at given absolute magnitude blue central galaxies tend to have lower mass halos than red ones.
From Fig. 2 we see that assembly bias is strongest for faint red central galaxies. These galaxies reside at the centres of low-mass () dark matter halos and have a value of about 1.4, which translates to an autocorrelation amplitude about twice that which would have been found if their halos had been randomly chosen according to their mass alone. The mean formation redshift of halos with red central galaxies is , whereas blue central galaxies of similar magnitude have halos with . As noted above, many of the faint red central galaxies occupy halos which have recently passed through a much more massive system. As a result they have both high formation redshifts and high density environments. This accounts for much of their strong assembly bias. The bias for all faint red galaxies (see the top panel) is less pronounced due to dilution by satellites in group and cluster mass halos. As GSW05 showed, the correlation between assembly history and environment is much weaker for these than for low-mass halos. In contrast, the blue galaxy curves are similar in the top and bottom panels: this is simply because most blue galaxies are central galaxies. Bright red central galaxies are largely unaffected by assembly bias because they have high mass halos. Such halos almost never have blue central galaxies and for them the GSW05 effect is, in any case, weak.
The extent to which assembly bias effects are due to the properties of satellite galaxies rather than to those of central galaxies can be tested by shuffling satellite populations as before while keeping all central galaxies in their original positions. We have done this, finding relatively weak effects. If we shuffle satellites only, we find an assembly bias to all magnitude limits for the full galaxy population. For the red galaxies, , while for the blue galaxies there is no significant effect, . The fact that shuffling satellites alone changes the correlation amplitude suggests that the satellite population of a halo somehow “knows” about its large-scale environment, in the sense that halos with many neighbours tend to have more substructure than similar mass halos with few. A weak tendency for halos with neighbours to have above-average substructure was already noted by Wechsler et al. (2006).
4.3 A second variable?

The above results show that populating dark halos with a semi-analytic or HOD algorithm based on halo mass alone will result in correlation functions which have systematic errors between 5% and a factor of 2 depending subsample definition. We now ask whether more complex algorithms which include dependences on additional halo properties can account for the assembly bias in our simulated catalogues. At some level this must be possible since the galaxy content of each simulated halo is determined by its detailed assembly history. It is unclear, however, whether this history is suitably summarised by parameters such as formation redshift or concentration. (Navarro et al. (1996), Wechsler et al. (2002) and Gao et al. (2004) have shown that both these properties are closely related to the growth history of a halo’s main progenitor.) To explore this issue we consider two more highly constrained shuffling procedures: swapping galaxy populations between halos of similar mass and similar formation redshift, and between halos of similar mass and similar concentration. In the following, formation redshift is defined as the redshift when a halo’s main progenitor contains half its final mass, as used by Gao et al. (2004) and GSW05. We linearly interpolate halo growth between simulation outputs to increase the precision with which this redshift can be estimated. To estimate halo concentration we take the measured and for each halo and solve Eq. 5 in Navarro et al. (1996).
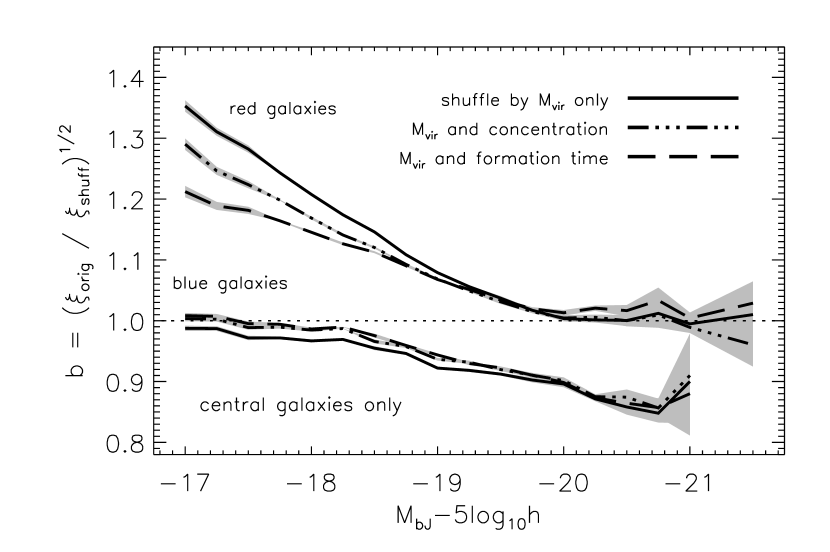
In Fig. 3 we show the result of this exercise. We plot relative bias as defined above (again estimated from an ensemble of 10 shuffled catalogues) for absolute magnitude limited central galaxy subsamples split by colour. These were the subsamples with the most pronounced effects in Fig. 2 and the results from that figure are repeated here as solid lines. The other lines show how the relative bias is reduced when shuffling preserves halo formation redshift or halo concentration in addition to halo mass, thus how much of the assembly bias in the original simulated catalogue can be represented using these additional halo properties. Note that results for the “all colour” and “all galaxy” catalogues presented in Figure 2 show dependences on these additional parameters that are much weaker than the extreme cases shown here, typically less than a few percent. We thus omit them for clarity.
Interestingly, Fig. 3 shows that neither formation redshift nor concentration encodes sufficient information to account for the assembly bias of the simulated galaxy catalogue. Of the two parameters, formation redshift is the most successful, accounting for about 40% of the assembly bias for faint red central galaxies (at the relative bias is reduced from 1.37 to 1.22) but only a few percent of the assembly bias for bright blue central galaxies. Employing concentration as the second parameter is only about half as effective in reducing the relative bias. Concentration dependences can account for only a small fraction of the measured assembly bias. Clearly, although the galaxy content of our simulated halos depends only on their mass and their assembly history, there is some aspect of the assembly history which is not encoded in halo concentration or formation redshift and which correlates with large-scale environment. Fig. 3 demonstrates that halo concentration and halo formation redshift do not encode the same information about large-scale clustering and that neither provides the information needed for precise modelling of the large-scale clustering of galaxies.
Fig. 4 explores the relation of central galaxy properties to formation redshift in more detail. It shows the distribution of formation redshift for dark matter halos in two mass ranges, and . In each range we compare the distribution for all halos (solid lines) with those for subpopulations which are extreme in their central galaxy properties, either luminosity or colour. Dashed and dotted curves in the left panel correspond to the 30% tails containing the brightest and the faintest central galaxies respectively, while in the right panel they refer instead to the 30% bluest and reddest central galaxies.
Fig. 4 shows the well known result that low-mass halos have a broad distribution of formation redshifts, centred at and extending from to , while high-mass halos formed more recently, with a distribution centred at and with tails extending from to (see Lacey & Cole, 1993). For low-mass halos there is a weak but significant shift in formation redshift distribution between those with bright and those with faint central galaxies: faint central galaxies live in halos that formed systematically earlier than those of their brighter counterparts. (In this mass bin the mean absolute magnitudes of the faintest and 30% brightest central galaxies are and , respectively). The converse appears true in high-mass halos: brighter central galaxies tend to occupy halos that formed earlier, while fainter central galaxies occupy halos that formed later. (The mean absolute magnitudes of the faintest and brightest central cluster galaxies are and respectively).
For low-mass halos the effects as a function of colour are significantly stronger. The right panel of Fig.4 shows that halos with red central galaxies have significantly earlier formation redshifts than those with blue. The mean colour of the central galaxy shifts from to between the two tails. For high-mass halos there is little difference in the formation redshift distribution between those with the reddest and those with the bluest central galaxies. This is simply because most of the central galaxies in high-mass halos are red; the shift in colour between the two tails is only from to in this case. In combination with the effect discovered by GSW05, the correlation between central galaxy colour and halo formation redshift in low-mass halos explains a significant part (roughly half) of the large-scale assembly bias which we measure for faint red central galaxies (see Fig. 3).
5 Discussion and conclusions
We ask a simple question in this paper: to what degree is galaxy clustering influenced by the assembly bias of dark halos, the fact that their clustering depends not only on their mass but also on the details of their assembly history? Such dependences are neglected in the halo occupation distribution schemes that have become popular for constructing galaxy catalogues from dark matter simulations. Our results show that they are significant, however, and thus may introduce systematic errors if HOD techniques are used to derive cosmological parameters from the clustering in large galaxy surveys. It appears that this problem is not easily addressed by including an additional halo parameter in HOD models. Detailed tracking of galaxy formation during halo assembly seems necessary.
Our conclusions are based on analysis of galaxy clustering in a very large simulation in which the formation of galaxies has been followed explicitly during halo assembly. By comparing galaxy catalogues drawn from this simulation with ‘shuffled’ catalogues where galaxy populations have been swapped among halos of similar properties, we can measure the sensitivity of galaxy clustering to the details of halo assembly. Our principal results can be summarised as follows:
-
•
Assembly bias can be significant and can be of either sign. The effects differ qualitatively between galaxy samples selected above a halo mass limit and those selected above a galaxy luminosity limit, as well as between samples containing all galaxy types and those containing only the central galaxies of halos. In addition they depend on galaxy colour. The strongest effects are found for low-luminosity, red central galaxies. Assembly bias enhances the amplitude of their 2-point correlations by almost a factor of 2.
-
•
Simulation galaxies selected to a faint absolute magnitude limit (e.g. ) are more strongly clustered than they would be if halos of a given mass had galaxy populations distributed independently of other halo properties. This effect reverses for samples selected above a relatively bright absolute magnitude limit (e.g. ). In both cases the bias alters the amplitude of the 2-point correlation function of the galaxies by up to 10%.
-
•
When absolute magnitude limited galaxy samples are split by colour at , the blue and red subsamples have values of assembly bias which are off-set from the value for their parent samples by and respectively, corresponding to 10% off-sets in autocorrelation amplitude.
-
•
As expected from the results of GSW05, halo formation redshift encodes some of the effects leading to assembly bias. Surprisingly, however, allowing the galaxy populations of halos to depend on halo formation redshift in addition to halo mass accounts for only 40% of the assembly bias for red central galaxies and has no influence on that for blue central galaxies. Halo concentration is even less successful as a second parameter, only half as effective as formation redshift in accounting for assembly bias in the simulation. Most of this bias must be due to a correlation between other aspects of halo assembly and halo environment.
-
•
As is well known, dark matter halos of a given mass show a wide range of formation redshifts. For given mass, the distribution of formation redshift depends both on the colour and on the luminosity of the central galaxy. The effects are in most cases quite weak, however, reinforcing the impression that other aspects of halo formation must be responsible for the strong assembly bias we find for colour- and absolute magnitude selected samples of central galaxies.
New large-scale galaxy surveys, such as PanSTARRS (Kaiser et al., 2002) and the Dark Energy Survey (Abbot et al., 2005), are currently being designed to obtain extremely precise measures of galaxy clustering at a variety of redshifts. The goal is to use these to infer the linear power spectrum of density fluctuations, the rate at which it grows with redshift, and the recent expansion history of the Universe. These quantities then constrain the nature of Dark Matter, the nature of Dark Energy, and the process which created all cosmic structure. Significant conclusions will require measures of galaxy clustering to be translated into estimates of more fundamental cosmological parameters (e.g. the amplitude of linear fluctuations at each redshift, the characteristic scale of baryon wiggles, the effective slope of the primordial power spectrum…) with a precision of a few percent or better. The stated goal for the HOD machinery is to convert observed clustering measures to fundamental quantities at this level of precision, while bypassing the need to understand the details of galaxy formation. Our results suggest that the details of galaxy formation do affect clustering statistics at at least the 5% level in a way which cannot easily be included in an HOD model.
It is important to stress that we do not claim that our galaxy formation model is correct, just that it is plausible, and so can be used to explore the size of assembly bias effects. For many applications a systematic error in galaxy correlation amplitudes at the or percent level can safely be ignored. Nevertheless, if we wish to understand galaxy formation we must clearly model it. The results presented in this paper show not only that galaxy formation influences large-scale clustering in unexpected ways which are not consistent with current simplified clustering models, but also that these models may be subject to systematic errors which make them unsuitable for interpreting precision measures of galaxy clustering in terms of fundamental physics. A deeper understanding of galaxy formation appears required to carry through this programme successfully.
Acknowledgements
The authors would like to thank Nikhil Padmanabhan for measuring the Fourier space assembly bias using one of our shuffled catalogues. Special thanks to the referee, David Weinberg, for valuable comments that improved the quality of this paper. DC acknowledges support from NSF grant AST00-71048. The Millennium Run simulation used in this paper was carried out by the Virgo Supercomputing Consortium at the Computing Centre of the Max-Planck Society in Garching. The galaxy catalogues used here are publicly available at http://www.mpa-garching.mpg.de/galform/agnpaper.
References
- Abbas & Sheth (2006) Abbas U., Sheth R. K., 2006, MNRAS, submitted, astro-ph/0601407
- Abbot et al. (2005) Abbot T., Adering G., Annis J., (The Dark Energy Survey Collaboration), 2005, astro-ph/0510346
- Benson et al. (2000) Benson A. J., Cole S., Frenk C. S., Baugh C. M., Lacey C. G., 2000, MNRAS, 311, 793
- Berlind et al. (2003) Berlind A. A., Weinberg D. H., Benson A. J., et al., 2003, ApJ, 593, 1
- Colless et al. (2001) Colless M., Dalton G., Maddox S., et al., 2001, MNRAS, 328, 1039
- Cooray & Sheth (2002) Cooray A., Sheth R., 2002, PhysRep, 372, 1
- Croton et al. (2006) Croton D. J., Springel V., White S. D. M., et al., 2006, MNRAS, 365, 11
- Gao et al. (2005) Gao L., Springel V., White S. D. M., 2005, MNRAS, 363, L66
- Gao et al. (2004) Gao L., White S. D. M., Jenkins A., Stoehr F., Springel V., 2004, MNRAS, 355, 819
- Harker et al. (2006) Harker G., Cole S., Helly J., Frenk C., Jenkins A., 2006, MNRAS, 367, 1039
- Jing et al. (1998) Jing Y. P., Mo H. J., Boerner G., 1998, ApJ, 494, 1
- Kaiser et al. (2002) Kaiser N., Aussel H., Burke B. E., et al., 2002, in Survey and Other Telescope Technologies and Discoveries. Edited by Tyson, J. Anthony; Wolff, Sidney. Proceedings of the SPIE, Volume 4836, pp. 154-164 (2002)., edited by J. A. Tyson, S. Wolff, 154–164
- Kauffmann et al. (1999) Kauffmann G., Colberg J. M., Diaferio A., White S. D. M., 1999, MNRAS, 303, 188
- Kauffmann et al. (1997) Kauffmann G., Nusser A., Steinmetz M., 1997, MNRAS, 286, 795
- Lacey & Cole (1993) Lacey C., Cole S., 1993, MNRAS, 262, 627
- Lemson & Kauffmann (1999) Lemson G., Kauffmann G., 1999, MNRAS, 302, 111
- Navarro et al. (1996) Navarro J. F., Frenk C. S., White S. D. M., 1996, ApJ, 462, 563
- Peacock & Smith (2000) Peacock J. A., Smith R. E., 2000, MNRAS, 318, 1144
- Reed et al. (2006) Reed D. S., Governato F., Quinn T., Stadel J., Lake G., 2006, MNRAS, submitted, astro-ph/0602003
- Seljak et al. (2005) Seljak U., Makarov A., McDonald P., et al., 2005, PhRvD, 71, 10, 103515
- Sheth & Tormen (2004) Sheth R. K., Tormen G., 2004, MNRAS, 350, 1385
- Skibba et al. (2006) Skibba R., Sheth R. K., Connolly A. J., Scranton R., 2006, MNRAS, submitted, astro-ph/0512463
- Spergel et al. (2003) Spergel D. N., Verde L., Peiris H. V., et al., 2003, ApJS, 148, 175
- Springel et al. (2005) Springel V., White S. D. M., Jenkins A., et al., 2005, Nature, 435, 629
- Springel et al. (2001) Springel V., White S. D. M., Tormen G., Kauffmann G., 2001, MNRAS, 328, 726
- Wechsler et al. (2002) Wechsler R. H., Bullock J. S., Primack J. R., Kravtsov A. V., Dekel A., 2002, ApJ, 568, 52
- Wechsler et al. (2006) Wechsler R. H., Zentner A. R., Bullock J. S., Kravtsov A. V., 2006, ApJ, submitted, astro-ph/0512416
- Weinmann et al. (2006) Weinmann S. M., van den Bosch F. C., Yang X., Mo H. J., Croton D. J., Moore B., 2006, astro-ph/0606458
- Yang et al. (2003) Yang X., Mo H. J., van den Bosch F. C., 2003, MNRAS, 339, 1057
- Yang et al. (2006) Yang X., Mo H. J., van den Bosch F. C., 2006, ApJL, 638, L55
- Yoo et al. (2006) Yoo J., Tinker J. L., Weinberg D. H., Zheng Z., Katz N., Davé R., 2006, ApJ, submitted, astro-ph/0511580
- Zhu et al. (2006) Zhu G., Zheng Z., Lin W. P., Jing Y. P., Kang X., Gao L., 2006, ApJL, accepted, astro-ph/0601120