X-RAY NATURE OF THE LINER NUCLEAR SOURCES
We report the results from an homogeneous analysis of the X-ray (Chandra ACIS) data available for a sample of 51 LINER galaxies selected from the catalogue by Carrillo et al. (1999) and representative of the population of bright LINER sources. The nuclear X-ray morphology has been classified attending to their nuclear compactness in the hard band (4.5–8.0 keV) into 2 categories: Active Galactic Nuclei (AGN) candidates (with a clearly identified unresolved nuclear source) and Starburst (SB) candidates (without a clear nuclear source). 60% of the total sample are classified as AGNs, with a median luminosity of , which is an order of magnitude higher than that for SB-like nuclei. The spectral fitting allows to conclude that most of the objects need a non-negligible power-law contribution. When no spectral fitting can be performed (data with low signal-to-noise ratio), the Color-Color diagrams allow us to roughly estimate physical parameters such as column density, temperature of the thermal model or spectral index for a power-law and therefore to better constrain the origin of the X-ray emission. All together the X-ray morphology, the spectra and the Color-Color diagrams allow us to conclude that a high percentage of LINER galaxies, at least 60%, could host AGN nuclei, although contributions from High Mass X-ray Binaries or Ultra-luminous X-ray sources cannot be ruled out for some galaxies.
Key Words.:
galaxies, AGN, LINER, X-ray, Chandra1 Introduction
Active Galactic Nuclei (AGN) produce enormous luminosities in extremely compact volumes. Large luminosity variations on time scales from years to hours are common (e.g. Leighly 1999). The combination of high luminosity and short variability time scales implies that the power of AGN is produced by phenomena more efficient in terms of energy release per unit mass than ordinary stellar processes (Fabian 1979).
A quantitative definition of what constitutes an active galaxy is perhaps not very useful, since galaxies showing low-level activity (e.g. Heckman 1980, Stauffer 1982, Hawley & Philips 1980) may be in a pre- or post- eruptive stage, and so may yield important clues into the origin and evolution of nuclear activity. The question of whether similar unification ideas can also apply to low-luminosity AGNs (LLAGNs), which make up the vast majority of the AGN population, has been explored (see Barth 2002). In this sense, LLAGNs might constitute a perfect laboratory to investigate the connection between galaxies in which the central black holes are active and those in which they are quiescent. However, such AGNs may be difficult to identify because of extinction (e.g. Keel 1980, Lawrence & Elvis 1982) or contamination by star forming processes in circunnuclear region (e.g. Véron et al. 1981). The number of weak AGNs increases every time deep searches are made. Heckman (1980, see also Heckman et al. 1980 and Ho et al. 1997) has shown that one third of a complete sample of ’normal’ galaxies exhibit signs of nuclear activity.
LINERs (Low-Ionization Nuclear Emission-line Regions) were originally defined as a subclass of these LLAGNs by Heckman (1980) and are characterized by optical spectra dominated by emission lines of moderate intensities arising from gas in lower ionization states than classical AGNs. LINERs where defined as galaxies whose spectra satisfy and (Heckman 1980). These LINERs typically are less luminous than powerful Seyferts and QSOs. It is still unclear whether all LINERs are essential AGNs at all, but if LINERs represent the low-luminosity end of the AGN phenomenon, they are the nearest and most common examples, and their study is genuine to understanding AGN demographics and evolution. One fundamental question that needs to be addressed is whether the nuclear emission of these galaxies results from starbursts or accretion onto super-massive black holes (SMBHs).
The low luminosity of these nuclear sources makes them difficult targets for observational studies, even in very nearby galaxies. The origin of the optical narrow emission lines of LINERs has long been a source of controversy because the optical line ratios can be reproduced reasonably well by models based on a variety of different physical mechanisms, including shock heating (Fosbury et al. 1978; Dopita & Sutherland 1996), photo-ionization by a non stellar continuum (Ferland & Netzer 1983; Halpern & Steiner 1983), photo-ionization by young starburst containing Wolf-Rayet stars (Filippenko & Halpern 1984; Terlevich & Melnick 1985; Barth & Shields 2000), or photo-ionization by hot stars (Filippenko & Terlevich 1992; Shields 1992).
One would expect that information coming from different spectral ranges could help disentangle and eventually taxonomies the LINER family. However, the study of data at different wavelengths has provoked even more discussion.
UV imaging surveys by Barth et al. (1998) and Maoz et al. (2005) (also Pogge et al. 2000) found nuclear UV emission in 25% of the LINERs that were observed. About half of them appear point-like at the resolution of HST and thus are good candidates for being genuine LLAGNs with non-stellar continua. Barth et al. (1998) showed that the low UV detection rate is primarily due to dust obscuration of the nuclei. Thus, the majority of LINERs probably have UV sources in their nuclei (which could be either AGNs or young star clusters), but in most cases the UV sources lie behind large amount of dust to render it visible. Therefore, the foreground dust plays an important role in blocking our view of the central engines.
Since the nuclei of LINERs may be very heavily obscured, observations in UV, optical, near-infrared, and even the far-infrared may not penetrate through out the dust to reach the nucleus. The most important recent data constraining the nature of LINER nuclei have come from radio and X-rays surveys because in these spectral regions it is possible to detect central engines that are completely obscured in the optical and UV. In a VLA survey, Nagar et al. (2000) found that 64% of LINER 1 and 36% of LINER 2 have compact radio cores (Nagar et al. 2005). The objects bright enough for VLBI observations at 5GHz were studied by Falcke et al. (2000, see also Filho et al. 2004); all showed compact, high-brightness-temperature cores, suggesting that an AGN rather than a starburst is responsible for the radio emission. Moreover, the core radio fluxes have been found to be variable by a factor up to a few in about half of the 10 LINERs observed multiple times over 3 years (Nagar et al. 2002). A radio survey for 1.3 cm water mega-maser emission, an indicator of dense circunnuclear molecular gas, detected LINER nuclei at the same rate as type 2 Seyfert nuclei (Braatz et al. 1997). Such mega-maser emission is seen only in AGNs. Some LINERs have indications of a Seyfert-like ionization cone oriented along their radio axis (Pogge et al. 2000).
X-ray observations provide another direct probe of the central engines. Pure starburst galaxies, at low redshift, do not exhibit unresolved hard X-ray (2.0-8.0 keV) nuclei. On the contrary, starbursts such as M82, have extended hard X-ray emission from both diffuse gas and unresolved X-ray binaries (Griffiths et al. 2000). The detection of a hard X-ray continuum, as well as Fe K emission (Iyomoto et al. 1996; Ishisaki et al. 1996; Terashima et al. 1998, 1999, 2000; Roberts, Warwick and Ohashi 1999; Jimenez-Bailon et al. 2005; Streblyanska et al. 2005) are indicators of AGN activity. Only a reduced number of X-ray observations of LINER 2s have been performed so far. X-ray observations with Einstein and ROSAT were limited to soft energies, where heavily obscured AGNs are difficult to detect. ROSAT HRI images showed compact soft X-ray () emission in 70% of LINERs and Seyfert galaxies (Roberts & Warwick 2000). Nevertheless, the lack of spectral information, low spatial resolution and inadequate bandpass of these observations cannot distinguish the thermal emission of the host galaxy from the emission from the AGN. These problems are overcame by Chandra, whose spatial resolution 10 times superior to that of the ROSAT HRI allows us to resolve the emission on lower physical sizes.
In this paper we present the homogeneous analysis of a sample of LINERs observed by Chandra and examine the probable ionization mechanism in LINERs. The paper is organized as follows. In Section 2 we summarize the Chandra and HST observations and describe the galaxy sample. Image and spectral reduction and analysis of X-ray data and HST imaging are reported in Section 3. We discuss the origin of the X-ray emission in our sample in Section 4. Finally, a summary of our findings is present in Section 5.
2 The Sample and the Data
The starting list for the sample selection has been the Multi-wavelength catalogue of LINERs (MCL) compiled by Carrillo et al. (1999). MCL includes most of the LINER galaxies known until 1999, providing information on broad band and monochromatic emission from radio frequencies to X-rays for 476 objects classified as LINERs. The initial galaxy sample was constructed by selecting in the Chandra archive all the galaxies in MCL with Advanced CCD Imaging Spectrometer (ACIS111Comprising two back-illuminated CCD chips and eight front-illuminated CCD chips of 1024 pixels square, with a plate scale of 0.”492 .) observations already public in November 2004, what yielded a set of 137 out of the 476 galaxies.
The optical classification was reanalyzed (by using the line ratios diagrams by Veilleux & Osterbrock 1987), and 15 objects were eliminated from the sample due to misclassification in MCL; 5 of them appear to be Starburst systems (NGC 1808, NGC 3077, ESO 148-IG002N, ESO 148-IG002S and NGC 253), 6 are Seyfert-like galaxies (NGC 4258, MRK 0266SW, 3C452, NGC 4565, NGC 4501 and NGC 3079) and 4 are transition objects (NGC 0224, NGC 0404, AN 0248+43B and NGC 4303). For the selected sample we have noticed that data with exposure times lower than 10 ksec had less than 25 counts in the 0.5-10.0 keV energy range. Therefore, only data with larger exposure times have been taken into account. The final sample, with high quality data and optical re-identification as LINER nuclei, amounts to 51 objects. Almost all objects (except NGC 3607, NGC 3608, NGC 3690B, NGC 4636, NGC 5746 and NGC 6251) have been observed with ACIS-S mode. The 51 galaxies were observed between August 2000 and April 2004. A list of the objects, including the details of their observations, is provided in Table 1 in which Name (Col. 1), X-ray position in right ascension and declination (Cols. 2 and 3), X-ray radii selected for the nuclear sources (Col. 4) and offset with respect to the 2MASS coordinates (Col. 5), Chandra Observational Identifier (Col. 6) and exposure time after removal of background flares (Col. 7) are given.
The data provided in Table 2 have been extracted from Carrillo et al. (1999) and include properties of the host galaxies such as: Source name (Col. 1), Redshift z (Col. 2), distances (Col. 3), spatial scale at the distance of the galaxy (Col. 4), source radii of the selected X-ray nuclear source regions (Col. 5), B magnitude (Col. 6), E(B-V) (Col. 7), and Morphological Type (Col. 8). The codes for the assumed distances correspond to those extracted from (a) Ferrarese et al. 2000; (b) assuming a cosmology with and ; (c) Tonry et al. 2001; (d) Tully 1998; and (e) Karachentsev & Drodovsky 1998.
In Fig. 1, from top to bottom, the normalized redshifts, morphological types and absolute and apparent magnitudes distributions are shown for the MCL catalogue (empty histogram) and the X-ray sample (filled histogram). On the MCL catalogue, the z distribution shows that most of the LINERs are hosted in nearby galaxies (Fig. 1a); the Hubble type histogram shows that host galaxies of LINERs are mainly normal spirals (Fig. 1b) with a median B magnitude of (Fig. 1c). It has to be noticed that whereas the redshift and absolute magnitude distributions are very similar to those of the total sample, the X-ray selected sample resides mostly in earliest Hubble type galaxies. This bias might be produced by the way in which these galaxies have been selected for observations: they are part of guaranteed and open-time programs with differing scientific goals. In Fig. 1d it can be seen the bias produced by the apparent magnitude selection. Most of the galaxies in the X-ray sample come from the bright LINER sample cataloged by Ho et al. (1997), but for some particular peculiar cases that where observed because of their interest: NGC 6240, UGC 08696 and UGC 05101 belong to the class of Ultra-luminous Infrared Galaxies (ULIRGs); CGCG 162-010 is the central cluster galaxy in Abell 1795, and NGC 0833 (Arp 318B) lies in a Hickson compact group, HCG 16. Therefore we believe that this sample can be considered representative only of the bright galaxy population but not for all the LINER population. It has to be noticed, for instance, that the sample does not include the strong IR emitters, that seem to be a large percentage of all known LINERs (Veilleux et al. 1999; Masegosa & Márquez 2003); in fact, the LINER galaxies in our X-ray sample with far IR data from the IRAS Point Source Catalogue appear to be rather faint IR emitters with an average IR luminosity of 10.
Together with Chandra X-ray data, we will make use of the high-resolution, optical information provided by HST imaging for our sample galaxies. 45 out of the total 51 galaxies have been observed with WFPC2 in several different programs, so with different filters and exposure times. The observations in the red broad filter F814W have been selected (31 galaxies), but observations in other broad filters (mainly F606W and F702W) have been used otherwise. The summary of the selected data is given in Cols. 8, 9 and 10 in Table 1, including filter, proposal identifier and exposure time of the archival data. In Section 3.2 the analysis of HST data is described.
3 Data Reduction and Analysis
3.1 X-ray Data
Level 2 event data from ACIS instrument have been extracted from Chandra archive. The data products were analyzed in an uniform, self-consistent manner using CXC Chandra Interactive Analysis of Observations (CIAO222See http://asc.harvard.edu/ciao) software version 3.1. The spectral analysis was performed with XSPEC333See http://cxc.heasarc.gsfc.nasa.gov/docs/xanadu/xspec/ (version 11.3.2). Background ”flares” (periods of enhanced count rate) can seriously affect the scientific value of an observation, increasing the count rate by a factor of up to 100. These ”flares” are due to low-energy protons interacting with the detector. Such flares have been observed anywhere in the orbit, including near the apogee, consequently there are not due to Van Allen belt effect. Images could be dominated by the background if time intervals affected by flares are not excluded. The exposure time was therefore processed to exclude background flares, using the task lc_clean.sl444see http://cxc.harvard.edu/ciao/download/scripts/ in source-free sky regions of the same observation. For all observations (except NGC 4486, excluded in the spectral analysis) the nuclear counts were insufficient for photon pile-up to be significant.
3.1.1 Spectral Analysis
To discriminate what emission mechanisms are involved in these objects and to estimate the X-ray luminosity a careful analysis of the spectra, based on model fittings, has been performed. X-ray luminosities in the hard band (2.0–10.0 keV) can be otherwise estimated following Ho et al. (2001), who assume a power law with a spectral index of 1.8 for the SED. Since most of our objects show a clear compact nuclear source, suggestive of AGN nature, large departures from a power-law index 1.8 are not expected (see Terashima 1999). Nevertheless, this approach has been shown to be too simplistic in some cases (i.e. NGC 3077, Ott et al. 2003), hence our attempt to calculate luminosities via the spectral fitting.
To extract the nuclear spectra, we first determined the position of the nuclear sources as cataloged by near-IR observations from the Two Micron All Sky Survey (2MASS) (see Fig. 2). NGC 4636 and NGC 4676B have not been found in the near-IR catalog, so their positions from NED have been taken as reference.
Nuclear spectra were extracted from a circular region centred in the object using regions defined to include as many of the source photons as possible, but at the same time minimizing contamination from nearby sources and background. In order to determine appropriate source extraction, the radius of each source aperture on the detector was estimated as follows: (1) 4–6 pixels for a single source, (2) 3–4 pixels for objects with few knots close to the nucleus to exclude nearby sources, and (3) 6 pixels for sources dominated by diffuse emission, since a good S/N is required for extracting the spectra. Positions from near-IR in 48 out of the 49 objects with 2MASS coordinates have been found to agree with the X-ray nuclear position within the X-ray radii of the sources, consistent with the astrometry accuracy provided by these data. The offset for NGC 4696 is 7.5”, about the double of the size of the nuclear extraction, but NGC 4696 presents a complex morphology with a number of knots embedded in strong diffuse emission in the hard and soft X-ray energies, making the identification of the nuclear source ambiguous. X-ray radii and offsets are included in Col. 4 and 5 in Table 1. The spatial regions sampled by the nuclear extractions generally cover the innermost 500 pc, but in a few cases (7) they are larger than 1 kpc (see column 5 in Table 2); nevertheless, the number of these more distant objects is evenly distributed between AGN and SB candidates (see below) and therefore no bias in the results is expected due to this effect.
The background region is defined either by a source-free circular annulus closed to the nuclei (cases (1) and (3)), or by several circles around the sources (case (2)), in order both to take into account the spatial variations of the diffuse emission and to minimize effects related to the spatial variation of the CCD response. For each source, we extracted spectra from each of the datasets. Response and ancillary response files were created using the CIAO mkacisrmf and mkwarf tools.
The spectra were fitted using XSPEC v.11.3.2. To be able to use the as the fit statistics, the spectra were binned to give a minimum of 20 counts per spectral bin before background subtraction. The task grppha included in FTOOLS software has been used for this purpose. 23 of the 51 objects in our sample fulfill this criterion (hereafter the Spectral Fitting (SF) subsample). In the spectral fitting we have excluded any events with energies above 10 keV or below 0.5 keV.
Since our aim is to try to disentangle whether the emission mechanism might be due to an AGN or to star formation, two models have been used: a single power-law and a single-temperature optically-thin plasma emission (MEKAL or Raymond Smith (Raymond & Smith 1977) model. For each object five models have been attempted: (1) Power-Law (PL), (2) Raymond-Smith (RS), (3) MEKAL (ME), (4) PL+RS and (5) PL+ME. The power-law plus thermal combinations (models 4 and 5) have been taken into account to include the possibility that the two emission mechanisms are relevant. We do not expect large differences between MEKAL and Raymond-Smith models. Furthermore, we have included a photoelectric absorption law (called ’phabs’ in XSPEC software) to fit the absorbers in the line of sight with a cross section called ’bcmc’ by Balucinska-Church & McCammon (1992). To decide which is the best fit model for each nuclear source we have selected the model that gives reduced closer to 1. The results from the spectral fittings for the five models are given in Table 3, where Col. 1 indicates the name; Col. 2 gives the model Col. 3, 4 and 5 include the column density, spectral index and temperature; and the over the degrees of freedom (d.o.f) is indicated in Col. 6. The best model has been chosen as that with the best -reduced statistic. When a combination of power-law plus thermal model is the best model, we have used ftest task to determine whether the inclusion of an additional component is needed or a single thermal or power-law model could be a good fit for the spectrum. The selected model for each case has been indicated by an asterisk in Column 2.
NGC 6240 has been selected as a model example of the process since the number counts for this source guarantee that the errors in the fitting due to S/N are minimal. The resulting parameters for the different fittings of NGC 6240 are shown in Table 3. The best fit model is a combination PL+RS (Fig. 3, top) with the best -reduced statistic (Fig. 3, bottom). The soft X-ray spectrum (below 2 keV) shows clear signatures of thermal emission well described by a optically thin plasma, which probably originates in a powerful starburst. Strong hard X-ray emission is also detected and its spectrum above 3 keV is extremely flat.
NGC 4261 has not been included in the SF subsample due to its spectral complexity that results in unphysical parameters for any of our five models. The fits are statistically acceptable for all the remaining objects () except in NGC 2681 () and NGC 7130 (). The resulting fittings are plotted in Fig. 3 in the electronic edition for the whole SF subsample.

Only for NGC 6482 the single thermal model provided a statistically acceptable fit (). Therefore, in 22 of 23 objects the power-law component is needed to describe the hard energy spectra observed, indicating a non-negligible non-thermal contribution in our sample. Seven objects are described with a single power-law (NGC 3690B, NGC 4374, NGC 4395, NGC 4410A, NGC 5494, NGC 4696, NGC 5746). Although a combination of thermal plus power law model gives smaller for NGC 3690B, NGC 4410B and NGC 5746, the thermal component is not needed to describe their spectra according to the ftest tool. Furthermore, the same spectral indices are found, including error bars, assuming a single power-law or a combination with a thermal model (see Table 3). Nevertheless, in 15 out of 22 objects strong residuals remained at low energies indicating that a single power-law model was not completely satisfactory. In these cases, a significant improvement was achieved when a power-law plus optically thin emission was considered, according to the ftest tool.
It has to be noticed that ME+PL and RS+PL with solar metallicity give the same fitted parameters within the error.
Table 4 gives the mean (Col. 1), median (Col. 2) and mean standard deviation (Col. 3) for the logarithm of the 2-10 keV band luminosity, column density, temperature and spectral index (the first row for each entry). Galactic absorptions can be derived from the HI map (Dickey & Lockman 1990) using the nh tool provided by the HEASARC. The SF sample of LINERs with enough counts to constrain absorption, showed column densities exceeding the expected from HI map, ranging between (0.01-2.87), with a mean value of . Therefore it is very likely that LINERs generally are much more absorbed than the Galactic value indicated. The mean temperature from the SF subsample is kT=0.640.17 keV while the mean spectral index is =1.890.45. The spectral fits provide 2.0-10.0 keV unabsorbed luminosities for the SF subsample expanding a large range between and with a mean value of .
In order to get a luminosity estimation of the whole sample, we have obtained a count rate to flux conversion factor between 2.0–10.0 keV, assuming a power-law model with spectral index of 1.8 and the Galactic interstellar absorption (). In Fig. 4 the estimated 2.0–10.0 keV luminosity of the SF subsample is plotted () against the value obtained from the direct integration of the spectra (). The luminosities are well correlated, always less than a factor of 3 within the real luminosity. Monte Carlo simulations have granted a confidence of the proposed calibration at 95% level. We have therefore inferred a self-consistent estimate of the 2.0–10.0 keV luminosities for the whole sample, using the SED fitting for the SF subsample and from this calibration otherwise. In Table 5 we list the 2–10 keV fluxes (Col. 2) and unabsorbed luminosities (Col. 3) of the nuclear sources for the whole sample, using the empirical calibration (denoted by ‘e’ in Col. 4) or the spectral fitting (denoted by ‘f’ in Col. 4). In the cases where the flux and luminosity have been obtained from the spectral fitting the estimated errors are also included.
3.1.2 Image Analysis
In order to gain insight into the emission mechanisms in the whole sample we studied the X-ray morphology of the sources in six energy bands: 0.6–0.9, 0.9–1.2, 1.2–1.6, 1.6–2.0, 2.0–4.5, and 4.5–8.0 keV. The bands were chosen in order to maximize the detection as well as to obtain a good characterization of the spectra, as it is illustrated in the next Section. In the last energy band (4.5–8.0 keV), the range from 6.0 to 7.0 keV has been excluded to avoid the possible contamination due to the FeK emission line (the corresponding band will be called (4.5–8.0)∗ hereafter). The most common emission features in the 2-10 keV band of AGN spectra are those of iron between 6.4–6.97 keV (depending on the ionization state of Fe), related with the reflexion in the accretion disk. Only 5 objects (NGC 5194, UGC 08696, NGC 6240, NGC 7130 and UGC 05101) have a point like source after continuum extraction. Although UGC 08696 shows a compact nuclear source in this energy band it can not be directly associated with a FeK line because it has a broad high energy component (See Appendix of UGC 08696 for details).
The images were adaptively smoothed (the smoothing depends on the count rate of the pixel vicinity) with the CIAO task csmooth, using a fast Fourier transform algorithm and a minimum and maximum significance signal-to-noise ratio (S/N) level of 3 and 5, respectively. Smoothing algorithms are useful when the count-rate of the diffuse emission is closed to the background level. Adaptively smoothed images were not used for any quantitative analysis, but only for a morphological classification. The images in the four bands 0.6–0.9, 1.6–2.0, 4.5–8.0∗ and 6–7 keV are given in Fig. 5 (for all the galaxies see the electronic edition).
Since we focus our attention in the nuclear sources, no attempt has been made to fully characterize the flux and the spectral properties (when possible) of the extra-nuclear sources, whose study is out of the scope of the paper. As a first insight into the nature of LINERs we have taken the existence of an unresolved compact nuclear source in the hard band (4.5–8.0 keV) as evidence for an AGN. Of course, detection of broad emission lines at multi-wavelength observations will be needed to asses their nature. The sample has been grouped into 2 categories:
-
•
AGN candidates: We include all the galaxies with a clearly identified unresolved nuclear source in the hard band (4.5–8.0)* keV. In Fig. 5a we show NGC 4594, as an example of AGN candidate, where there exists a clear point-like source in the hardest band (centre-left). 59% (30/51) of our sample galaxies have been classified as AGN-like nuclei; the median luminosity is , whereas it is for the whole sample (Fig. 6).
-
•
Starburst candidates: Here we include all the objects without a clearly identifiable nuclear source in the hard band. In Fig. 5b we show the images of CGCG 162-010 as an example of these systems. Note that there does not appear to be a nuclear source in the hardest energy band (centre-left). 41% (21/51) of the sample of LINERs falls into this category. The median luminosity is (Fig. 6).
(a) NGC 4594
(b) CGCG 162-010
The classification of each object is included in Col. 6 in Table 5. The histogram of the derived X-ray luminosities for the two groups are presented in Fig. 6. The median luminosity is higher for AGN like nuclei ( 10 times) but there exists a clear overlap in the range (). We do not find clearcut difference in luminosities between AGN and SB candidates.
With respect to the SF subsample (see Table 4), the spectral index and its standard deviation in AGN-like (18/23) is and the temperature is keV. In the SF subsample 5 objects have been classified as SB-like nuclei (namely, NGC 4438, NGC 4696, CGCG 162-010, NGC 5846 and NGC 6482). Excepting NGC 6482, fitted with a single thermal model, all the objects have been fitted including a power-law component. The origin of this power-law contribution coming from the presence of an AGN, remains therefore as an open possibility for our sample objects. A full discussion at this respect is made in Section 4 and in the Appendix for individual sources.
3.1.3 Color-Color Diagrams
We have explored the possibility of using X-ray colors to obtain information about the emission mechanism in these objects. Previous works have explored this possibility in an AGN sample (Ceballos & Barcons 1996), X-ray surveys of galaxies (Hasinger et al. 2001), X-ray source populations in galaxies (Grimm et al. 2005; Heinke et al. 2005) or diffuse emission in star-forming galaxies (Strickland et al. 2004). We have built color-color diagrams , using different hardness ratios of the form Qi = (Hi-Si)/(Hi+Si) (i = A, B, C), with the same bands used for imaging classification: SA=0.6-0.9 keV, HA=0.9-1.2 keV (), SB=1.2-1.6 keV, HB=1.6-2.0 keV (), and SC=2.0-4.5 keV, HC=(4.5-8.0)∗ keV (). These six bands defining three hardness ratios were selected after verifying that they are specially well suited to maximize the differences between a thermal plasma model and emission in the form of a power-law; while at the low energy range (below 2 keV), the thermal contribution becomes more significant, at higher energy ranges a relatively larger flux is expected whenever the power-law contribution is needed. The use of the same bands as for the imaging analysis allows a direct quantification of the properties of the nuclear sources used for morphological classification.
Counts were extracted directly from the source and background event files described for the spectral extraction. Error bars were computed as one standard deviation in the count rates. Hardness ratios were calculated for all the bands in which the measured error in the count rates were less than 80%.
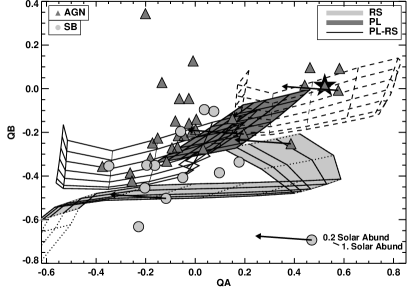
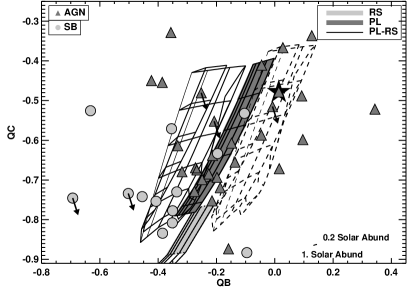
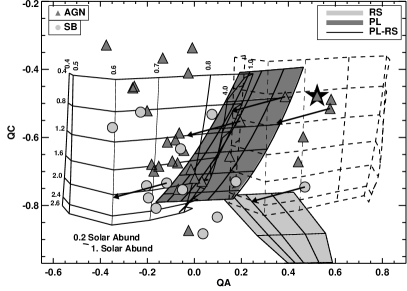
In Fig. 7 we plot versus (top), versus (centre), and versus (bottom). To compare the observed X-ray colors of the sources with different spectral shapes, we have computed the colors of pure power-law (dark grey grid), Raymond Smith model (light grey grid) and a combination of both models (empty grid). In both models, photoelectric absorption by cold gas was included. For each column density () and model parameter ( or kT) pair, XSPEC generate a model spectrum that was then multiplied by the effective area at each energy (obtained from the response matrices for the actual data) and sampled appropriately. The output was thus a model of the number of photons detected per second as a function of energy, which could be compared with the observations. These simulated data were then used to calculate the hardness ratio of ACIS-S observations as a function of and/or kT. Grids of points were determined for parameters and kT = 0.1–4.0 keV for the power-law (Fig. 7 dark grey grid) and Raymond Smith (Fig. 7 light grey grid) models, respectively, and for in the single models. Several grids have been computed in the combination model with , with 50% of contribution from both models at 1 keV. Note that variation in the column density in the combination model result in a shifting of the grid up and right, with higher values at low energies (Fig. 7 empty grid). This effect is smaller for low , but it is quite noticeable for higher column densities ( cm-2). In Fig. 7, two combination models are given as empty grids for N cm-2 (left) and cm-2 (right, indicated with dashed lines), respectively. Therefore, these grids could help to disentangle whether these objects are strongly obscured. For less energetic colors, both absorption effects and thermal contribution become more important, thus both column density and temperature could be better estimated. The highest energetic color () is better suited to estimate the power-law contribution. Note that the grid of models have been computed for ACIS-S observations but for the objects observed with ACIS-I (namely, NGC 3608, NGC 3690B, NGC 4636, NGC 5746 and NGC 6251) an arrow has been included to represent the correction to be done to take into account the different sensitivities. This correction is important at low energies (i.e. ) where the different sensitivity of both instruments become more important. The parameters have been estimated with this correction.
It has to be noticed that, although our grid of models has been computed for solar abundances, the variation between solar abundance and 0.2 bellow solar abundance is always smaller than other effects (see Fig. 7).
In Fig. 7 we plot versus (top), versus (centre) and versus (bottom) for the subset of 42 sources for which the three values are available. The resulting , and values are given in Table 7. SB-like nuclei are plotted as dark grey circles and AGN-like nuclei as light grey triangles in these diagrams.
The reliability of this hardness ratio diagrams can be tested by comparing their results with those given by the more conventional method of fitting models to the observed spectra. For this comparison, we used first the bright source NGC 6240 (black star in Fig. 7), since we have determined the spectral parameters from the spectral fitting with high reliability. Considering the error bars, the spectral index estimated from color diagrams is = [0.8-1.0], the temperature is kT = 0.7-0.8 keV and the column density may be high (N). From the spectral fitting parameters we have obtained , kT = keV and , well within the range of values provided by the estimation from the color-color diagrams.
The method has then been tested with the SF subsample. The parameters estimated from color-color diagrams are included in Table 6, where the name is shown in Col. 1; SB/AGN classification is shown in Col. 2; the chosen model is included in Col. 3 for the objects in the SF subsample, the absorbed column density from the fitted spectra (Col. 4) or color-color diagram estimation (Col. 5); as well as power-law index (Cols. 6 and 7); and temperature (Cols. 8 and 9). Note that the column density estimation from color-color diagrams has been included as “” only those cases where color-color diagrams provide a clear indication of high obscuration.


Seventeen objects (12 SB-like and 5 AGN candidates) do not have any estimation from the color-color diagrams. 9 of them have large errors in the highest energy band, and consequently is not reliable enough. The remaining 8 objects (ARP 318B, NGC 1052, NGC 4395, NGC 4494, MRK 266NE, UGC 08696, NGC 5866 and NGC 6482) fall out from at least two of the three color-color diagrams: NGC 1052, MRK 0266NE and UGC 08696 have a too high value for (), most probably due to the contamination of jet-related X-ray emission (see Appendix on the individual sources). ARP 318B, NGC 4494 and NGC 6482 are out of the grid because of low values of ; NGC 6482 is the only galaxy resulting to be best fitted by a single thermal component, and its position in the color-color diagrams is indeed closer to the thermal model. The situation for the other two galaxies, NGC 4395 and NGC 5866, is however less clear.
Fig. 8 (top) shows the comparison of the temperature obtained from the spectral fitting with that estimated from color-color diagrams. Excepting NGC 0315, NGC 6251 and IC 1459 that show temperatures estimated from color-color diagrams much higher than the fitted ones, it can be concluded that color-color diagrams provide a good temperature estimation. NGC 0315 has been fitted by Donato et al. (2004) with kT=0.51 keV, much closer to our estimated temperature. Considering the extended structure and the jet-like emission in this galaxy, differences in the background subtraction methods may explain such a discrepancy. Note that NGC 6251 and IC 1459 are the only galaxies for which PLRS and PLMEKAL fitting provide very different values of kT; even if PLMEKAL model is selected in these cases, the statistical estimator is not so sharp and, if a PLRS is considered, the resulting temperatures are in good agreement with the estimated ones.
Fig. 8 (bottom) shows the spectral index correlation between the values from the spectral fitting versus those estimated from color-color diagrams. The spectral indices estimated from the color-color diagrams result to be somewhat underestimated, but within less than 40% of the fitted values, excepting for NGC 5194 and NGC 7130, for which the fitted values are rather unrealistic.
All the estimated column densities corresponds with the fitted ones.
Therefore, it seems reasonable to conclude that the information provided by color-color diagrams can be used as a rough estimate of the physical parameters describing the X-ray SED of our targets, this method being specially valuable for the objects where no spectral fitting can be made.
For the whole sample, the main general conclusion from the diagrams in Fig. 7 is that the spectra of LINERs cannot be described in general by a single power-law. At least two components are needed: a hard power-law and a soft component represented by a thermal model. We find that the best fit MEKAL model for a soft component in most of LINER galaxies has kT between 0.6-0.8 keV and it appears quite clearly that an AGN power-law component may be needed for most of them, since values are in general too high for a thermal emission. In particular, AGN-like nuclei show systematically high values; SB-like nuclei mostly fall in the power-law region as well. This result further emphasizes that the AGN contribution in our sample of LINER galaxies might be rather important.
3.2 HST-imaging analysis
To gain some insight into the nature of the X-ray emission, especially for the LINERs without a detected compact component, we have searched for the optical counterpart of the X-ray compact sources. The high spatial resolution provided by HST observations is needed for our purposes. In order not to make our analysis dependent on the model used for describing the underlying host galaxy, we have decided to remove such a contribution by applying the sharp-dividing method to the original HST images. This technique has been proved to be very well suited to remove large-scale galactic components and therefore is a very convenient way to look for subtle, small-scale variations and discuss the possible presence of both dust extinguished and more luminous regions (Sofue et al. 1994; Márquez & Moles 1996; Márquez et al. 2003 and references therein; Erwin & Sparke 1999; Laine et al. 1999). It consists on applying a filtering to the original image, with a box size several times that of the PSF FWHM, and then dividing the original image by the filtered one. The resulting so-called sharp-divided images are plotted in Fig.5 (bottom-right). We note that absolute astrometry has been performed by using the position of the coordinates of those objects in the images cataloged by USNO, excepting NGC 4410, NGC 4596 and NGC 4696 for with the position of the central galaxy had to be taken from the RC3 catalogue due to the lack of reference stars.
According to the appearance of the central regions, two main groups can be distinguished: (a) galaxies with compact nuclear sources, when a knot coincident with the central X-ray source is detected in the sharp-divided image (see for instance Fig. 5 for NGC4552) (C in Column 7, Table 5); 35 objects fall into this category; and (b) galaxies with dusty nuclear regions, when dust-lanes like features are seen but no central knot is detected (see for instance Fig. 5 for NGC4438) (D in Column 7, in Table 5) with 8 objects belonging to this class. Two galaxies, namely NGC 3608 and NGC 4636, cannot be classified because of saturation or rather low S/N.
4 Discussion
According to their X-ray morphologies in the hard band (4.5-8∗ keV), the LINER galaxies in our sample have been classified into two broad main categories. We have defined AGN-like nuclei as those objects displaying a hard nuclear point source, coincident with 2MASS position of the nucleus. Of the 51 galaxies in the LINER sample, 30 meet this criterion (59%). We called SB candidates those lacking a hard nuclear source because either 1) they lack an energetically significant AGN or 2) contain highly obscured AGN with column densities larger than . Ho et al. (2001) classified the X ray morphology into four categories: class (I) objects exhibit a dominant hard nuclear point source (2-10 keV); class (II) objects exhibit multiple hard off-nuclear point sources of comparable brightness to the nuclear source; class (III) objects reveal a hard nuclear point source embedded in soft diffuse emission; and class (IV) objects display no nuclear source. Dudik et al. (2005) analyzed a sample of IR-Bright LINERs and classified the objects following the same scheme. Considering that we can assimilate classes (I) and (III) into our group of AGN-candidates and that their class (II) is equivalent to our SB candidates, they obtained similar percentages of AGN-like objects since 51% (28/55) of their LINERs fall into classes (I) and (III), and 13% (7/55) were classified as belonging to class (IV). A detailed comparison for the 18 galaxies in common show that 15 objects share the same classification. The odd classification for the remaining three nuclei (NGC 3628, NGC 4696 and CGCG 162-010) can be attributed to our use of a harder X-ray band for the detection of unresolved nuclear sources.
As seen in Fig. 6, the 2-10 keV luminosities of the AGN-like in our LINER sample range from to , while SB-like luminosities range from to , both classifications overlapping in the range to . The 2-10 keV X-ray luminosities were calculated fitting the SED between 0.5-10 keV in the SF subsample, and assuming a generic power-law model with photon index and the Galactic absorption otherwise. A similar method was proposed by Ho et al. (2001) who use an empirical estimate from the count rates. Satyapal et al. (2005), by using Ho estimate of the luminosity, have found for the AGN LINERs a range in luminosities from to . For the 31 objects in common, the resulting luminosities agree within the errors but for 3 objects. The differences can be attributed to the presence of bright FeK lines in the spectra of NGC 5194 and NGC 6240; this is clearly the case for NGC 6240, with the highest luminosity they derive (Vignati et al. 1999 obtain once the FeK line contribution is included in the fit as a gaussian component). For NGC 3245 the luminosity we estimate is very much fainter that the one given by them; we however stress that our estimation is in very good agreement with that by Filho et al. (2004) (see Appendix).
We have found that LINER X-ray SED can be interpreted as a combination of a soft thermal component with temperatures of about 0.6-0.8 keV, maybe due to circunnuclear star formation, and a hard power-law produced by an obscured AGN. Regarding the soft component, Ptak et al. (1999) based on ASCA data found that similar models apply to starbursts usually showing a temperature greater than 0.6 keV. This result is confirmed with Chandra observations for starburst galaxies by Ott et al. (2005) and Grimes et al. (2005), while Teng et al. (2005) found that the best fit MEKAL model for the soft component in Seyfert 1 galaxies has kT 0.25 keV. They discussed that the low temperatures of the Seyfert 1 galaxies suggest that starburst activity may not be the dominant energy source of the soft component. The same conclusion was drawn by Boller et al. (2002) for F01572+0009. LINER nuclei have similar values than we expect in starbursts, indicating that star formation activity may be the dominant energy source of the soft component. Except in 2 objects (NGC 0315 and IC 1459), the temperature obtained from the spectral fit is about 0.6 keV, therefore hinting that a starburst component can be inferred in most cases. The spectral index in the sample galaxies for which the power-law component is needed to fit spectra (22 objects), range from 1.0 till 4.3 with a mean value of 1.9 (see Table 4 for detailed analysis). In 3 out of 22 objects (NGC 4494, NGC 5746 and NGC 6240) the slope tend to be significantly flatter () than what is typically observed in AGNs. Ptak et al. (2003) explain this flattening in a Compton thick scenario as due to a combination of reflection from optically thick central material, scattering from optically thin (unlikely highly ionized) material and leakage of X-ray through patches in the obscuring material. Nevertheless, we recall that simple models have been used to test the need of power-law and/or thermal components to fit these spectra and some artifacts may be consequently produced for more complex situations where the presence of several components is absolutely needed to explain the spectral features.
Our sample can be compared to X-ray observations of nearby Seyfert 2 galaxies. In the recent survey of nearby Seyfert galaxies taken from the compilation by Ho et al. (1997), Cappi et al. (2006) analyze Chandra data for 27 Seyfert 1 and 2 galaxies (mainly Seyfert 2), obtaining values for the power-law index of 1.56 for type 1 Seyfert and 1.61 for type 2, which are not too far from our quoted median value for LINERs (1.75 0.45). Their most remarkable result is that the range of column densities they find for Seyferts is quite similar to what we find for LINERs, with NH between 1020 and 10. Finally, when a thermal component is needed (in 15 out of the 27 galaxies), kT is found in the range between 0.2-0.8 keV, as it is the case for our LINERs, although their spectral fitting technique is quite different from ours: they fit the spectra between 2-10 keV by a single power-law and then a thermal component is added to the cases where the extrapolation from the power-law to lower energies (below 2 keV) results in a soft excess. The mean value for their (2-10 keV) luminosities (1039.8 ergs s-1 for Seyfert 2 and 1041 ergs s-1 for Seyfert 1) is also in good agreement with our estimated mean value (1040.16 erg s-1). These results are at variance with those obtained by Guainazzi et al. (2005), whith luminosities larger than 1041 ergs s-1 for a sample of 49 Seyfert 2. Note however that their galaxies are more heavily obscured than those in the analysis by Cappi et al. On the other hand, the spectral indices are fully consitent with those reported by Mateos et al. (2005) and Gallo et al. (2006) for galaxies at larger redshifts. Note that, even if their galaxies are more luminous more obscured objects, they obtain values varying between 1.7 for AGN type 1 and 1.9 for type 2 AGNs. Hence the conclusion from this comparison is that it is not clear whether LINERs in the X-ray represent a lower scaled version of AGN activity. For a more definitive conclusion a full, homogeneous analysis using the same methodology and similar selection criteria is therefore needed. At this respect, we have collected archival X-ray data for a sample of Seyfert galaxies that will be studied with the same methods we have used for LINERs, and their analysis will be the subject of a forthcoming paper.
To gain some insight into the nature of the X-ray emission, especially for the LINERs without a detected compact component, we have searched for the optical counterpart of the X-ray compact sources. We note that all the galaxies classified as AGN by their X-ray imaging show compact nuclei (28 galaxies). Among those showing SB X-ray morphology (17 objects) 8 galaxies (NGC 3507, NGC 3607, NGC 4438, NGC 4676A, NGC 4676B, NGC 4698, CGCG 162-010 and NGC 5846) show dusty nuclear sources; 5 out of 8 showing low column densities and 3 (NGC 3507, NGC 3607, NGC 4676B) without estimated column density. The remaining 7 galaxies classified as SB candidates host nevertheless compact nuclear sources in the optical counterpart (namely NGC 3245, NGC 3379, NGC 4314, NGC 4459, NGC 4596, NGC 4696 and NGC 7331). NGC 3608 and NGC 4636 remain unclassified. We stress that NGC 4696 is obscured at X-rays (as some of the object in Chiaberge et al. 2005) so in this case the AGN would be only visible in the optical, i.e., a low optical extinction has to be coupled with a relatively high X-ray column density; this kind of situation might be explained by, e.g., unusual dust-to-gas ratios (Granato et al. 1997) or by the properties of the dust grains (Maiolino 2001). Moreover in NGC 4696 a broad balmer H line was detected by Ho et al. (1997). NGC 3245 shows also evidences of its AGN nature from the optical, with double-peaked H and [NII] profiles indicative of the presence of spatially unresolved rapid rotation near the nucleus (Barth et al. 2001) and the radio frequencies, where an unresolved nuclear radio source is detected (Wrobel & Heeschen 1991). Unresolved nuclear radio cores have been also found for NGC 7331 (Cowan et al. 1994) and NGC 4314 (Chiaberge et al 2005). For NGC 4596 Sarzi et al. (2001) has determined a Black Hole Mass of 7.8 x 10⁷ M from an STIS kinematic analysis of the source. Thus it appears that even in the cases we have called SB candidates, the existence of a mini or an obscured AGN cannot be completely ruled out, since the region mapped by these observations may correspond to distances to the centre less closer to the AGN, who may be much more obscured; they would map regions much further out instead, what would explain that thermal mechanisms most probably due to star-forming processes seem to be the dominant energy source in these systems (Rinn et al. 2005).
However the unambiguous determination of the presence of an AGN needs of a detailed study of the individual sources, to discard the eventual mechanisms producing unresolved hard X-ray nuclear morphologies originated in star forming processes. Eracleous et al. (2002) argues favoring the SB nature of NGC 4736 (see Apendix). In particular the contribution of high mass X-ray binaries (HMXBs) and ultra-luminous X-ray sources (ULXs)555See Fabbiano 2005 for a review on the different X-ray source populations in galaxies. needs to be estimated, since they are expected to dominate the emission of star forming galaxies (see for instance the data for the Antennae by Zezas & Fabbiano 2002). The high X-ray luminosity found for an ULX in the star forming galaxy NGC 7714 (Soria and Motch 2004), amounting to 6 1040 erg s-1, evidences how important the contamination produced by such objects may be if they are found at nuclear positions, making this analysis extremely difficult and implying that only indirect evidences can be invoked. Hence we should keep in mind that contribution from ULXs cannot be discarded out.
Stellar population synthesis will help to investigate the relevance of the contribution from HMXBs since they are short lived (106-7 years). Data on population synthesis exist for 14 out of the 51 galaxies by Cid Fernandes et al. (2004) and González-Delgado et al. (2004). Only in one galaxy, NGC 3507, a large contribution of a young population of an age 108 years ( 27%) does exist. For the remain galaxies the contribution is always lower than 3%. Then it is not clear that HMXBs may be an important ingredient on the nuclear X-ray emission. It has to be noticed that the mapped region of the optical data (1.5”) is quite the same as that used in our X-ray analysis.
Data at radio frequencies are also crucial to understand the AGN character of LINERs. An unresolved nuclear radio core and flat continuum spectra have been taken as the best evidence for their AGN nature (see Nagar et al. 2005, Filho et al. 2004 for a full discussion). 33 out of the 51 objects have been observed at radio-frequencies (Filho et al. 2000, 2002, 2004, Nagar et al. 2000, 2002, 2005, Falcke et al. 2000). From these 33 objects 16 galaxies seems to be detected with good confidence, but only upper limits can be given for 17 objects. 3 out of the 16 radio detected (NGC 3628, NGC 4636 and NGC 5846) show radio steep spectrum which can be taken as evidence of their Starburst nature. The remaining 13 galaxies show AGN nature according to radio diagnosis; 9 of them show X-ray AGN morphology and 4 have an SB classification (NGC 3245, NGC 4459, NGC 5866 and NGC 7331). In principle, compact radio cores should appear as compact sources at X-ray frequencies unless the X-ray nucleus is obscured due to large amounts of dust; nevertheless, it does not seem to be the case for these 4 SB galaxies with compact radio cores since they do not appear to have large column densities. Thus the reason for the discrepancy needs to be found. For NGC 3245 and NGC 4459 the AGN radio classification was made by Filho et al. (2004) on compactness arguments based on 5 arcsecons resolution radio imaging, so much better resolution data are needed. NGC 7331 needs also better data due to the marginal nuclear source identification. The only clear radio-AGN is NGC 5866. A closer inspection of this source (see our Figure 5) shows that a weak nuclear source can be identified in the hard band. Then we should conclude based on the available data that AGN radio cores appear as AGN-like systems at X-ray frequencies.
¿From the precedent analysis it is clear that a multi-frequency approach is needed to get insight into the AGN nature of these galaxies, but since most of the hard emission between 4.5-8 keV is coming from an unresolved nuclear source, the natural explanation seems to be that the X-ray unresolved nuclear source is due to a low luminosity AGN. Low luminosity AGNs in the nucleus of early type galaxies being quiescent at optical or UV frequencies have been invoked by Soria et al (2006a and b) due to the existence of Supermasive Black Holes (SMBH) in the nucleus of these galaxies and in their X-ray properties. Therefore since for most of the LINERs a SMBH has been detected (Satyapal et al. 2005) the AGN nature of the X-ray emission seems to be appropriate.
5 Conclusions
The primary goal of our study was to determine the X-ray nuclear characteristics of a statistically significant sample of LINERs which were selected based on their optical emission properties (Veilleux and Osterbrock 1987). Archival Chandra ACIS data have been used to study the nature of our sample, with the aim of analyzing whether the observed X-ray emission is consistent with AGN powered and whether star forming emission can be ruled out in our sample or not. We have first classified the nuclear morphology, according to the compactness in the hard band, as AGN candidates whenever a clearly identified unresolved nuclear source is found in the 4.5 to 8.0 keV band and as SB candidates otherwise. Color-color diagrams for the whole sample and the spectral analysis for the SF subsample lead to the following conclusions:
-
1.
Morphologically, 30 out of 51 of LINERs have been classified as AGN-like candidates.
-
2.
Thermal plus power-law model with a median temperature of 0.6 keV (0.6-0.9 keV from color-color diagrams) and median spectral index of 1.9 (1.4-1.7 from color-color diagrams), better reproduces the X-ray energy distribution. This indicates a non-negligible contribution of a non-thermal component in our sample.
-
3.
Luminosities in the energy band 2-10 keV span a large range between and with a mean value of . For the two groups separately, AGN candidates range between and while SB candidates range between and . The broad overlap in X-ray luminosities indicates that this parameter can not be used to discriminate between AGN and SB candidates in LINERs.
-
4.
We stress that color-color diagrams are a valid tool to roughly estimate the values of the physical parameters used in the models for the spectral fitting, providing important clues on the amount of nuclear absorption. Their use is especially interesting when the spectral fitting is not possible.
-
5.
The estimated column densities from either the spectral analysis or color-color diagrams show that it is very likely that LINERs are generally significantly obscured, especially in SB candidates. This results is consistent with the hypothesis that they may host an obscured AGN.
-
6.
All the galaxies classified as AGN by the X-ray imaging show compact nuclei at the resolution of HST images. 8 out of 14 galaxies showing SB X-ray morphology have dusty nuclear sources, indicating that the objects can be dust obscured, in agreement with the X-ray analysis.
These new data offer some insight on the long standing dispute about the nature of the ionizing source in LINER. Although contributions from HMXBs and ULXs can not be ruled out for some galaxies, we can conclude that for a high percentage of LINERs, 59% at most, an AGN does exist in their nuclei. For the remaining 41%, their existence cannot be discarded based on the available data. Diagnostics at other wavelengths have to be explored in order to determine the possible contribution of an embedded AGN. Future papers will be devoted to study whether a link exists in objects with higher activity levels by comparing the properties of our AGN-like LINER nuclei with those of a sample of Seyfert nuclei.
Acknowledgements.
This work has been financed by DGICyT grants AYA2003-00128 and the Junta de Andalucía TIC114. OGM acknowledges the financial support by the Ministerio de Educación y Ciencia through the spanish grant FPI BES-2004-5044. MAG is supported by the Spanish National program Ramón y Cajal. We thank X. Barcons and E. Jimenez-Bailon for helpful comments, D.W. Kim for useful advices in data reduction and J. Cabrera for providing us with the Monte Carlo simulations. This work benefited from fruitful previous work with A.C. Fabian and J.S. Sanders. This research has made use of the NASA/IPAC extragalactic database (NED), which is operated by the Jet Propulsion Laboratory under contract with the National Aeronautics and Space Administration. We acknowledge an anonymous referee for her/his comments and advices on our work which resulted in a great improvement of the manuscript.6 Appendix
NGC 315 (UGC 597, B2 0055+30). The high spatial resolution provided by Chandra imaging allowed the detection of X-ray jets, the most striking one being that along 10” to the NW (see Fig. 5 and Donato et al. 2004, Worral et al. 2003). Worral et al. (2003) made use of a 4.67 ks duration ACIS-S Chandra image to report an X-ray luminosity, for our assumed H0=75 km s-1 Mpc-1, of 5.9 1041erg s-1 (2-10 keV) and a power-law energy index =1.4 seen through a moderate intrinsic column density of NH from 2.3 to 8.2 1021cm-2 for the nuclear component whose spectrum is fitted with a single-component absorbed power-law. On the contrary, Donato et al. (2004), using the same spatial area for the extraction of the nuclear component (1.980.20”), conclude that to model the corresponding spectrum two components are required: a power-law (=1.56) and a thermal one (apec in XSPEC) with solar metallicity (kT=0.51 keV, NH=0.73 1022cm-2), therefore in very good agreement with our results by using RS+PL as the best model (see Table 6). Satyapal et al. (2005) class NGC 315 as an AGN-LINER (those displaying a hard nuclear point source, with a 2-10 keV luminosity 21038 erg s-1, coincident with the VLA or 2MASS nucleus); their spectral fitting results in kT=0.54 keV, NH=0.8 1022cm-2 and =1.60, that also agree with ours.
Arp 318A and B (Hickson Compact Group 16 A and B). No point sources are detected in neither hard band images (4.5-8∗ keV or 6-7 keV), but X-ray soft emission is extended (see Fig. 5). Turner et al. (2001) analyze the 40 ksec EPIC XMM-Newton first-light observations and confirm the presence of an AGN in both galaxies A and B. Three components were fitted to the EPIC X-ray spectrum of NGC 833 (Arp 318B): (1) a power-law for the obscured AGN, with =1.8 and NH=2.4 1023cm-2, (2) an unabsorbed power-law for the radiation scattered into our line of sight by thin, hot plasma directly illuminated by the AGN, and (3) an optically-thin thermal plasma with kT=0.47 keV; the luminosity of the AGN component of 6.2 1041 erg s-1 results to be 100 times brighter than the thermal X-ray emission. The core of NGC 835 (Arp 318A) showed a very similar spectrum, with absorbed and scattered power-laws indicating a heavily obscured AGN (NH=4.6 1023cm-2 and =2.25 ) of 5.3 1041erg-1 (0.5-10 keV) and a soft thermal component with kT=0.51 keV contributing at 2% of the total luminosity. Total counts for source B being insufficient for both the spectral analysis and the use of color-color diagrams, we only give the morphological classification as SB candidates for the two nuclei, in contrasts with the reported XMM-Newton spectral results and an estimation of and kT from color-color diagrams for source A, consistent with XMM-Newton results, but with no indication of high obscuration in our analysis.
NGC 1052. The X-ray morphology clearly indicates the presence of an unresolved nuclear source in the hard bands (Fig. 5), in agreement with the classification by Satyapal et al. (2004). Evidence for the AGN nature of this object was already given with the detection of broad lines in spectropolarimetric measurements by Barth et al. (1999). Guainazzi et al. (2000) confirmed that its X-ray spectrum may therefore resembles that of Seyfert galaxies with the analysis of its BeppoSAX spectrum (0.1-100 keV), for which they derive a very good fit with a two component model, constituted by an absorbed (NH=2.0 1023cm-2) and rather flat ( 1.4) power-law plus a “soft excess” below 2 keV. The corresponding flux in the 2-10 keV is 4.0 10-12 erg cm-2 s-1. The presence of various jet-related X-ray emitting regions from a short (2.3 ks) Chandra observation, together with a bright compact core and unresolved knots in the jet structure as well as an extended emitting region inside the galaxy well aligned with the radio synchrotron jet-emission have been reported by Kadler et al. (2004); they derive for the fitting of the core spectrum 0.25 and kT0.5 keV. The value they estimate for the luminosity is within the factor of 3 of our estimation (see Table 5).
NGC 2681 (UGC 4645). An unresolved nuclear source is clearly detected at hard X-ray energies (Fig. 5). Satyapal et al. (2005), who made use of archival Chandra ACIS observations of this galaxy, classed by them as an AGN-LINER, and derived kT=0.73 keV and =1.57 for a apec plus power-law fit to the nuclear spectrum. These values are in perfect agreement, within the errors, with the parameters we derive for our best model (ME+PL) (=1.74 and kT=0.66 keV, see Table 6), that we recall gives unacceptable values of .
UGC 05101. In addition to the hard band point nuclear source, extended emission is seen in both (4.5-8.0∗ keV) and (6-7 keV) bands (Fig. 5). The evidence of a buried active galactic nucleus in this ultra-luminous infrared galaxy has been provided by the analysis by Imanishi et al. (2003) of its XMM-Newton EPIC spectrum. They fit the spectrum with an absorbed power-law (=1.8 fixed), a narrow gaussian for the 6.4 keV Fe K line, which is clearly seen in their spectrum, and a 0.7 keV thermal component, deriving (NH=14 1023cm-2) and EW(Fe K)=0.41 keV. The resulting (2-10 keV) luminosity of 51042erg s-1 is about 30 times higher than the value we estimate. Fe-K emission is marginally detected in the analysis of Chandra data by Ptak et al. (2003). The luminosity we estimate is a factor of two higher than that given by Dudik et al. (2005) derived from Chandra ACIS data.
NGC 3226 (UGC 5617, Arp 94A). Several point sources are detected at the (4-8) keV band image of this galaxy, with Fe emission unambiguously present in the nucleus (Fig. 5). The analysis of HETGS Chandra data by George et al. (2001), whose properties strongly suggested that this galaxy hosted a central AGN, resulted in an adequate fit with a photon index =1.94 and NH=4.8 1021cm-2, with the implied luminosity L(2-10 keV)3.21040 erg s-1. XMM-Newton observations of this dwarf elliptical most probably indicate the presence of a sub-Eddington, super-massive black hole in a radiative inefficient stage (Gondoin et al. 2004). They conclude that, since the best fit is provided by a bremsstrahlung model absorbed by neutral material, the X-ray emission may therefore be reminiscent of advection-dominated accretion flows. Nevertheless, an acceptable fit is also obtained by including a power-law model (=1.96) absorbed by neutral (NH=4.1 1021cm-2) and ionized material. The resulting (2-10 keV) luminosity, calculated for the distance we use, is 1.8 1040 erg s-1, a factor of 4 higher than the one we estimate. Terashima & Wilson (2003) fit the Chandra ACIS nuclear spectrum with a power-law with =2.21 (from 1.62 to 2.76) and NH=0.93 1022cm-2. Notice that substantial absorption is also derived from the position of this galaxy in the color-color diagrams, whereas the power-law index we estimate is somewhat steeper (see Table 6).
NGC 3245 (UGC 5663). No unresolved nuclear source is detected in the (4.5-8.0∗ keV) band image. This contrasts with the analysis by Filho et al. (2004) who, making use of the same Chandra data, conclude that there is a hard nuclear X-ray source coincident with the optical nucleus. The luminosity they calculate with a fixed =1.7 is less than a factor of 2 fainter than ours.
NGC 3379 (UGC 5902, M 105). Very recently, David et al. (2005) have published their study of the X-ray emission as traced by ACIS-S Chandra observations, which is mainly devoted to the analysis of extra-nuclear X-ray sources and diffuse emission, and they derive a power-law index for the diffuse emission of 1.6-1.7, in agreement with the value reported by Georgantopoulos et al. (2002). David et al. (2005) do not fit the spectrum of the nuclear source (their source 1) due to the too few net counts in the S3 chip data for this object. This is also the reason for not having neither a fit nor an estimation of the spectral parameters (see Table 6).
NGC 3507 (UGC 6123). No hard nuclear point source is detected for this galaxy (Fig. 5). The only previous published X-ray study is based on observations obtained with ASCA: Terashima et al. (2002) get =2.3 and NH=1.0 1022cm-2, but conclude that a power-law model (=1.7) describes the spectrum well.
NGC 3607 (UGC 6297). No hard nuclear point source is detected for this galaxy (Fig. 5). Based on observations obtained with ASCA, Terashima et al. (2002) found no clear evidence for the presence of an AGN in this LINER, in agreement with our classification.
NGC 3608 (UGC 6299). No hard nuclear point source is detected for this galaxy (Fig. 5). The only previous X-ray study of this galaxy is that by O’Sullivan et al. (2001) who present a catalogue of X-ray bolometric luminosities for 401 early-type galaxies obtained with ROSAT PSPC pointed observations. Corrected to our adopted distance, this luminosity is of 1.37 1040erg s-1, about 30 times brighter than our estimation.
NGC 3628 (UGC 6350, Arp 317C). The hard X-ray morphology shows an unresolved nuclear component that also appears in the Fe image (Fig. 5). Chandra X-ray and ground-based optical H, arc-second resolution imaging is studied by Strickland et al. (2004), with the main aim of determining both spectral and spatial properties of the diffuse X-ray emission. They also show the total counts for the nuclear region (an extraction of 1 kpc radius around the dynamical center that, for this galaxy, corresponds to the central 20”), but no spectral fitting is attempted. Our morphological classification does not agree with that of Dudik et al. (2005) who have classified this galaxy as an object displaying no nuclear source according to its morphology in Chandra ACIS data; this galaxy is taken as a LINER/transition object and an upper limit of 2.7 1037erg s-1 (corrected to our adopted distance) is given for its (2-10 keV) nuclear luminosity, about 6 times fainter than our estimated luminosity. Note that a high absorption is derived from the position of this galaxy in the color-color diagrams.
NGC 3690B (Arp 299, Mrk 171). X-ray emission is plenty of features, with a hard unresolved source clearly detected in the nuclear position, which is also seen in the 6-7 keV band (Fig. 5). EPIC-pn XMM-Newton spatially resolved data have clearly demonstrated the existence of an AGN in NGC 3690, for which a strong 6.4 keV line is detected, and suggested that the nucleus of its companion IC 694 might also host an AGN666Note however that both galaxies are found in the comparative sample of starburst galaxies in Satyapal et al. (2004)., since a strong 6.7 keV Fe-K line is present (Ballo et al. 2004). Considering both that XMM-Newton integrates a larger area than the nuclear 3” we extract and that a gaussian line together with a single power-law fit (=1.8 and NH=5.6 1021cm-2) is used for the fitting of EPIC-pn data, the differing results can be explained.
NGC 4111 (UGC 7103). A hard nuclear point source is detected for this galaxy (Fig. 5). Previous X-ray spectral analysis comes from ASCA data by Terashima et al. (2000, see also Terashima et al. 2002) who could not fit the spectrum with a single component model, but a combination of a power-law together with a Raymond-Smith plasma, with =0.9, kT=0.65 keV (in reasonable agreement with the parameters we estimate from its position in the color-color diagrams, see Table 4) and NH=1.4 1020cm-2 reproduced well the observed spectrum and gives an intrinsic L(2-10 keV)= 6.8 1039 erg s-1, a factor of 3 higher than the one we estimate (see Table 5).
NGC 4125 (UGC 7118). Fig. 5 shows the presence of a nuclear hard point source. The best fit Georgantopoulos et al. (2002) obtain for the central 2′ BeppoSAX spectrum is that provided by an absorbed power-law with =2.52 and NH=3 1022cm-2, providing L(2-10 keV)=0.68 1040 erg s-1. Satyapal et al. (2004), based on Chandra ACIS imaging, class this galaxy among those revealing a hard nuclear source embedded in soft diffuse emission; they estimate the luminosity by assuming an intrinsic power-law slope of 1.8 which results to be (once corrected to our adopted distance) L(2-10 keV)=7.3 1038 erg s-1, in very good agreement with the value we estimate.
NGC 4261 (UGC 7360, 3C 270). The nuclear hard band emission of this galaxy is clearly unresolved both in the (4.5-8.0∗ keV) and 6-7 keV bands (Fig. 5). Sambruna (2003) published its nuclear EPIC-pn XMM-Newton spectrum (the central 10”) which is best fitted with a two component model with a power-law (=1.4) absorbed by a column density of NH4 1022cm-2 plus a thermal component with kT0.7 keV (in agreement with Chandra spectral results by Gliozzi et al. 2003 and Chiaberge et al. 2003); an unresolved FeK emission line with EW0.28 keV is detected at 7 keV. They also report short-term flux variability from the nucleus (timescale of 3-5 ks), that they argue as being originated in the inner jet. The various features seen at soft energies (Fig. 5) were already shown by Donato et al. (2004), who also analyzed its Chandra ACIS data for the core component (core radius of 0.98”), that they fit with a PL+apec model with =1.09, kT=0.60 keV and a high column density NH=7.0 1022cm-2, reported to be the largest intrinsic column density of the 25 radio galaxies in their study. These parameters agree with those obtained by Rinn et al. (2005) and Satyapal et al. (2005) for the same data.
Very recently Zezas et al. (2005) have published the analysis of 35ks Chandra ACIS-S observations. They report an almost point-like emission above 4.0 keV, and evidence for an X-ray jet component down to arc-second scales from the nucleus (barely visible in our Fig. 5). A three component model is given as the best fit for the X-ray spectrum of the nuclear 2”: a heavily obscured, flat power-law (=1.54 and NH=8.4 1022cm-2), a less absorbed, steeper power-law (=2.25 and NH 3.7 1020cm-2) and a thermal component (kT=0.50 keV), which results in L(2-10 keV)=10.8 1040 erg s-1, a factor of 2 higher that what we estimate. They report an equally good fit with a single power-law (=1.37) seen through a partially covering absorber (NH=7.7 1022cm-2, fcov=0.92) plus a thermal component. We have not included this object in the SF subsample due to its complexity that gives as but fitted and unexpected parameters with our five models.
NGC 4314 (UGC 7443). No nuclear source is detected in the hard X-ray band (Fig. 5). Satyapal et al. (2004) use Chandra ACIS imaging to classify this galaxy among those exhibit multiple, hard off-nuclear point sources of comparable brightness to the nuclear source; with an assumed power-law index of 1.8, the corresponding luminosity, corrected to our adopted distance, results to be L(2-10 keV)=8 1037 erg s-1, in excellent agreement with the one we estimate (see Table 5).
NGC 4374 (M 84, UGC 7494, 3C 272.1). Both in (4.5-8.0∗ keV) and 6-7 keV band images an unresolved nuclear source is detected (Fig. 5). Satyapal et al. (2004) already described the X-ray morphology traced by Chandra ACIS imaging of this galaxy as revealing a hard nuclear source embedded in soft diffuse emission. The Chandra ACIS-S data are analyzed by Finoguenov & Jones (2001)777See also Kataoka & Stawarz (2005) for the analysis of the two extra-nuclear knots., who report a remarkable interaction of the radio lobes and the diffuse X-ray emission, and provide the parameters for a fit with an absorbed (NH=2.7 1021cm-2) power-law (=2.3) and the corresponding L(0.5-10 keV)=4.7 1039 erg s-1, all in very good agreement with the ones we give in this paper (see Tables 3 and 6); but they somewhat differ from the ones obtained from the ASCA spectrum (Terashima et al. 2002), most probably due to the different spatial resolutions.
NGC 4395 (UGC 7524). The unresolved nuclear source is seen in both (4.5-8∗ keV) and 6-7 keV band images (Fig. 5). Moran et al. (2005) have recently published888See also O’Neill et al. 2006, ApJ accepted, astro-ph/0603312. the first high-quality, broadband X-ray detection of the AGN of this object, confirming the rapid, large amplitude variability reported in previous studies (Iwasawa et al. 2000, Shih et al. 2003) and confirmed with XMM-Newton EPIC-pn data (Vaughan et al. 2005). They fit a single power-law model with absorption by neutral material to the spectrum of the nuclear 5” (=0.61 and NH=1.2 1022cm-2), that provides a poor fit over the entire Chandra 0.5 to 9 keV range, but they claim to be excellent for energies above 1.2 keV. Our best model results to be a single absorbed power-law as well, but with somewhat stronger absorption (NH=2.87 1022cm-2) and a higher spectral index (=1.44, see Table 6). The iron line clearly resolved in the time-averaged ASCA spectrum shown by Shih et al. (2003) is also visible in our spectrum (see Fig. 3).
NGC 4410A (UGC 7535, Mrk 1325). Both (4.5-8∗ keV) and 6-7 keV band images show the unresolved nature of the nuclear source at these energies (Fig. 5). ACIS-S Chandra observations of the NGC 4410 group are presented in Smith et al. (2003), who obtained an adequate fit for the spectrum of the inner 1” to a power-law with 2 and a fixed NH=5 1020cm-2, in agreement with previous analysis of ROSAT X-ray observations (Tschöke et al. 1999). Our best model only needs the inclusion of a power law with =1.75 (consistent with theirs within the errors)
NGC 4438 (UGC 7574, Arp 120B). No nuclear point source is detected in our hard X-ray band images (Fig. 5). The results from 25 ks Chandra ACIS-S observations of this galaxy are presented in Machacek et al. (2004) who, in contrast with our morphological classification, suggest the presence of an AGN based on the steep spectral index and the location of the hard emission at the center of the galaxy. The spectrum of the central 5” is claimed to be best fitted by a combination of an absorbed power-law (with NH=2.9 1022cm-2 and a fixed =2.0) and a MEKAL 0.58 keV thermal component, providing L(2-10 keV)=2.5 1039 erg s-1. Nevertheless, Satyapal et al. (2005) class this galaxy as an non AGN-LINER based on its ACIS Chandra image, in agreement with our classification, with kT=0.77 keV and NH=1.2 1021cm-2, consistent with ours within the errors, but =1.19.
NGC 4457 (UGC 7609). Hard emission is unresolved in the nucleus of this galaxy (Fig. 5). The spectral analysis of ACIS Chandra data by Satyapal et al. (2005) gives =1.57, kT=0.69 keV and no additional absorption, in very good agreement with our results (see Table 6).
NGC 4459 (UGC 7614). Our morphological classification (SB candidate, see Fig. 5) agrees with that by Satyapal et al. (2005), also based on ACIS Chandra data, who gives no additional X-rays information on this object.
NGC 4486 (M 87, UGC 7654, Virgo A, Arp 152, 3C 274). Both the unresolved nuclear emission and the jet-like feature extending 15” to the W-NW, in the direction of the optical jet, are seen in Fig. 5. Combined deep Chandra, ROSAT HRI and XMM-Newton observations of this galaxy are shown in Forman et al. (2005), where the same salient features present in our Fig. 5 can be seen, with X-ray jets clearly detected, but no spectral analysis is made. Donato et al. (2005) analyze both Chandra and XMM-Newton data providing a radius for the core of 0.22”. Dudik et al. (2005) classed it among objects exhibiting a dominant hard nuclear point source and estimate its luminosity as L(2-10 keV)=3.3 1040 erg s-1 with a fixed =1.8 power-law, in good agreement with the one we estimate (see Table 5).
NGC 4494 (UGC 7662). Hard nuclear emission is point-like (Fig. 5). The XMM-Newton EPIC spectrum extracted from a 45” region has been published by O’Sullivan & Ponman (2004). In agreement with our findings, a ME+PL combination results to be the best model for the spectral fitting, for which they get =1.5 (consistent with our value) but for hydrogen column density fixed at the Galactic value (NH=1.56 1020cm-2 and kT=0.25 keV). In agreement with our morphological classification, Dudik et al. (2005) class it as a hard nuclear point dominated source and estimate L(2-10 keV)=7.2 1038 erg s-1 with a fixed =1.8 power-law, about a factor of 6 fainter than the one we calculate with the spectral fitting.
NGC 4552 (M 89, UGC 7760). This galaxy shows in the hard band an unresolved source over an extended nebulosity morphology with the peak of emission coincident with the galaxy center determined from 2MASS data (Fig. 5). Xu et al. (2005) found from Chandra ACIS-S data that the central source is the brightest in the field and it coincides with the optical/IR/radio center of the galaxy within 0.5”. The X-ray identified source is compact and variable in short time scales of 1 h. Their best fitted model to the source is consistent with an absorbed power-law with spectral index =2.24 in rather good agreement with the ASCA data reported by Colbert and Mushotzky (1999). The inferred luminosity in the 2-10 keV was of 4 1039 erg s-1, consistent with our result (2.6 1039erg s-1). Their main conclusion based on the found variability, the spectral analysis and multi-wavelengh data is that the central source is most likely a low luminosity AGN than contribution from LMXBs. Our best fit parameters are consistent with a model of a power law with an spectral index =1.81 plus a thermal RS of kT= 0.83, in much better agreement with the results by Filho et al. (2004) on the analysis of Chandra archival data, with =1.51 and kT=0.95.
NGC 4579 (M 58, UGC 7796). This galaxy shows a compact nuclear source sitting in a diffuse halo (Fig. 5). Eracleous et al. (2002) fitted the compact unresolved central source detected in Chandra X-ray data, coincident with the broad line region detected in UV by Barth et al. (2002) with a simple power-law spectra with =1.88 which gives an estimated luminosity of 1.7 1041erg s-1. More recently Dewangan et al. (2004) present XMM-Newton data to search for the presence of FeK line. The best fit spectrum is rather complex: an absorbed power-law with =1.77 plus a narrow gaussian at 6.4 keV and a broad gaussian at 6.79 keV with FWHM 20.000 km s-1. This broad component is interpreted as arising from the inner accretion disk. The estimated luminosity amounts to 1.2 1040erg s-1, being lower than both Eracleous’s estimation and ours (1.4 1041erg s-1).
NGC 4594 (M 104, Sombrero Galaxy). The Sombrero galaxy shows the typical X-ray morphology of a compact unresolved nuclear source on top of a diffuse halo (Fig. 5). Dudik et al. (2005) class it within the objects that exhibit a dominant hard nuclear point source. Pellegrini et al. (2003) present an investigation with XMM-Newton and Chandra of the 7” central nuclear source being consistent with an absorbed power-law of =1.89 with a column density of NH=1.8 1021cm-2, in close agreement, within the errors, with our fitted values. Our value of the estimated 2-10 keV luminosity, 1.2 1040 erg s-1, agrees pretty well with the data reported by Pellegrini from XMM-Newton.
NGC 4596 (UGC 7828). This galaxy is very faint at X-ray frequencies, showing diffuse X-ray morphology in all the spectral bands (Fig. 5). Information on its spectral properties cannot be obtained based on the present data due to the lack of sufficient counts in the hard band (4.5-8.0∗ keV). No previous X-ray data have been reported for this galaxy.
NGC 4636 (UGC 7878). This galaxy does not show emission at high energies (Fig. 5). Chandra data do not have enough quality to allow a proper fitting to the spectrum. Xu et al. (2002) and O’Sullivan et al (2005) present XMM-Newton data for this source and obtain that it can be consistent with thermal plasma with a temperature kT between 0.53 and 0.71 keV. The arm-like structure reported by Jones et al. (2002) at soft energies can be produced by shocks driven by symmetric off-center outbursts preventing the deposition of gas in the center. O’Sullivan et al. (2005) suggest that the X-ray morphology can be the result of a past AGN being quiescent at the present. The difference in our luminosity estimation (1.77 1039erg s-1) and the value reported by Loewenstein et al. (2001) for the nucleus (2 1038erg s-1) is due to the different apertures used, 13” and 3”, respectively.
NGC 4676A and B (Arp 242, The Mice Galaxy). No detection of X-rays can be seen at high energies (Fig. 5). Read (2003) present the first Chandra analysis of The Mice Galaxy and found a compact source in component B being rather diffuse in A. Their spectral fitting in B is both consistent with MEKAL thermal and power-law modeling. We did not perform any fitting due to poor counting statistics. From the color-color diagrams the data for component A are consistent with a power-law with an spectral index in the range 0.8-1.2. For component B we did not make any estimation since the error in the count rate for the hardest band is greatest than 80%. Our estimated luminosities for both components are in remarkably good agreement with the results by Read and can be attributed to the starbursts in both components.
NGC 4696 (Abell 3526). This galaxy is rather diffuse at high energies, having a clear nuclear halo morphology at soft energies (Fig. 5). In fact, Dudik et al. (2005) class it as an object that reveals a hard nuclear point source embedded in soft diffuse emission. Di Matteo et al. (2000) and Allen et al. (2000) in their reported ASCA data for a few giant ellipticals in clusters, include this galaxy which is the center of the Centaurus cluster, the analysis of its spectrum showing a high luminosity of 2.14 1042erg s-1. Taylor et al. (2006) obtain the best fit model by a MEKAL thermal plasma with kT=0.75 keV and abundance of 0.22 times the solar abundance; in the same sense, Rinn et al. (2005) fit its XMM-Newton spectrum with a thermal model with kT=0.7 keV but for a 1.2 solar metallicity. At variance with them, our best fit model seems to be a power-law but with rather high and unrealistic spectral index of 4.26. This difference can be attributed to the different aperture used, 3.9” in our case and 0.9” in the data by Taylor et al. Even so, the estimated luminosities are not very far within a factor of 2 (6 1039erg s-1 and 1.2 1040erg s-1 for our analysis and Taylor’s, respectively). We have classified this source as a good candidate to be an Starburst due to the absence of a nuclear unresolved source at hard energies (Fig. 5). Nevertheless, The VLBA data reported by Taylor and collaborators reveal a weak nucleus and a broad, one-sided jet extending over 25 pc suggesting the AGN nature of this peculiar source.
NGC 4698 (UGC 7970). This galaxy shows very faint high energy X-ray emission on its central region. The largest extension is found at intermediate energies, between 1 and 4 keV (Fig. 5). Georgantopoulos & Zezas (2003) make a careful analysis of the Chandra data on this source and found that the X-ray nuclear position coincide with the faint radio source reported by Ho and Ulvestad (2001). They found that the best fit model consist of an absorbed power-law with =2.18 and column density of NH=5 1020cm-2 which gives a nuclear luminosity of 1039erg s-1. We found from the color-color diagrams that the data are consistent with a combined model of a power-law with =[1.2-1.6] and a thermal component with kT=[0.7-0.8] keV and a luminosity lower by a factor of two than the one estimated by Georgantatopoulos & Zezas (2003). Cappi et al. (2006) fit its XMM-Newton spectrum with a single power-law model with =2.0 and get L(2-10 keV)=1.6 1039erg s-1, a factor of 3 brighter than our determination.
NGC 4736 (M 94, UGC 7996). This galaxy shows a large amount of unresolved compact sources in the central few arc-sec, which make the extraction of the true nuclear source rather difficult (Fig. 5). Eracleous et al. (2002) identified 3 sources in the nuclear region, all of them showing hard spectra with power-law indices ranging from 1.13 for the brightest one till 1.8 for X-3, and luminosities in the 2-10 keV band between 4 1038 erg s-1 and 9.1 1039erg s-1. We have identified the source X-2 by Eracleous as the nucleus of the galaxy since it coincides with the 2MASS near-IR nucleus within 0.82”. Eracleous (2002) pointed out on the complications to define an AGN or SB character to this source suggesting that even if the brightest source is associated with an AGN it only will contribute in a 20% to the energy balance in the X-rays. The radio monitoring observations made by Körding et al. (2005) with the VLBI found a double structure, the radio position N4736-b coinciding with our identified X-ray nucleus. From this double structure the brightest knot N4736-b appears to be also variable, pointing to an AGN nature of this low luminosity AGN.
NGC 5055 (M 63, UGC 8334). This galaxy shows a clear unresolved nuclear source coincident with the 2MASS position for the nucleus (Fig. 5). No previous Chandra data have been reported. The only data available were ROSAT PSPC and HRI observations (Read et al. 1997, Roberts and Warwick 2000) pointing to the nucleated nature of this source within the low spatial resolution, 10” at best. Recently, Liu and Bregman (2005) in the course of an investigation of ULX over a sample of 313 nearby galaxies found 10 ULX in this galaxy, one of these being close to the nucleus with a variable luminosity between 0.96 and 1.59 1039erg s-1 in 1.6 days.
NGC 5194 (M 51a, UGC 8493, Arp 85a). A clear unresolved nuclear source is identified in the hard band of M51 coincident within 2.87” with the near IR nucleus (Fig. 5). Dudik et al. (2005) class it as an object that reveal a hard nuclear point source embedded in soft diffuse emission. Its spectral properties suggest that the source can be modeled by a combination of MEKAL at kT=0.61 keV plus a power-law with =2.67 and column density consistent with the galactic value, this fitting providing a fairly low luminosity in the hard band (1.38 1038erg s-1). Dewangan et al. (2005) obtain XMM-Newton observations for the galaxy that show an extremely flat continuum and a narrow iron K line. They investigate different models for the galaxy, the best one being more consistent with a reflection of the primary power-law ( =1.9) by cold and dense material. By using this model they estimate a luminosity of 1.8 1039erg s-1, which is a factor of 10 larger than our estimation. Cappi et al. (2006) fit its XMM-Newton spectrum with a combined power-law with =0.6 and thermal with kT=0.5 keV, together with a Fe K line with EW(Fe K)=0.986 keV, and get L(2-10 keV)=3.3 1039erg s-1, a factor of 20 brighter than our determination. These differences can be attributed either to the different model used or maybe to the different spatial resolution of XMM-Newton and Chandra data. It has to be noticed that the iron line FeK has not been included in our fitting but it is clearly detected. We note that whereas UGC 08696 shows a compact nuclear source in this energy band it can not be directly associated with a FeK line because it has a broad high energy component at these energies.
Mrk 266 (NGC 5256, UGC 8632, IZw 67). Its X-ray morphology shows the double structure of these merging system with the North-West nucleus being brighter than the southern one. Also the southern nucleus shows hard emission being more diffuse (Fig. 5). New XMM-Newton observations have been reported by Guainazzi et al. (2005), with data consistent with a thermal plasma of luminosity 3.6 1040erg s-1, which seems to be in good agreement with our results (see Table 5).
UGC 08696 (Mrk 273). Mrk 273 is one of the prototypical Ultra-luminous Galaxies showing a very complex structure at optical frequencies with a double nuclei and a long tidal tail. At high X-ray energies only the northern nucleus is detected (Fig. 5) which it is coincident with the compact radio source shown by VLBI observations (Cole et al. 1999, Carilli and Taylor 2000). Satyapal et al. (2004), based on Chandra ACIS imaging, class this galaxy among those revealing a hard nuclear source embedded in soft diffuse emission. Xia et al. (2002) report previous analysis of the X-ray Chandra data; from their careful analysis of both the nucleus and the extended emission, they show that the compact nucleus is well described by an absorbed power-law (NH= 4.11020cm-2, =2.1, L(2-10 keV)=2.9 1042 erg s-1) plus a narrow FeK line. The most remarkably result from this analysis is that the spectrum of the central 10” is consistent with a metallicity of 1.5Z⊙ whereas the extended halo seems to be consistent with a thermal plasma with metallicity of 0.1 Z⊙. The results reported by Ptak et al. (2003) pointed out that most of the observed X-ray emission (95%) comes from the nucleus. Balestra et al. (2005) using XMM-Newton data analyze the FeK line and conclude that, as in the case of NGC 6240, the line is the result of the superposition of neutral FeK and a blend of highly ionized lines of FeXXV and FeXXVI. Our best fit model is in good agreement with these data within the errors (=1.74 , kT=0.75 keV , NH=3.9 1020cm-2 and L(2-10 keV)=1.5 1042 erg s-1, see Tables 5 and 6).
CGCG 162-010 (Abell 1795, 4C 26.42). This galaxy is the central galaxy of the cluster A1795, which hosts the powerful type I radio source 4C26.42. The X-ray morphology shows a rather diffuse emission at high energies and very clear long filament at soft energies (Fig. 5). A full description of the nature of this filament is made in Crawford et al. (2005), who attribute the observed structure as due to a large event of star formation induced by the interaction of the radio jet with the intra-cluster medium. Satyapal et al. (2004), based on Chandra ACIS imaging, class this galaxy among those revealing a hard nuclear source embedded in soft diffuse emission. Nevertheless, Donato et al. (2004) investigate the nature of the X-ray central compact core in a sample of type I radio galaxies and classified this galaxy among sources without a detected compact core, in agreement with our classification. Our X-ray spectroscopic analysis results in this object being one of the five most luminous in our sample, with a value in very good agreement with the one estimated by Satyapal et al. (2004) for an intrinsic power-law slope of 1.8 (see Table 5).
NGC 5746 (UGC 9499). No previous X-ray data have been previously reported. Its morphology shows a clear compact unresolved nuclear source (Fig. 5). Nagar et al. (2002) detected a compact radio source suggesting the AGN nature of this galaxy. Both the fitting and the position in the color-color diagrams indicate considerable obscuration (see Table 6).
NGC 5846 (UGC 9706). Trinchieri and Goudfroij (2002), based on Chandra data, reveal a complex X-ray morphology with no clear nuclear identification (see also Fig. 5). They detect, however, a large amount of individual compact sources in the range of luminosities of 3-20 1038 erg s-1. Filho et al. (2004) report a weak hard (2-10 keV) nuclear source with =2.29, compatible within the errors with the value we obtain from the spectral fitting. Satyapal et al. (2005) analyze the Chandra data of this galaxy that they class within non-AGN LINERs, fitting its spectrum with a single thermal model with kT=0.65 keV, exactly the same we get for our single RS model (see Table 3).
NGC 5866 (UGC 9723). The data for this galaxy reveal a rather complex morphology at hard frequencies with an identifiable nuclear region and extended emission in the North-West direction (Fig. 5). Previous X-ray data by Pellegrini (1994) are based on ROSAT PSPC observations, where they pointed out the high excess of soft X-ray emission in S0 galaxies. Filho et al. (2004) and Terashima & Wilson (2003) failed to detect any hard nuclear X-ray emission in the Chandra image of this galaxy, and Satyapal et al. (2005) class it as a non-AGN-LINER, what agrees with our morphological classification.
NGC 6251 (UGC 10501). This is a well known radio galaxy hosting a giant radio jet (Birkinshaw and Worrall 1993, Sudou et al. 2001). The high energy X-ray morphology shows a well defined unresolved nuclear source without any extended halo (Fig. 5). Guainazzi et al. (2003) reported a full analysis of the nuclear energy source comparing Chandra, BeppoSAX and ASCA data. They found that the spectra can be modeled by a combination of thermal plasma at kT=1.4 keV plus a power-law with =1.76 and NH=1.6 1021cm-2, but they do not find evidences of the broad FeK claimed by previous ASCA observations. However, the high sensitivity of XMM-Newton leads Gliozzi et al. (2004) to suggest again that such a broad (= 0.6 keV) FeK line at 6.4 keV with an EW=0.22 keV does exist. They suggest the presence of an accretion disk in addition to the jet for explaining the origin of the X-ray emission. Chiaberge et al. (2003) modeled the spectrum from -ray to radio frequencies and found that it is consistent with a Synchrotron Self Compton model with an unexpected high resemblance to blazar-like objects. This model together with the dispute on the existence of FeK leads Evans et al. (2005) to favor the relativistic jet emission as the main component of the observed emission. Our data are in a remarkable good agreement with the ones reported by Gliozzi et al. (2003).
NGC 6240 (IC 4625, UGC 10592, 4C 02.44). Komossa et al. (2003) discovered a binary AGN in the galaxy coincident with the optical nucleus. They appear as compact unresolved at energies between 2.5-8 keV. The spectroscopic analysis shows a very hard radiation for both nuclei, with =0.2 for one to the South and 0.9 for one to the North-East one. In both nuclei the FeK is present. Satyapal et al. (2004) class it as an object that reveal a hard nuclear point source embedded in soft diffuse emission. Ptak et al. (2003) pointed out to the complexity of the nuclear spectrum of this galaxy and construct a more complex model which, in addition to the standard MEKAL and power-law component, they also includes a gaussian fit for the FeK and a Compton reflection component with different column densities. To give an idea of the complexity of the source let us point out that Boller et al. (2003) best modeled the FeK line as resolved into 3 narrow lines: neutral FeK at 6.4 keV, an ionized line at 6.7 keV and a blend of higher ionized lines (FeXXVI and the Fe K line) at 7.0 keV. For consistence with the statistical analysis we have modeled the continuum spectrum with a combination of thermal plus a power-law component without taken into account the complex FeK line. High absorption is derived for this source from both the spectral fitting and the estimation from color-color diagrams (Table 6).
IRAS 17208-0014. The X-ray nuclear emission of this Infrared Ultra-luminous Galaxy appears to be unresolved at high energies (Fig. 5). Rissaliti et al. (2000) analyzed luminous IR galaxies in X-ray with BeppoSAX to investigate the 2-10 keV nature of their emission and they classified it as a star forming galaxy with a quite large X-ray luminosity (L(2-10 keV)=1 1042 erg s-1). Franceschini et al. (2003) report XMM-Newton data for a sample of 10 ULIRGs and found that for this galaxy the observations are equally consistent with a model of a thermal plasma with a temperature kT=0.75 keV plus a power-law component with =2.26 and NH=1.1 1022cm-2, and a thermal component with a temperature kT=0.74 keV plus a cut-off power-law component with =1.30 and NH=2.6 1021cm-2, leading in both cases to a similar luminosity of the order of a few times 1041erg s-1. They suggested, based on the lack of FeK and the close value between the SFR estimated through the Far IR emission and the X-ray emission, that X-ray emission has an starburst origin. We did not tried to fit the spectrum due to low counts. From the position in the color-color diagrams, this galaxy seems to be consistent with high column density and a mix model with power-law index between 1.6 and 2.0 and temperature in the range 0.6-0.8 keV. Ptak et al. (2003) analyze the Chandra data on this object and obtain that the best fit to the global spectrum is provided by a combined power-law (=1.68) and thermal (kT=0.35 keV) with NH=0.52 1022cm-2model. The nuclear luminosity is estimated to be L(2-10 keV)=4.2 1041 erg s-1, a factor of 3 brighter than the one we estimate (see Table 5).
NGC 6482 (UGC 11009). This galaxy is the brightest member of a fossil group. Khosroshashi et al. (2004) analyze the temperature profile of the group but not for the individuals. The Chandra data on this source show no hard nuclear source (Fig. 5) associated with the compact radio source detected by Goudfroij et al. (1994). Our spectral analysis show that the data are consistent with a thermal plasma at kT=0.68 keV. This is the only galaxy for which the nuclear spectrum is better fitted by a single thermal component.
NGC 7130 (IC 5135). This galaxy shows a well defined nuclear source at high X-ray energies (Fig. 5). Since most of the UV emission is spectrally characteristic of star formation (Thuan 1984, Gonzalez-Delgado et al. 1998), Levenson et al. (2005) tried to decompose the AGN and Starburst contributions and found that the AGN contribution manifested mainly at higher energies, larger than 3 keV. They found that the obscuration of the nucleus is Compton-thick what prevents the detection of the intrinsic emission in the Chandra bandpass below 8 keV. We recall that our spectral fitting is not statistically acceptable for this source.
NGC 7331 (UGC 12113). Stockdale et al. (1998) and Roberts & Warwicl (2000) pointed out, based in ROSAT data, to the AGN nature of this galaxy. Nevertheless, the hard X-ray data from Chandra do not show any evidence of a nuclear source, being very diffuse at high energies (Fig. 5). Note that Filho et al. (2004) describe this galaxy as hosting a hard (2-10 keV) X-ray nucleus, but Satyapal et al. (2004) class it as an object exhibiting multiple, hard off-nuclear point sources of comparable brightness to the nuclear source. Our estimated parameters are consistent with a spectral index of 2-2.6 and temperature of 0.7 keV. Recently Gallo et al. (2006) present XMM-Newton data on the source and found that the spectrum is consistent with a thermal component at kT=0.49 keV plus a power-law with =1.79 giving a luminosity that it is a factor of 10 larger than our estimation. The reasons for this difference are not clear. Nevertheless, the estimation of the luminosity by Satyapal et al. (2004) for an intrinsic power slope of 1.8 is in perfect agreement with ours, hinting to resolution effects being important to explain the difference with the work by Gallo et al. (2006).
IC 1459 (IC 5265). This galaxy presents an unresolved nuclear source on top of a diffuse halo at high energies (Fig. 5), in agreement with the classification by Satyapal et al. (2004). It hosts a Super-massive black hole (2 109 M, Cappellari et al. 2002) but with rather moderate nuclear activity. Fabbiano et al. (2003) obtain that it shows a rather weak (L(2-10 keV)=8.0 1040 erg s-1 ) unabsorbed nuclear X-ray source with =1.88 and faint FeK line at 6.4 keV. These characteristics describe a normal AGN radiating at sub-Eddington luminosities, at 3 10-7 below the Eddington limit. They suggest that ADAF solutions can explain the X-ray spectrum but these models failed to explain the high radio-power of its compact source (Drinkwater et al. 1997). Our fitting parameters are in a remarkably good agreement with theirs (=1.89, kT=0.30 keV and L(2-10 keV)=3.6 1040 erg s-1).
References
- Allen et al. (2000) Allen, S. W., Di Matteo, T., & Fabian, A. C. 2000, MNRAS, 311, 493
- Balestra et al. (2005) Balestra, I., Boller, T., Gallo, L., Lutz, D., & Hess, S. 2005, A&A, 442, 469
- Ballo et al. (2004) Ballo, L., Braito, V., Della Ceca, R., Maraschi, L., Tavecchio, F., & Dadina, M. 2004, ApJ, 600, 634
- Balucinska-Church & McCammon (1992) Balucinska-Church, M., & McCammon, D. 1992, ApJ, 400, 699
- Barth et al. (1998) Barth, A. J., Ho, L. C., Filippenko, A. V., & Sargent, W. L. W. 1998, ApJ, 496, 133
- Barth et al. (1999) Barth, A. J., Filippenko, A. V., & Moran, E. C. 1999, ApJ, 515, L61
- Barth & Shields (2000) Barth, A. J., & Shields, J. C. 2000, PASP, 112, 753
- Barth et al. (2001) Barth, A. J., Sarzi, M., Rix, H.-W., Ho, L. C., Filippenko, A. V., & Sargent, W. L. W. 2001, ApJ, 555, 685
- Barth (2002) Barth, A. J. 2002, ASP Conf. Ser. 258: Issues in Unification of Active Galactic Nuclei, 258, 147
- Birkinshaw & Worrall (1993) Birkinshaw, M., & Worrall, D. M. 1993, ApJ, 412, 568
- Boller et al. (2002) Boller, T., Gallo, L. C., Lutz, D., & Sturm, E. 2002, MNRAS, 336, 1143
- Boller et al. (2003) Boller, T., Keil, R., Hasinger, G., Costantini, E., Fujimoto, R., Anabuki, N., Lehmann, I., & Gallo, L. 2003, A&A, 411, 63
- Braatz et al. (1997) Braatz, J. A., Wilson, A. S., & Henkel, C. 1997, ApJS, 110, 321
- Carilli & Taylor (2000) Carilli, C. L., & Taylor, G. B. 2000, ApJ, 532, L95
- Cappellari et al. (2002) Cappellari, M., Verolme, E. K., van der Marel, R. P., Kleijn, G. A. V., Illingworth, G. D., Franx, M., Carollo, C. M., & de Zeeuw, P. T. 2002, ApJ, 578, 787
- Cappi et al. (2006) Cappi, M., Panessa, F., Bassani, L., et al. 2006, A&A, 446, 459
- Carrillo et al. (1999) Carrillo, R., Masegosa, J., Dultzin-Hacyan, D., & Ordoñez, R. 1999, Revista Mexicana de Astronomia y Astrofisica, 35, 187
- Ceballos & Barcons (1996) Ceballos, M. T., & Barcons, X. 1996, MNRAS, 282, 493
- Cid Fernandes et al. (2004) Cid Fernandes, R., Gonzalez Delgado, R. M., Schmitt, H., et al., et al. 2004, ApJ, 605, 105
- Chiaberge et al. (2003) Chiaberge, M., Gilli, R., Macchetto, F. D., Sparks, W. B., & Capetti, A. 2003, ApJ, 582, 645
- Chiaberge et al. (2003) Chiaberge, M., Gilli, R., Capetti, A., & Macchetto, F. D. 2003, ApJ, 597, 166
- Chiaberge et al. (2005) Chiaberge, M., Capetti, A., & Macchetto, F. D. 2005, ApJ, 625, 716
- Colbert & Mushotzky (1999) Colbert, E. J. M., & Mushotzky, R. F. 1999, ApJ, 519, 89
- Cole et al. (1999) Cole, G. H. J., Pedlar, A., Holloway, A. J., & Mundell, C. G. 1999, MNRAS, 310, 1033
- Cowan et al. (1994) Cowan, J. J., Romanishin, W., & Branch, D. 1994, ApJ, 436, L139
- Crawford et al. (2005) Crawford, C. S., Sanders, J. S., & Fabian, A. C. 2005, MNRAS, 361, 17
- David et al. (2005) David, L. P., Jones, C., Forman, W., & Murray, S. S. 2005, ApJ, 635, 1053
- Dewangan et al. (2004) Dewangan, G. C., Griffiths, R. E., Di Matteo, T., & Schurch, N. J. 2004, ApJ, 607, 788
- Dewangan et al. (2005) Dewangan, G. C., Griffiths, R. E., Choudhury, M., Miyaji, T., & Schurch, N. J. 2005, ApJ, 635, 198
- Dickey & Lockman (1990) Dickey, J. M., & Lockman, F. J. 1990, ARA&A, 28, 215
- Di Matteo et al. (2000) Di Matteo, T., Quataert, E., Allen, S. W., Narayan, R., & Fabian, A. C. 2000, MNRAS, 311, 507
- Donato et al. (2004) Donato, D., Sambruna, R. M., & Gliozzi, M. 2004, ApJ, 617, 915
- Donato et al. (2005) Donato, D., Sambruna, R. M., & Gliozzi, M. 2005, A&A, 433, 1163
- Dopita & Sutherland (1996) Dopita, M. A., & Sutherland, R. S. 1996, ApJS, 102, 161
- Drinkwater et al. (1997) Drinkwater, M. J., Francis, P. J., & Webster, R. L. 1997, ASP Conf. Ser. 113: IAU Colloq. 159: Emission Lines in Active Galaxies: New Methods and Techniques, 113, 437
- Dudik et al. (2005) Dudik, R. P., Satyapal, S., Gliozzi, M., & Sambruna, R. M. 2005, ApJ, 620, 113
- Eracleous et al. (2002) Eracleous, M., Shields, J. C., Chartas, G., & Moran, E. C. 2002, ApJ, 565, 108
- Erwin & Sparke (1999) Erwin, P., & Sparke, L. S. 1999, ApJ, 521, L37
- Evans et al. (2005) Evans, D. A., Hardcastle, M. J., Croston, J. H., Worrall, D. M., & Birkinshaw, M. 2005, MNRAS, 359, 363
- Fabbiano et al. (2003) Fabbiano, G., Elvis, M., Markoff, S., et al. 2003, ApJ, 588, 175
- Fabbiano (2005) Fabbiano, G. 2005, ArXiv Astrophysics e-prints, arXiv:astro-ph/0511276
- Fabian (1979) Fabian, A. C. 1979, Royal Society of London Proceedings Series A, 366, 449
- Falcke et al. (2000) Falcke, H., Nagar, N. M., Wilson, A. S., & Ulvestad, J. S. 2000, ApJ, 542, 197
- Ferland & Netzer (1983) Ferland, G. J., & Netzer, H. 1983, ApJ, 264, 105
- Ferrarese et al. (2000) Ferrarese, L., Ford, H. C., Huchra, J. et al. 2000, ApJS, 128, 431
- Filho et al. (2000) Filho, M. E., Barthel, P. D., & Ho, L. C. 2000, ApJS, 129, 93
- Filho et al. (2002) Filho, M. E., Barthel, P. D., & Ho, L. C. 2002, ApJS, 142, 223
- Filho et al. (2004) Filho, M. E., Fraternali, F., Markoff, S., Nagar, N. M., Barthel, P. D., Ho, L. C., & Yuan, F. 2004, A&A, 418, 429
- Filippenko & Halpern (1984) Filippenko, A. V., & Halpern, J. P. 1984, ApJ, 285, 458
- Filippenko & Terlevich (1992) Filippenko, A. V., & Terlevich, R. 1992, ApJ, 397, L79
- Finoguenov & Jones (2001) Finoguenov, A., & Jones, C. 2001, ApJ, 547, L107
- Forman et al. (2005) Forman, W., Nulsen, P., Heinz, S., et al. 2005, ApJ, 635, 894
- Fosbury et al. (1978) Fosbury, R. A. E., Mebold, U., Goss, W. M., & Dopita, M. A. 1978, MNRAS, 183, 549
- Franceschini et al. (2003) Franceschini, A., Braito, V., Persic, M., et al. 2003, MNRAS, 343, 1181
- Gallo et al. (2006) Gallo, L. C., Lehmann, I., Pietsch, W., Boller, T., Brinkmann, W., Friedrich, P., & Grupe, D. 2006, MNRAS, 365, 688
- Georgantopoulos et al. (2002) Georgantopoulos, I., Panessa, F., Akylas, A., Zezas, A., Cappi, M., & Comastri, A. 2002, A&A, 386, 60
- Georgantopoulos & Zezas (2003) Georgantopoulos, I., & Zezas, A. 2003, ApJ, 594, 704
- George et al. (2001) George, I. M., et al. 2001, ApJ, 559, 167
- Gliozzi et al. (2003) Gliozzi, M., Sambruna, R. M., & Brandt, W. N. 2003, A&A, 408, 949
- Gliozzi et al. (2004) Gliozzi, M., Sambruna, R. M., Brandt, W. N., Mushotzky, R., & Eracleous, M. 2004, A&A, 413, 139
- Gondoin et al. (2004) Gondoin, P., Orr, A., & Siddiqui, H. 2004, A&A, 420, 905
- González Delgado et al. (1998) González Delgado, R. M., Heckman, T., Leitherer, C., Meurer, G., Krolik, J., Wilson, A. S., Kinney, A., & Koratkar, A. 1998, ApJ, 505, 174
- González Delgado et al. (2004) González Delgado, R. M., Cid Fernandes, R., Pérez, E., Martins, L. P., Storchi-Bergmann, T., Schmitt, H., Heckman, T., & Leitherer, C. 2004, ApJ, 605, 127
- Goudfrooij et al. (1994) Goudfrooij, P., Hansen, L., Jorgensen, H. E., Norgaard-Nielsen, H. U., de Jong, T., & van den Hoek, L. B. 1994, A&AS, 104, 179
- Granato et al. (1997) Granato, G. L., Danese, L., & Franceschini, A. 1997, Memorie della Societa Astronomica Italiana, 68, 39
- Griffiths et al. (2000) Griffiths, R. E., Ptak, A., Feigelson, E. D., Garmire, G., Townsley, L., Brandt, W. N., Sambruna, R., & Bregman, J. N. 2000, Science, 290, 1325
- Grimes et al. (2005) Grimes, J. P., Heckman, T., Strickland, D., & Ptak, A. 2005, ApJ, 628, 187
- Grimm et al. (2005) Grimm, H.-J., McDowell, J., Zezas, A., Kim, D.-W., & Fabbiano, G. 2005, ApJS, 161, 271
- Guainazzi et al. (2000) Guainazzi, M., Oosterbroek, T., Antonelli, L. A., & Matt, G. 2000, A&A, 364, L80
- Guainazzi et al. (2003) Guainazzi, M., Grandi, P., Comastri, A., & Matt, G. 2003, A&A, 410, 131
- Guainazzi et al. (2005) Guainazzi, M., Matt, G., & Perola, G. C. 2005, A&A, 444, 119
- Halpern & Steiner (1983) Halpern, J. P., & Steiner, J. E. 1983, ApJ, 269, L37
- Hasinger et al. (2001) Hasinger, G., Altieri, B., Arnaud, M., et al. 2001, A&A, 365, L45
- Hawley & Phillips (1980) Hawley, S. A., & Phillips, M. M. 1980, ApJ, 235, 783
- Heckman (1980) Heckman, T. M. 1980, A&A, 87, 152
- Heckman et al. (1980) Heckman, T. M., Crane, P. C., & Balick, B. 1980, A&AS, 40, 295
- Heinke et al. (2005) Heinke, C. O., Grindlay, J. E., Edmonds, P. D., Cohn, H. N., Lugger, P. M., Camilo, F., Bogdanov, S., & Freire, P. C. 2005, ApJ, 625, 796
- Ho et al. (1997) Ho, L. C., Filippenko, A. V., & Sargent, W. L. W. 1997, ApJS, 112, 315
- Ho et al. (2001) Ho, L. C., et al. 2001, ApJ, 549, L51
- Ho & Ulvestad (2001) Ho, L. C., & Ulvestad, J. S. 2001, ApJS, 133, 77
- Imanishi et al. (2003) Imanishi, M., Terashima, Y., Anabuki, N., & Nakagawa, T. 2003, ApJ, 596, L167
- Ishisaki et al. (1996) Ishisaki, Y., et al. 1996, PASJ, 48, 237
- Iyomoto et al. (1996) Iyomoto, N., Makishima, K., Fukazawa, Y., Tashiro, M., Ishisaki, Y., Nakai, N., & Taniguchi, Y. 1996, PASJ, 48, 231
- Iwasawa et al. (2000) Iwasawa, K., Fabian, A. C., Almaini, O., Lira, P., Lawrence, A., Hayashida, K., & Inoue, H. 2000, MNRAS, 318, 879
- Jiménez-Bailón et al. (2005) Jiménez-Bailón, E., Piconcelli, E., Guainazzi, M., Schartel, N., Rodríguez-Pascual, P. M., & Santos-Lleó, M. 2005, A&A, 435, 449
- Jones et al. (2002) Jones, C., Forman, W., Vikhlinin, A., Markevitch, M., David, L., Warmflash, A., Murray, S., & Nulsen, P. E. J. 2002, ApJ, 567, L115
- Kadler et al. (2004) Kadler, M., Kerp, J., Ros, E., Falcke, H., Pogge, R. W., & Zensus, J. A. 2004, A&A, 420, 467
- Karachentsev & Drozdovsky (1998) Karachentsev, I. D., & Drozdovsky, I. O. 1998, A&AS, 131, 1
- Kataoka & Stawarz (2005) Kataoka, J., & Stawarz, Ł. 2005, ApJ, 622, 797
- Keel (1980) Keel, W. C. 1980, AJ, 85, 198
- Khosroshahi et al. (2004) Khosroshahi, H. G., Jones, L. R., & Ponman, T. J. 2004, MNRAS, 349, 1240
- Komossa et al. (2003) Komossa, S., Burwitz, V., Hasinger, G., Predehl, P., Kaastra, J. S., & Ikebe, Y. 2003, ApJ, 582, L15
- Körding et al. (2005) Körding, E., Colbert, E., & Falcke, H. 2005, A&A, 436, 427
- Laine et al. (1999) Laine, S., Knapen, J. H., Perez-Ramirez, D., Doyon, R., & Nadeau, D. 1999, MNRAS, 302, L33
- Lawrence & Elvis (1982) Lawrence, A., & Elvis, M. 1982, ApJ, 256, 410
- Leighly (1999) Leighly, K. M. 1999, ApJS, 125, 297
- Levenson et al. (2005) Levenson, N. A., Weaver, K. A., Heckman, T. M., Awaki, H., & Terashima, Y. 2005, ApJ, 618, 167
- Liu & Bregman (2005) Liu, J.-F., & Bregman, J. N. 2005, ApJS, 157, 59
- Loewenstein et al. (2001) Loewenstein, M., Mushotzky, R. F., Angelini, L., Arnaud, K. A., & Quataert, E. 2001, ApJ, 555, L21
- Machacek et al. (2004) Machacek, M. E., Jones, C., & Forman, W. R. 2004, ApJ, 610, 183
- Maiolino (2001) Maiolino, R. 2001, AIP Conf. Proc. 599: X-ray Astronomy: Stellar Endpoints, AGN, and the Diffuse X-ray Background, 599, 199
- Maoz et al. (2005) Maoz, D., Nagar, N. M., Falcke, H., & Wilson, A. S. 2005, ApJ, 625, 699
- Marquez & Moles (1996) Marquez, I., & Moles, M. 1996, A&AS, 120, 1
- Márquez et al. (2003) Márquez, I., Masegosa, J., Durret, F., González Delgado, R. M., Moles, M., Maza, J., Pérez, E., & Roth, M. 2003, A&A, 409, 459
- Masegosa & Márquez (2003) Masegosa, J., & MÁrquez, I. 2003, Ap&SS, 284, 483
- Moran et al. (2005) Moran, E. C., Eracleous, M., Leighly, K. M., Chartas, G., Filippenko, A. V., Ho, L. C., & Blanco, P. R. 2005, AJ, 129, 2108
- Mateos et al. (2005) Mateos, S., Barcons, X., Carrera, F. J., Ceballos, M. T., Hasinger, G., Lehmann, I., Fabian, A. C., & Streblyanska, A. 2005, A&A, 444, 79
- Nagar et al. (2000) Nagar, N. M., Falcke, H., Wilson, A. S., & Ho, L. C. 2000, ApJ, 542, 186
- Nagar et al. (2002) Nagar, N. M., Falcke, H., Wilson, A. S., & Ulvestad, J. S. 2002, A&A, 392, 53
- Nagar et al. (2005) Nagar, N. M., Falcke, H., & Wilson, A. S. 2005, A&A, 435, 521
- O’Neill et al. (2006) O’Neill, P. M., Kaspi, S., Laor, A., Nandra, K., Moran, E. C., Paterson, B. M., Desroches, L-B., Filippenko A. V., Ho, L. C. & Maoz, D. 2006, ApJ accepted, astro-ph/0603312.
- O’Sullivan et al. (2001) O’Sullivan, E., Forbes, D. A., & Ponman, T. J. 2001, MNRAS, 328, 461
- O’Sullivan & Ponman (2004) O’Sullivan, E., & Ponman, T. J. 2004, MNRAS, 349, 535
- O’Sullivan et al. (2005) O’Sullivan, E., Vrtilek, J. M., & Kempner, J. C. 2005, ApJ, 624, L77
- Ott et al. (2003) Ott, J., Martin, C. L., & Walter, F. 2003, ApJ, 594, 776
- Ott et al. (2005) Ott, J., Walter, F., & Brinks, E. 2005, MNRAS, 358, 1453
- Pellegrini (1994) Pellegrini, S. 1994, A&A, 292, 395
- Pellegrini et al. (2003) Pellegrini, S., Baldi, A., Fabbiano, G., & Kim, D.-W. 2003, ApJ, 597, 175
- Pogge et al. (2000) Pogge, R. W., Maoz, D., Ho, L. C., & Eracleous, M. 2000, ApJ, 532, 323
- Ptak et al. (1999) Ptak, A., Serlemitsos, P., Yaqoob, T., & Mushotzky, R. 1999, ApJS, 120, 179
- Ptak et al. (2003) Ptak, A., Heckman, T., Levenson, N. A., Weaver, K., & Strickland, D. 2003, ApJ, 592, 782
- Raymond & Smith (1977) Raymond, J. C., & Smith, B. W. 1977, ApJS, 35, 419
- Read et al. (1997) Read, A. M., Ponman, T. J., & Strickland, D. K. 1997, MNRAS, 286, 626
- Read (2003) Read, A. M. 2003, MNRAS, 342, 715
- Rinn et al. (2005) Rinn, A. S., Sambruna, R. M., & Gliozzi, M. 2005, ApJ, 621, 167
- Risaliti et al. (2000) Risaliti, G., Gilli, R., Maiolino, R., & Salvati, M. 2000, A&A, 357, 13
- Roberts et al. (1999) Roberts, T. P., Warwick, R. S., & Ohashi, T. 1999, MNRAS, 304, 52
- Roberts & Warwick (2000) Roberts, T. P., & Warwick, R. S. 2000, MNRAS, 315, 98
- Sambruna (2003) Sambruna, R. M. 2003, New Astronomy Review, 47, 457
- Sarzi et al. (2001) Sarzi, M., Rix, H.-W., Shields, J. C., Rudnick, G., Ho, L. C., McIntosh, D. H., Filippenko, A. V., & Sargent, W. L. W. 2001, ApJ, 550, 65
- Satyapal et al. (2004) Satyapal, S., Sambruna, R. M., & Dudik, R. P. 2004, A&A, 414, 825
- Satyapal et al. (2005) Satyapal, S., Dudik, R. P., O’Halloran, B., & Gliozzi, M. 2005, ApJ, 633, 86
- Shields (1992) Shields, J. C. 1992, ApJ, 399, L27
- Shih et al. (2003) Shih, D. C., Iwasawa, K., & Fabian, A. C. 2003, MNRAS, 341, 973
- Smith et al. (2003) Smith, B. J., Nowak, M., Donahue, M., & Stocke, J. 2003, AJ, 126, 1763
- Sofue et al. (1994) Sofue, Y., Yoshida, S., Aoki, T., Soyano, T., Tarusawa, K., Hamabe, M., & Wakamatsu, K.-I. 1994, PASJ, 46, 1
- Soria & Motch (2004) Soria, R., & Motch, C. 2004, A&A, 422, 915
- Soria et al. (2006) Soria, R., Fabbiano, G., Graham, A. W., Baldi, A., Elvis, M., Jerjen, H., Pellegrini, S., & Siemiginowska, A. 2006, ApJ, 640, 126
- Soria et al. (2006) Soria, R., Graham, A. W., Fabbiano, G., Baldi, A., Elvis, M., Jerjen, H., Pellegrini, S., & Siemiginowska, A. 2006, ApJ, 640, 143
- Stauffer (1982) Stauffer, J. R. 1982, AJ, 87, 1507
- Stockdale et al. (1998) Stockdale, C. J., Romanishin, W., & Cowan, J. J. 1998, ApJ, 508, L33
- Streblyanska et al. (2005) Streblyanska, A., Hasinger, G., Finoguenov, A., Barcons, X., Mateos, S., & Fabian, A. C. 2005, A&A, 432, 395
- Strickland et al. (2004) Strickland, D. K., Heckman, T. M., Colbert, E. J. M., Hoopes, C. G., & Weaver, K. A. 2004, ApJS, 151, 193
- Sudou et al. (2001) Sudou, H., Taniguchi, Y., Kaburaki, O., Ohyama, Y., Kameno, S., Sawada-Satoh, S., Inoue, M., & Sasao, T. 2001, IAU Symposium, 205, 144
- Taylor et al. (2006) Taylor, G. B., Sanders, J. S., Fabian, A. C., & Allen, S. W. 2006, MNRAS, 365, 705
- Teng et al. (2005) Teng, S. H., Wilson, A. S., Veilleux, S., Young, A. J., Sanders, D. B., & Nagar, N. M. 2005, ApJ, 633, 664
- Terashima et al. (1998) Terashima, Y., Kunieda, H., Serlemitsos, P. J., & Ptak, A. 1998, IAU Symp. 188: The Hot Universe, 188, 444
- Terashima (1999) Terashima, Y. 1999, Advances in Space Research, 23, 851
- Terashima et al. (2000) Terashima, Y., Ho, L. C., Ptak, A. F., Mushotzky, R. F., Serlemitsos, P. J., Yaqoob, T., & Kunieda, H. 2000, ApJ, 533, 729
- Terashima et al. (2002) Terashima, Y., Iyomoto, N., Ho, L. C., & Ptak, A. F. 2002, ApJS, 139, 1
- Terashima & Wilson (2003) Terashima, Y., & Wilson, A. S. 2003, ApJ, 583, 145
- Terlevich & Melnick (1985) Terlevich, R., & Melnick, J. 1985, MNRAS, 213, 841
- Thuan (1984) Thuan, T. X. 1984, ApJ, 281, 126
- Tonry et al. (2001) Tonry, J. L., Dressler, A., Blakeslee, J. P., Ajhar, E. A., Fletcher, A. B., Luppino, G. A., Metzger, M. R., & Moore, C. B. 2001, ApJ, 546, 681
- Trinchieri & Goudfrooij (2002) Trinchieri, G., & Goudfrooij, P. 2002, A&A, 386, 472
- Tschöke et al. (1999) Tschöke, D., Hensler, G., & Junkes, N. 1999, A&A, 343, 373
- Tully et al. (1998) Tully R.B., 1998, Nearby Galaxies Catalog (Cambridge: Cambridge Univ. Press)
- Turner et al. (1997) Turner, T. J., George, I. M., Nandra, K., & Mushotzky, R. F. 1997, ApJS, 113, 23
- Turner et al. (2001) Turner, M. J. L., Reeves, J. N., Ponman, T. J., et al. 2001, A&A, 365, L110
- Vaughan et al. (2005) Vaughan, S., Iwasawa, K., Fabian, A. C., & Hayashida, K. 2005, MNRAS, 356, 524
- Veilleux & Osterbrock (1987) Veilleux, S., & Osterbrock, D. E. 1987, ApJS, 63, 295
- Veilleux et al. (1999) Veilleux, S., Sanders, D. B., & Kim, D.-C. 1999, ApJ, 522, 139
- Veron et al. (1981) Veron, P., Veron, M. P., Bergeron, J., & Zuidervijk, E. J. 1981, A&A, 97, 71
- Vignati et al. (1999) Vignati, P., Molendi, S., Matt, G., et al. 1999, A&A, 349, L57
- Worrall et al. (2003) Worrall, D. M., Birkinshaw, M., & Hardcastle, M. J. 2003, MNRAS, 343, L73
- Wrobel & Heeschen (1991) Wrobel, J. M., & Heeschen, D. S. 1991, AJ, 101, 148
- Xia et al. (2002) Xia, X. Y., Xue, S. J., Mao, S., Boller, T., Deng, Z. G., & Wu, H. 2002, ApJ, 564, 196
- Xu et al. (2002) Xu, H., Kahn, S. M., Peterson, J. R., et al. 2002, ApJ, 579, 600
- Xu et al. (2005) Xu, Y., Xu, H., Zhang, Z., Kundu, A., Wang, Y., & Wu, X.-P. 2005, ApJ, 631, 809
- Zezas & Fabbiano (2002) Zezas, A., & Fabbiano, G. 2002, ApJ, 577, 726
- Zezas et al. (2005) Zezas, A., Birkinshaw, M., Worrall, D. M., Peters, A., & Fabbiano, G. 2005, ApJ, 627, 711
| X-ray Position | X-ray | Offset | X-ray Obs. | Optical/HST Obs. | |||||
| Name (1) | Radii (4) | 2MASS (5) | Obs.ID (6) | Expt. (7) | Filter (8) | Prop. ID (9) | Expt. (10) | ||
| (2000) | (2000) | (arcsec) | (arcsec) | (ks) | (s) | ||||
| NGC 0315 | 00 57 48.9 | +30 21 08.7 | 1.968 | 0.81 | 4156 | 52.3 | F814W | 6673 | 460 |
| ARP 318A | 02 09 38.5 | 10 08 45.4 | 4.920 | 1.26 | 923 | 12.5 | … | … | … |
| ARP 318B | 02 09 42.7 | 10 11 02.2 | 2.952 | 0.54 | 923 | 12.5 | … | … | … |
| NGC 1052 | 02 41 04.8 | 08 15 20.6 | 1.476 | 0.57 | 385 | 10.9 | F555W | 3639 | 1000 |
| NGC 2681 | 08 53 32.8 | +51 18 48.8 | 2.460 | 0.83 | 2060 | 78.3 | F555W | 4854 | 1000 |
| UGC 05101 | 09 35 51.7 | +61 21 11.1 | 2.952 | 0.61 | 2033 | 48.2 | F814W | 6346 | 800 |
| NGC 3226 | 10 23 27.0 | +19 53 54.6 | 1.476 | 0.26 | 860 | 46.3 | F702W | 6357 | 1000 |
| NGC 3245 | 10 27 18.3 | +28 30 27.2 | 1.968 | 0.59 | 2926 | 9.6 | F702W | 7403 | 140 |
| NGC 3379 | 10 47 49.6 | +12 34 53.7 | 1.968 | 0.20 | 1587 | 31.3 | F814W | 5512 | 1340 |
| NGC 3507 | 11 03 25.3 | +18 08 07.3 | 2.460 | 1.27 | 3149 | 38.0 | F606W | 5446 | 160 |
| NGC 3607 | 11 16 54.6 | +18 03 04.4 | 2.952 | 2.22 | 2073 | 38.4 | F814W | 5999 | 320 |
| NGC 3608 | 11 16 58.9 | +18 08 53.7 | 1.968 | 1.53 | 2073 | 38.4 | F814W | 5454 | 460 |
| NGC 3628 | 11 20 16.9 | +13 35 22.8 | 2.952 | 1.60 | 2039 | 54.8 | … | … | … |
| NGC 3690B | 11 28 30.9 | +58 33 40.5 | 3.198 | 2.64 | 1641 | 24.3 | F814W | 8602 | 700 |
| NGC 4111 | 12 07 03.1 | +43 03 57.3 | 2.952 | 1.95 | 1578 | 14.8 | F702W | 6785 | 600 |
| NGC 4125 | 12 08 06.0 | +65 10 27.6 | 2.460 | 0.81 | 2071 | 61.9 | F814W | 6587 | 2100 |
| NGC 4261 | 12 19 23.2 | +05 49 30.4 | 3.444 | 1.49 | 834 | 31.3 | F702W | 5476 | 280 |
| NGC 4314 | 12 22 32.1 | +29 53 44.8 | 5.904 | 2.71 | 2062 | 14.5 | F814W | 6265 | 600 |
| NGC 4374 | 12 25 03.7 | +12 53 13.2 | 1.476 | 0.90 | 803 | 28.2 | F814W | 6094 | 520 |
| NGC 4395 | 12 25 48.9 | +33 32 48.4 | 1.476 | 0.78 | 5301 | 26.3 | F814W | 6464 | 2160 |
| NGC 4410A | 12 26 28.2 | +09 01 10.8 | 1.968 | 1.00 | 2982 | 34.8 | F606W | 5479 | 500 |
| NGC 4438 | 12 27 45.6 | +13 00 33.0 | 2.952 | 2.26 | 2883 | 24.6 | F814W | 6791 | 1050 |
| NGC 4457 | 12 28 59.0 | +03 34 14.3 | 2.952 | 0.45 | 3150 | 35.6 | … | … | … |
| NGC 4459 | 12 29 00.0 | +13 58 41.7 | 1.968 | 1.17 | 2927 | 9.8 | F814W | 5999 | 320 |
| NGC 4486 | 12 30 49.4 | +12 23 28.3 | 2.460 | 0.35 | 2707 | 98.7 | F814W | 6775 | 1480 |
| NGC 4494 | 12 31 24.1 | +25 46 29.8 | 1.968 | 0.94 | 2079 | 15.8 | F814W | 6554 | 1800 |
| NGC 4552 | 12 35 39.8 | +12 33 23.3 | 2.460 | 1.91 | 2072 | 54.3 | F814W | 6099 | 1500 |
| NGC 4579 | 12 37 43.5 | +11 49 05.5 | 1.968 | 1.53 | 807 | 30.6 | F791W | 6436 | 600 |
| NGC 4594 | 12 39 59.4 | 11 37 23.0 | 1.476 | 0.71 | 1586 | 18.5 | F814W | 5512 | 1470 |
| NGC 4596 | 12 39 56.0 | +10 10 35.3 | 3.690 | 1.61 | 2928 | 9.2 | F606W | 5446 | 160 |
| NGC 4636 | 12 42 49.8 | +02 41 15.9 | 2.214 | … | 4415 | 74.1 | F814W | 8686 | 400 |
| NGC 4676A | 13 30 03.3 | +47 12 41.4 | 3.936 | 1.31 | 2043 | 27.9 | F814W | 8669 | 320 |
| NGC 4676B | 13 30 04.6 | +47 12 08.9 | 3.936 | … | 2043 | 27.9 | F814W | 8669 | 320 |
| NGC 4696 | 12 48 48.8 | 41 18 43.3 | 3.936 | 7.51 | 1560 | 47.7 | F814W | 8683 | 1000 |
| NGC 4698 | 12 48 22.9 | +08 29 14.6 | 2.214 | 0.71 | 3008 | 29.4 | F814W | 9042 | 460 |
| NGC 4736 | 12 50 53.1 | +41 07 13.2 | 1.476 | 0.82 | 808 | 46.4 | F814W | 9042 | 460 |
| NGC 5055 | 13 15 49.2 | +42 01 45.9 | 1.476 | 1.33 | 2197 | 27.7 | F814W | 9042 | 460 |
| NGC 5194 | 13 29 52.8 | +47 11 40.4 | 3.444 | 2.87 | 3932 | 45.2 | … | … | … |
| MRK 0266NE | 13 38 17.9 | +48 16 41.1 | 1.968 | 0.84 | 2044 | 17.4 | F606W | 5479 | 500 |
| UGC 08696 | 13 44 42.1 | +55 53 13.1 | 1.968 | 0.66 | 809 | 40.4 | F814W | 8645 | 800 |
| CGCG 162-010 | 13 48 52.5 | +26 35 36.3 | 3.936 | 1.59 | 493 | 19.6 | F702W | 5212 | 300 |
| NGC 5746 | 14 44 56.0 | +01 57 18.1 | 1.476 | 1.06 | 3929 | 36.8 | F814W | 9046 | 800 |
| NGC 5846 | 15 06 29.2 | +01 36 19.6 | 4.920 | 1.13 | 4009 | 24.0 | F814W | 5920 | 2300 |
| NGC 5866 | 15 06 29.5 | +55 45 46.1 | 4.428 | 2.22 | 2879 | 31.9 | … | … | … |
| NGC 6251 | 16 32 31.9 | +82 32 15.7 | 1.968 | 1.68 | 847 | 25.4 | F814W | 6653 | 1000 |
| NGC 6240 | 16 52 58.9 | +02 24 02.6 | 1.680 | 0.99 | 1590 | 36.7 | F814W | 6430 | 1200 |
| IRAS 17208-0014 | 17 23 22.0 | +00 17 00.6 | 2.460 | 1.04 | 2035 | 48.4 | F814W | 6346 | 800 |
| NGC 6482 | 17 51 48.8 | +23 04 18.9 | 2.460 | 0.46 | 3218 | 19.1 | … | … | … |
| NGC 7130 | 21 48 19.5 | 34 57 05.0 | 1.968 | 0.73 | 2188 | 36.9 | F606W | 5479 | 1900 |
| NGC 7331 | 22 37 04.0 | +34 24 56.0 | 1.968 | 1.75 | 2198 | 29.5 | F814W | 7450 | 170 |
| IC 1459 | 22 57 10.6 | 36 27 43.6 | 2.952 | 1.81 | 2196 | 51.8 | F814W | 5454 | 460 |
| Name (1) | z (2) | Dist. (3) | Spatial Scale (4) | Source radii (5) | B (6) | E(B-V) (7) | Morph. Type (8) |
|---|---|---|---|---|---|---|---|
| (pc/arcsec) | (pc) | ||||||
| NGC 0315 | 0.016465 | 65.8(b) | 319.0 | 627.8 | 12.2 | 0.065 | E |
| ARP 318A | 0.013586 | 54.3(b) | 263.3 | 1295.4 | 12.91 | 0.025 | SAB(r)ab;pec |
| ARP 318B | 0.012889 | 54.3(b) | 263.3 | 777.3 | 13.69 | 0.025 | (R’)Sa;pec |
| NGC 1052 | 0.004903 | 19.4(c) | 94.1 | 138.9 | 11.41 | 0.027 | E4 |
| NGC 2681 | 0.002308 | 17.2(c) | 83.4 | 205.2 | 11.09 | 0.023 | (R’)SAB(rs)0/a |
| UGC 05101 | 0.039390 | 157.3(b) | 762.6 | 2251.2 | 15.2 | 0.033 | S? |
| NGC 3226 | 0.003839 | 23.6(c) | 114.4 | 168.9 | 12.3 | 0.023 | E2;pec |
| NGC 3245 | 0.004530 | 20.9(c) | 101.3 | 199.4 | 11.7 | 0.025 | SA(r)0 |
| NGC 3379 | 0.003069 | 10.6(c) | 51.4 | 101.2 | 10.24 | 0.024 | E1 |
| NGC 3507 | 0.003266 | 19.8(d) | 96.0 | 236.2 | 11.73 | 0.024 | SB(s)b |
| NGC 3607 | 0.003119 | 22.8(c) | 110.5 | 326.2 | 10.82 | 0.021 | SA(s)0 |
| NGC 3608 | 0.003696 | 22.9(c) | 111.0 | 218.4 | 11.7 | 0.021 | E2 |
| NGC 3628 | 0.002812 | 7.7(d) | 37.3 | 110.1 | 14.8 | 0.027 | Sb;pec;sp |
| NGC 3690B | 0.010411 | 41.6(b) | 201.7 | 645.0 | … | 0.017 | GPair |
| NGC 4111 | 0.002692 | 15.0(c) | 72.7 | 214.6 | 11.63 | 0.015 | SA(r)0+:;sp |
| NGC 4125 | 0.004523 | 23.9(c) | 115.9 | 285.1 | 10.65 | 0.019 | E6;pec |
| NGC 4261 | 0.007372 | 29.4(c) | 142.5 | 490.8 | 11.41 | 0.018 | E2-3 |
| NGC 4314 | 0.003212 | 9.7(d) | 47.0 | 277.5 | 11.43 | 0.025 | SB(rs)a |
| NGC 4374 | 0.003336 | 18.4(c) | 89.2 | 131.7 | 12.1 | 0.040 | I |
| NGC 4395 | 0.001064 | 4.2(e) | 20.4 | 30.1 | 10.64 | 0.017 | SA(s)m |
| NGC 4410A | 0.025174 | 100.5(b) | 487.2 | 958.8 | 14.92 | 0.024 | S0;pec |
| NGC 4438 | 0.000237 | 16.8(d) | 81.4 | 240.3 | 11.02 | 0.028 | SA(s)0/a;p: |
| NGC 4457 | 0.002942 | 17.4(d) | 84.4 | 249.1 | 11.76 | 0.022 | (R)SAB(s)0/a |
| NGC 4459 | 0.004036 | 16.1(c) | 78.1 | 153.7 | 11.32 | 0.046 | SA(r)0+ |
| NGC 4486 | 0.004276 | 16.1(c) | 78.1 | 192.1 | 9.59 | 0.022 | E+0-1;pec |
| NGC 4494 | 0.004416 | 17.1(c) | 82.9 | 163.1 | 10.71 | 0.021 | E1-2 |
| NGC 4552 | 0.001071 | 15.4(c) | 74.7 | 183.8 | 10.73 | 0.041 | E |
| NGC 4579 | 0.005067 | 16.8(d) | 81.4 | 160.2 | 10.48 | 0.041 | SAB(rs)b |
| NGC 4594 | 0.003639 | 9.8(c) | 47.5 | 70.1 | 8.98 | 0.051 | SA(s)a |
| NGC 4596 | 0.006251 | 16.8(d) | 81.4 | 300.4 | 11.35 | 0.022 | SB(r)0+ |
| NGC 4636 | 0.003653 | 14.7(c) | 71.3 | 157.9 | 10.43 | 0.028 | E/S0_1 |
| NGC 4676A | 0.022059 | 88.0(b) | 426.6 | 1679.1 | 14.7 | 0.017 | Irr |
| NGC 4676B | 0.022039 | 88.0(b) | 426.6 | 1679.1 | 14.4 | 0.017 | SB(s)0/a;pec |
| NGC 4696 | 0.009867 | 35.5(c) | 172.1 | 677.4 | 11.39 | 0.113 | E+1;pec |
| NGC 4698 | 0.003342 | 16.8(d) | 81.4 | 180.2 | 1.46 | 0.026 | SA(s)ab |
| NGC 4736 | 0.001027 | 5.2(c) | 25.2 | 37.2 | 8.99 | 0.018 | (R)SA(r)ab |
| NGC 5055 | 0.001681 | 7.2(d) | 34.9 | 51.5 | 9.31 | 0.018 | SA(rs)bc |
| NGC 5194 | 0.001544 | 7.7(c) | 37.3 | 128.5 | 8.96 | 0.035 | SA(s)bc;pec |
| MRK 0266NE | 0.028053 | 112.0(b) | 543.0 | 1068.6 | 14.1 | 0.013 | Compact;pec: |
| UGC 08696 | 0.037780 | 150.9(b) | 731.6 | 1439.8 | 15.07 | 0.008 | Ring galaxy |
| CGCG 162-010. . . . . . | 0.063260 | 252.6(b) | 1224.6 | 4820.0 | 15.2 | 0.013 | cD;S0? |
| NGC 5746 | 0.005751 | 29.4(d) | 142.5 | 210.3 | 11.29 | 0.040 | SAB(rs)b?;sp |
| NGC 5846 | 0.006078 | 24.9(c) | 120.7 | 593.8 | 11.05 | 0.055 | E0-1 |
| NGC 5866 | 0.002242 | 15.4(c) | 74.7 | 330.8 | 10.74 | 0.013 | S0_3 |
| NGC 6251 | 0.023016 | 91.9(b) | 445.5 | 876.7 | 13.64 | 0.087 | E |
| NGC 6240 | 0.024480 | 97.8(b) | 474.1 | 796.5 | 13.8 | 0.076 | I0:;pec |
| IRAS 17208-0014 | 0.042810 | 171.0(b) | 829.0 | 2039.3 | 15.1 | 0.344 | … |
| NGC 6482 | 0.013176 | 52.6(b) | 255.0 | 627.3 | 12.35 | 0.099 | E |
| NGC 7130 | 0.016151 | 64.5(b) | 312.7 | 615.4 | 12.98 | 0.029 | Sa;pec |
| NGC 7331 | 0.002739 | 15.1(a) | 73.2 | 144.1 | 10.35 | 0.091 | SA(s)b |
| IC 1459 | 0.005641 | 22.0(d) | 106.7 | 315.0 | 10.97 | 0.016 | E3 |
notes.–Properties are extracted from the Carrillo et al. 1999 and references therein. (a) Ferrarese et al. 2000; (b) from cosmology assuming ; (c) Tonry et al. 2001; (d) Tully R.B. 1998, Nearby Galaxies Catalog (Cambridge: Cambridge Univ. Press); and (e) Karachentsev I.D. & Drodovsky I.O. 1998.
| Name (1) | Model (2) | (3) | (4) | kT (5) | /d.o.f (6) |
|---|---|---|---|---|---|
| (keV) | |||||
| NGC 0315 | RS | 0.23 | … | 63.99 | 285.15/163 |
| ME | 0.22 | … | 79.89 | 284.03/163 | |
| PL | 0.20 | 1.18 | … | 282.77/163 | |
| RS+PL(*) | 0.71 | 1.48 | 0.22 | 188.77/161 | |
| ME+PL | 0.48 | 1.30 | 0.27 | 213.89/161 | |
| NGC 2681 | RS | 0.51 | … | 0.64 | 78.02/28 |
| ME | 0.45 | … | 0.58 | 77.75/28 | |
| PL | 0.28 | 3.68 | … | 82.58/28 | |
| RS+PL | 0.04 | 1.68 | 0.76 | 9.40/26 | |
| ME+PL(*) | 0.08 | 1.74 | 0.66 | 13.94/26 | |
| NGC 3690B | RS | 0.79 | … | 1.40 | 118.70/25 |
| ME | 1.09 | … | 1.10 | 112.04/25 | |
| PL(*) | 0.02 | 1.45 | … | 21.81/25 | |
| RS+PL | 0.10 | 1.45 | 0.98 | 20.28/23 | |
| ME+PL | 0.07 | 1.43 | 1.08 | 20.13/23 | |
| NGC 4374 | RS | 0.97 | … | 0.64 | 168.94/33 |
| ME | 0.93 | … | 0.62 | 179.05/33 | |
| PL(*) | 0.14 | 2.07 | … | 32.20/33 | |
| RS+PL | 0.12 | 1.80 | 0.77 | 18.76/31 | |
| ME+PL | 0.14 | 1.83 | 0.64 | 18.34/31 | |
| NGC 4395 | RS | 2.73 | … | 28.01 | 120.52/106 |
| ME | 2.77 | … | 24.01 | 119.41/106 | |
| PL(*) | 2.87 | 1.44 | … | 123.68/106 | |
| RS+PL | 2.93 | 1.48 | 0.03 | 123.62/104 | |
| ME+PL | 2.97 | 1.51 | 0.08 | 123.69/104 | |
| NGC 4410A | RS | 0.92 | … | 0.60 | 337.45/45 |
| ME | 0.89 | … | 0.58 | 353.98/45 | |
| PL(*) | 0.01 | 1.75 | … | 33.11/45 | |
| RS+PL | 0.01 | 1.69 | 0.58 | 31.21/43 | |
| ME+PL | 0.01 | 1.68 | 0.50 | 30.32/43 | |
| NGC 4438 | RS | 0.43 | … | 0.66 | 68.13/36 |
| ME | 0.41 | … | 0.57 | 53.97/36 | |
| PL | 0.89 | 7.69 | … | 148.92/36 | |
| RS+PL(*) | 0.11 | 2.13 | 0.78 | 32.27/34 | |
| ME+PL | 0.23 | 2.42 | 0.60 | 29.04/34 | |
| NGC 4457 | RS | 0.51 | … | 0.63 | 74.99/20 |
| ME | 0.43 | … | 0.52 | 78.02/20 | |
| PL | 0.32 | 4.08 | … | 68.80/20 | |
| RS+PL(*) | 0.07 | 1.98 | 0.66 | 18.68/18 | |
| ME+PL | 0.13 | 1.96 | 0.53 | 19.23/18 | |
| NGC 4494 | RS | 0.78 | … | 0.61 | 27.90/7 |
| ME | 0.73 | … | 0.56 | 29.40/7 | |
| PL | 0.12 | 2.38 | … | 16.47/7 | |
| RS+PL | 0.01 | 1.13 | 0.82 | 5.03/5 | |
| ME+PL(*) | 0.11 | 1.37 | 0.63 | 5.59/5 | |
| NGC 4552 | RS | 0.75 | … | 0.66 | 354.09/63 |
| ME | 0.71 | … | 0.61 | 368.32/63 | |
| PL | 0.12 | 2.39 | … | 117.28/63 | |
| RS+PL(*) | 0.04 | 1.81 | 0.83 | 57.19/61 | |
| ME+PL | 0.05 | 1.82 | 0.79 | 70.58/61 | |
| NGC 4594 . . | RS | 0.19 | … | 18.77 | 115.89/87 |
| ME | 0.19 | … | 18.49 | 116.02/87 | |
| PL(*) | 0.20 | 1.41 | … | 118.72/87 | |
| RS+PL | 0.22 | 1.41 | 0.45 | 117.65/85 | |
| ME+PL | 0.25 | 1.43 | 0.39 | 117.03/85 | |
| NGC 4696 | RS | 0.37 | … | 0.70 | 26.71/17 |
| ME | 0.35 | … | 0.62 | 24.47/17 | |
| PL(*) | 0.13 | 4.26 | … | 21.98/17 | |
| RS+PL | 0.41 | 4.67 | 0.27 | 19.94/15 | |
| ME+PL | 0.62 | 2.33 | 0.18 | 5.80/15 |
| Name (1) | Model (2) | (3) | (4) | kT (5) | /d.o.f (6) |
|---|---|---|---|---|---|
| (keV) | |||||
| NGC 4736 | RS | 0.82 | … | 0.59 | 635.49/81 |
| ME | 0.71 | … | 0.56 | 673.96/81 | |
| PL | 0.12 | 2.38 | … | 130.19/81 | |
| RS+PL | 0.08 | 2.02 | 0.66 | 71.96/79 | |
| ME+PL(*) | 0.08 | 2.00 | 0.60 | 72.90/79 | |
| NGC 5194 | RS | 0.09 | … | 0.68 | 185.59/50 |
| ME | 0.09 | … | 0.60 | 114.83/50 | |
| PL | 0.82 | 8.00 | … | 340.52/50 | |
| RS+PL | 0.02 | 2.98 | 0.69 | 68.32/48 | |
| ME+PL(*) | 0.03 | 2.67 | 0.61 | 49.74/48 | |
| UGC 08696 | RS | 0.09 | … | 8.72 | 88.79/42 |
| ME | 0.09 | … | 9.51 | 78.50/42 | |
| PL | 0.27 | 2.34 | … | 72.20/42 | |
| RS+PL(*) | 0.39 | 1.74 | 0.75 | 55.63/40 | |
| ME+PL | 0.38 | 1.70 | 0.68 | 56.81/40 | |
| CGCG 162-010 | RS | 0.51 | … | 0.86 | 117.41/63 |
| ME | 0.90 | … | 0.35 | 118.54/63 | |
| PL | 0.39 | 3.99 | … | 83.83/63 | |
| RS+PL(*) | 0.09 | 2.44 | 1.12 | 59.95/61 | |
| ME+PL | 0.12 | 2.71 | 1.33 | 58.43/61 | |
| NGC 5746 | RS | 0.64 | … | 63.97 | 15.91/17 |
| ME | 0.62 | … | 79.90 | 15.90/17 | |
| PL(*) | 0.60 | 1.22 | … | 15.66/17 | |
| RS+PL | 1.13 | 1.51 | 0.11 | 14.81/15 | |
| ME+PL | 0.95 | 1.43 | 0.08 | 15.79/15 | |
| NGC 5846 | RS | 0.16 | … | 0.65 | 80.52/27 |
| ME | 0.25 | … | 0.48 | 45.59/27 | |
| PL | 0.79 | 7.20 | … | 160.99/27 | |
| RS+PL | 0.10 | 2.56 | 0.63 | 38.16/25 | |
| ME+PL(*) | 0.12 | 1.65 | 0.50 | 21.91/25 | |
| NGC 6251 | RS | 0.03 | … | 32.62 | 74.98/64 |
| ME | 0.03 | … | 31.18 | 75.08/64 | |
| PL | 0.05 | 1.36 | … | 73.08/64 | |
| RS+PL | 0.15 | 1.42 | 0.49 | 67.85/62 | |
| ME+PL(*) | 0.44 | 1.60 | 0.26 | 65.27/62 | |
| NGC 6240 | RS | 0.29 | … | 48.10 | 181.56/114 |
| ME | 0.30 | … | 37.87 | 181.24/114 | |
| PL | 0.31 | 1.31 | … | 181.95/114 | |
| RS+PL(*) | 1.11 | 1.03 | 0.76 | 126.79/112 | |
| ME+PL | 1.17 | 1.08 | 0.75 | 133.10/112 | |
| NGC 6482 | RS | 0.30 | … | 0.78 | 15.90/18 |
| ME(*) | 0.31 | … | 0.68 | 16.41/18 | |
| PL | 1.02 | 9.24 | … | 41.40/18 | |
| RS+PL | 0.02 | 2.42 | 0.87 | 13.21/16 | |
| ME+PL | 0.02 | 2.64 | 0.83 | 14.51/16 | |
| NGC 7130 | RS | 0.57 | … | 0.63 | 284.55/59 |
| ME | 0.54 | … | 0.51 | 266.72/59 | |
| PL | 0.32 | 4.23 | … | 192.78/59 | |
| RS+PL(*) | 0.06 | 2.51 | 0.82 | 81.43/57 | |
| ME+PL | 0.12 | 2.74 | 0.67 | 90.75/57 | |
| IC 1459 | RS | 0.06 | … | 7.04 | 341.31/168 |
| ME | 0.06 | … | 7.16 | 335.79/168 | |
| PL | 0.16 | 1.89 | … | 290.02/168 | |
| RS+PL | 0.18 | 1.80 | 0.61 | 193.27/166 | |
| ME+PL(*) | 0.28 | 1.89 | 0.30 | 189.47/166 |
| Mean (1) | Median (2) | Mean Stand Dev. (3) | |
| AGN/SB | AGN/SB | AGN/SB | |
| Log() | 40.16 | 39.78 | 0.96 |
| 40.22/39.93 | 40.07/39.54 | 1.03/0.64 | |
| 0.35 | 0.12 | 0.35 | |
| 0.40/0.15 | 0.14/0.12 | 0.41/0.06 | |
| kT | 0.64 | 0.66 | 0.17 |
| (keV) | 0.59/0.77 | 0.66/0.78 | 0.17/0.18 |
| 1.89 | 1.75 | 0.45 | |
| 1.73/2.62 | 1.74/2.44 | 0.32/0.82 |
| Name (1) | Flux (2) | Log((2.0–10.0) keV) (3) | Ref. (4) | Obscuration (5) | Classif. (6) | HST-Classif. (7) |
|---|---|---|---|---|---|---|
| NGC 0315 | -12.08 | 41.64 | (f) | SF+CD | AGN | C |
| ARP 318A | -13.24 | 39.48 | (e) | SB | ||
| ARP 318B | -13.32 | 40.20 | (e) | CD | SB | |
| NGC 1052 | -11.95 | 40.78 | (e) | CD | AGN | C |
| NGC 2681 | -13.61 | 38.94 | (f) | AGN | C | |
| UGC 05101 | -13.32 | 41.24 | (e) | AGN | C | |
| NGC 3226 | -12.83 | 39.62 | (e) | CD | AGN | C |
| NGC 3245 | -13.48 | 39.08 | (e) | SB | C | |
| NGC 3379 | -14.36 | 37.89 | (e) | SB | C | |
| NGC 3507 | -14.37 | 38.31 | (e) | SB | D | |
| NGC 3607 | -14.05 | 38.45 | (e) | CD | SB | D |
| NGC 3608 | -13.97 | 38.64 | (e) | CD | SB | U |
| NGC 3628 | -13.61 | 38.24 | (e) | CD | AGN | C |
| NGC 3690B | -12.64 | 40.63 | (f) | CD | AGN | C |
| NGC 4111 | -13.21 | 39.33 | (e) | AGN | C | |
| NGC 4125 | -13.91 | 38.93 | (e) | AGN | C | |
| NGC 4261 | -12.58 | 40.65 | (e) | AGN | C | |
| NGC 4314 | -13.92 | 37.94 | (e) | SB | C | |
| NGC 4374 | -13.03 | 39.58 | (f) | SF | AGN | C |
| NGC 4395 | -11.61 | 39.71 | (f) | SF | AGN | C |
| NGC 4410A | -12.85 | 41.26 | (f) | AGN | C | |
| NGC 4438 | -13.32 | 39.22 | (f) | SF | SB | D |
| NGC 4457 | -13.51 | 39.05 | (f) | AGN | ||
| NGC 4459 | -13.66 | 38.83 | (e) | CD | SB | C |
| NGC 4486 | -11.75 | 40.75 | (e) | AGN | C | |
| NGC 4494 | -12.93 | 39.62 | (f) | SF | AGN | C |
| NGC 4552 | -13.04 | 39.41 | (f) | AGN | C | |
| NGC 4579 | -11.38 | 41.15 | (e) | AGN | C | |
| NGC 4594 | -11.99 | 40.07 | (f) | SF | AGN | C |
| NGC 4596 | -13.88 | 38.65 | (e) | SB | C | |
| NGC 4636 | -13.16 | 39.25 | (e) | SB | U | |
| NGC 4676A | -13.93 | 40.06 | (e) | CD | SB | D |
| NGC 4676B | -13.78 | 40.21 | (e) | CD | SB | D |
| NGC 4696 | -13.42 | 39.78 | (f) | SF | SB | C |
| NGC 4698 | -13.84 | 38.72 | (e) | CD | SB | D |
| NGC 4736 | -12.86 | 38.65 | (f) | AGN | C | |
| NGC 5055 | -13.42 | 38.37 | (e) | AGN | C | |
| NGC 5194 | -13.71 | 38.14 | (f) | AGN | ||
| MRK 0266NE | -13.22 | 40.98 | (e) | AGN | C | |
| UGC 08696 | -12.28 | 42.18 | (f) | SF | AGN | C |
| CGCG 162-010 . . . . | -13.23 | 41.73 | (f) | CD | SB | D |
| NGC 5746 | -12.73 | 40.07 | (f) | CD | AGN | C |
| NGC 5846 | -13.34 | 39.54 | (f) | SF | SB | D |
| NGC 5866 | -13.85 | 38.80 | (e) | SB | ||
| NGC 6251 | -12.18 | 41.84 | (f) | SF | AGN | C |
| NGC 6240 | -12.04 | 42.04 | (f) | CD | AGN | C |
| IRAS 17208-0014 | -13.45 | 41.14 | (e) | CD | AGN | C |
| NGC 6482 | -14.16 | 39.40 | (f) | SF+CD | SB | |
| NGC 7130 | -13.23 | 40.49 | (f) | AGN | C | |
| NGC 7331 | -13.73 | 38.72 | (e) | SB | C | |
| IC 1459 | -12.20 | 40.56 | (f) | SF | AGN | C |
NOTES.- Column (4): (f) Indicates flux and unabsorbed luminosity from spectral fitting and (e) indicates flux and luminosity estimated from empirical calibration. Column (5) gives those objects with obscuration indicators from spectral fitting (SF) of Color-color diagrams (CD); Column (6) gives our morphological classification attending to the 4.5–8.0 keV band; and column (7) gives the classification from the HST images, (C) Compact, (D) Dusty and (U) unclassified.
| Name | Classif. | Model | kT | kT(estim) | /d.o.f | ||||
|---|---|---|---|---|---|---|---|---|---|
| (keV) | (keV) | ||||||||
| NGC 0315 | AGN | RS+PL | 0.71 | 1.48 | [1.2-1.4] | 0.22 | [0.7-0.8] | 188.77/161 | |
| ARP 318A | SB | … | … | … | … | [1.8-2.0] | … | [0.6-0.8] | … |
| ARP 318B | SB | … | … | … | … | … | … | … | … |
| NGC 1052 | AGN | … | … | … | … | … | … | … | … |
| NGC 2681 | AGN | ME+PL | 0.08 | … | 1.74 | [1.4-1.8] | 0.66 | [0.7-0.8] | 13.94/26 |
| UGC 05101 | AGN | … | … | … | … | [0.4-0.6] | … | … | … |
| NGC 3226 | AGN | … | … | … | [0.8-1.2] | … | [0.7-0.8] | … | |
| NGC 3245 | SB | … | … | … | … | [2.0-2.4] | … | [0.6-0.8] | … |
| NGC 3379 | SB | … | … | … | … | … | … | … | … |
| NGC 3507 | SB | … | … | … | … | … | … | … | … |
| NGC 3607 | SB | … | … | … | … | … | … | … | … |
| NGC 3608 | SB | … | … | … | … | … | … | [1.0-4.0] | … |
| NGC 3628 | AGN | … | … | … | [1.2-1.6] | … | [0.6-0.8] | … | |
| NGC 3690B | AGN | PL | 0.02 | … | 1.45 | [1.4-1.8] | … | [0.6-0.7] | 21.81/25 |
| NGC 4111 | AGN | … | … | … | … | [0.4-0.6] | … | [0.6-0.7] | … |
| NGC 4125 | AGN | … | … | … | … | [1.4-1.8] | … | [0.6-0.8] | … |
| NGC 4261 | AGN | … | … | … | … | [1.5-1.6] | … | … | … |
| NGC 4314 | SB | … | … | … | … | … | … | … | … |
| NGC 4374 | AGN | PL | 0.14 | … | 2.07 | [2.0-2.2] | … | [0.7-0.8] | 32.20/33 |
| NGC 4395 | AGN | PL | 2.87 | … | 1.44 | … | … | … | 123.68/106 |
| NGC 4410A | AGN | PL | 0.01 | … | 1.75 | [1.4-1.8] | … | [0.7-0.8] | 33.11/45 |
| NGC 4438 | SB | RS+PL | 0.11 | … | 2.13 | [1.8-2.0] | 0.78 | [0.7-0.9] | 32.27/34 |
| NGC 4457 | AGN | RS+PL | 0.07 | … | 1.98 | [1.6-1.8] | 0.66 | [0.6-0.8] | 18.68/18 |
| NGC 4459 | SB | … | … | … | … | … | … | … | … |
| NGC 4486 | AGN | … | … | … | … | [1.2-1.6] | … | [0.7-0.8] | … |
| NGC 4494 | AGN | ME+PL | 0.11 | … | 1.37 | … | 0.63 | … | 5.59/5 |
| NGC 4552 | AGN | RS+PL | 0.04 | … | 1.81 | [1.8-2.0] | 0.83 | [0.7-0.9] | 57.19/61 |
| NGC 4579 | AGN | … | … | … | … | [1.2-1.6] | … | … | … |
| NGC 4594 . . . . . . | AGN | PL | 0.20 | 1.41 | [1.6-2.0] | … | [0.4-0.6] | 118.72/87 | |
| NGC 4596 | SB | … | … | … | … | … | … | … | … |
| NGC 4636 | SB | … | … | … | … | [2.0-2.2] | … | [0.7-0.8] | … |
| NGC 4676A | SB | … | … | … | … | [0.8-1.2] | … | … | … |
| NGC 4676B | SB | … | … | … | … | … | … | … | … |
| NGC 4696 | SB | PL | 0.13 | … | 4.26 | … | … | … | 21.98/17 |
| NGC 4698 | SB | … | … | … | … | [1.2-1.6] | … | [0.7-0.8] | … |
| NGC 4736 | AGN | ME+PL | 0.08 | … | 2.00 | [1.4-1.8] | 0.60 | [0.6-0.8] | 72.90/79 |
| NGC 5055 | AGN | … | … | … | … | [1.6-2.0] | … | [0.7-0.9] | … |
| NGC 5194 | AGN | ME+PL | 0.03 | … | 2.67 | [0.4-0.6] | 0.61 | [0.6-0.7] | 49.74/48 |
| MRK 266NE | AGN | … | … | … | … | … | … | … | … |
| UGC 08696 | AGN | RS+PL | 0.39 | … | 1.74 | … | 0.75 | … | 55.63/40 |
| CGCG 162-010 | SB | RS+PL | 0.09 | … | 2.44 | … | 1.12 | … | 59.95/61 |
| NGC 5746 | AGN | PL | 0.60 | 1.22 | [1.0-1.2] | … | [0.7-0.8] | 15.66/17 | |
| NGC 5846 | SB | ME+PL | 0.12 | … | 1.65 | [0.8-1.2] | 0.50 | [0.5-0.7] | 21.91/25 |
| NGC 5866 | SB | … | … | … | … | … | … | … | … |
| NGC 6251 | AGN | ME+PL | 0.44 | 1.60 | [1.0-1.4] | 0.26 | [0.4-0.6] | 65.27/62 | |
| NGC 6240 | AGN | RS+PL | 1.11 | 1.03 | [0.8-1.0] | 0.76 | [0.7-0.8] | 126.79/112 | |
| IRAS 17208-0014 | AGN | … | … | … | [1.6-2.0] | … | [0.6-0.8] | … | |
| NGC 6482 | SB | ME | 0.31 | … | … | … | 0.68 | … | 16.41/18 |
| NGC 7130 | AGN | RS+PL | 0.06 | … | 2.51 | [1.2-1.4] | 0.82 | [0.7-0.8] | 81.43/57 |
| NGC 7331 | SB | … | … | … | … | [2.2-2.6] | … | [0.6-0.8] | … |
| IC 1459 | AGN | ME+PL | 0.28 | … | 1.89 | [1.8-2.0] | 0.30 | [0.7-0.9] | 189.47/166 |
NOTES.- (*) Out of any grid. UGC 08696 has been fitted including a gaussian model where the best fit is centered in 5.93 keV with a weight of 1.22 keV.
| Name | ||||||
|---|---|---|---|---|---|---|
| NGC 0315 | -0.06 | 0.05 | -0.05 | 0.04 | -0.59 | 0.03 |
| ARP 318A | -0.20 | 0.11 | -0.45 | 0.14 | -0.74 | 0.17 |
| ARP 318B | 0.04 | 0.18 | -0.09 | 0.22 | -0.88 | 0.10 |
| NGC 1052 | -0.13 | 0.21 | 0.03 | 0.23 | -0.37 | 0.13 |
| NGC 2681 | -0.09 | 0.06 | -0.27 | 0.11 | -0.67 | 0.13 |
| UGC 05101 | -0.03 | 0.13 | -0.05 | 0.14 | -0.41 | 0.14 |
| NGC 3226 | 0.58 | 0.13 | 0.09 | 0.14 | -0.49 | 0.08 |
| NGC 3245 | -0.19 | 0.26 | -0.35 | 0.29 | -0.78 | 0.20 |
| NGC 3379 | 0.18 | 0.22 | -0.34 | 0.28 | … | … |
| NGC 3507 | -0.36 | 0.08 | -0.40 | 0.20 | … | … |
| NGC 3607 | 0.25 | 0.17 | -0.38 | 0.24 | … | … |
| NGC 3608 | 0.47 | 0.22 | -0.69 | 0.17 | -0.75 | 0.23 |
| NGC 3628 | 0.46 | 0.26 | 0.10 | 0.17 | -0.60 | 0.17 |
| NGC 3690B | 0.39 | 0.12 | -0.25 | 0.09 | -0.48 | 0.10 |
| NGC 4111 | -0.26 | 0.08 | -0.38 | 0.18 | -0.45 | 0.17 |
| NGC 4125 | -0.18 | 0.16 | -0.32 | 0.19 | -0.68 | 0.21 |
| NGC 4261 | -0.37 | 0.03 | -0.36 | 0.07 | -0.33 | 0.06 |
| NGC 4314 | -0.22 | 0.16 | -0.35 | 0.29 | … | … |
| NGC 4374 | -0.07 | 0.08 | -0.22 | 0.09 | -0.75 | 0.08 |
| NGC 4395 | -0.20 | 0.12 | 0.34 | 0.06 | -0.52 | 0.03 |
| NGC 4410A | -0.07 | 0.06 | -0.27 | 0.08 | -0.67 | 0.07 |
| NGC 4438 | -0.05 | 0.05 | -0.41 | 0.09 | -0.75 | 0.13 |
| NGC 4457 | -0.17 | 0.07 | -0.25 | 0.12 | -0.70 | 0.14 |
| NGC 4459 | -0.13 | 0.25 | 0.00 | 0.43 | … | … |
| NGC 4486 | -0.04 | 0.01 | -0.21 | 0.02 | -0.64 | 0.01 |
| NGC 4494 | -0.02 | 0.12 | -0.16 | 0.16 | -0.87 | 0.08 |
| NGC 4552 | -0.01 | 0.05 | -0.20 | 0.07 | -0.69 | 0.07 |
| NGC 4579 | -0.08 | 0.02 | -0.15 | 0.02 | -0.61 | 0.02 |
| NGC 4594 | 0.15 | 0.05 | -0.14 | 0.05 | -0.65 | 0.04 |
| NGC 4596 | -0.42 | 0.37 | -0.35 | 0.56 | … | … |
| NGC 4636 | -0.12 | 0.03 | -0.50 | 0.06 | -0.73 | 0.11 |
| NGC 4676A | 0.07 | 0.25 | -0.10 | 0.29 | -0.53 | 0.40 |
| NGC 4676B | -0.21 | 0.18 | -0.16 | 0.25 | … | … |
| NGC 4696 | -0.17 | 0.11 | 0.00 | 0.33 | … | … |
| NGC 4698 | -0.06 | 0.17 | -0.20 | 0.22 | -0.63 | 0.25 |
| NGC 4736 | -0.15 | 0.04 | -0.23 | 0.05 | -0.68 | 0.06 |
| NGC 5055 | 0.03 | 0.14 | -0.28 | 0.15 | -0.73 | 0.13 |
| NGC 5194 | -0.25 | 0.03 | -0.42 | 0.07 | -0.45 | 0.17 |
| MRK 0266NE | -0.01 | 0.13 | 0.13 | 0.19 | -0.34 | 0.14 |
| UGC 08696 | 0.00 | 0.10 | -0.14 | 0.11 | 0.12 | 0.08 |
| CGCG 162-010. . . . | 0.09 | 0.07 | -0.22 | 0.12 | … | … |
| NGC 5746 | 0.58 | 0.18 | -0.01 | 0.12 | -0.51 | 0.08 |
| NGC 5846 | -0.35 | 0.05 | -0.35 | 0.12 | -0.57 | 0.26 |
| NGC 5866 | -0.23 | 0.21 | -0.63 | 0.29 | -0.52 | 0.24 |
| NGC 6251 | 0.19 | 0.07 | -0.21 | 0.06 | -0.55 | 0.05 |
| NGC 6240 | 0.52 | 0.05 | 0.01 | 0.05 | -0.48 | 0.05 |
| IRAS 17208-0014 | 0.44 | 0.18 | 0.01 | 0.15 | -0.67 | 0.12 |
| NGC 6482 | 0.10 | 0.08 | -0.38 | 0.14 | -0.83 | 0.15 |
| NGC 7130 | -0.12 | 0.04 | -0.33 | 0.06 | -0.61 | 0.09 |
| NGC 7331 | -0.16 | 0.21 | -0.35 | 0.22 | -0.81 | 0.14 |
| IC 1459 | 0.00 | 0.03 | -0.19 | 0.03 | -0.72 | 0.03 |