Central stellar populations of early-type galaxies in low-density environments
Abstract
Following the pilot study of Kuntschner et al. (2002) we have investigated the properties of a volume and magnitude limited (, b) sample of early type galaxies that were carefully selected from the AAO two degree field galaxy redshift survey to have no more than one and five companions within 1 and 2 Mpc, respectively. We used images from the DSS to confirm the E/S0 morphologies. We augmented this sample with field galaxies from Colbert et al. (2001) selected as having no neighbour within 1 Mpc and . We present spectroscopic observations of 22 galaxies from the combined sample, from which central velocity dispersions and the Lick stellar population indices were measured. After carefully correcting the spectra for nebular emission we derived luminosity-weighted ages, metallicities, and -element abundance ratios. We compare these isolated galaxies with samples of early-type galaxies in the Virgo and Coma clusters, and also with the previous sample of galaxies in low-density regions of Kuntschner et al. (2002). We find that galaxies in low-density environments are younger and have a greater spread of ages compared to cluster galaxies. They also show a wider range of metallicities at a given velocity dispersion than cluster galaxies, which display only super-solar metallicities. On average cluster, as well as, isolated galaxies show non-solar abundance ratios in -elements, suggesting that, independent of galactic environment, star formation occurred on short time-scales. However, the abundance ratios for our low-density environment sample galaxies do not scale with the stellar velocity dispersion as observed in clusters. In fact we detect a large spread at a given velocity dispersion even reaching solar abundance ratios. The metallicity of isolated early-type galaxies is found to correlate weakly with . We reason that early-type galaxies in low-density environments experienced merging-induced star-formation episodes over a longer and more recent period of time compared to a cluster environment, and speculate that a considerable fraction of their stars formed out of low-metallicity halo gaseous material during the slow growth of a stellar disk between merging events.
keywords:
galaxies : abundances – galaxies : formation – galaxies : elliptical and lenticular – galaxies : evolution| Name | RA (B1950) | DEC (B1950) | bJ | Type | Run | ||
| (1) | (2) | (3) | (4) | (5) | (6) | (7) | (8) |
| 2dFGRS sample | |||||||
| NGC 1453 | 3h 43m 574 | -4°07m 24″ | 12.77 | E2-3 | 3934 9 | 314 10 | dec 2000 |
| TGN 101Z112 | 10h 36m 365 | -5°14m 29″ | 15.03 | S0 | 8330 11 | 241 11 | apr 2001 |
| TGN 136Z057 | 13h 22m 180 | -3°49m 24″ | 14.44 | S0 | 6132 18 | 353 17 | apr 2001 |
| TGN 206Z141 | 14h 08m 060 | -2°26m 57″ | 15.50 | E | 8093 8 | 166 9 | apr 2001 |
| TGN 297Z016 | 10h 49m 336 | -0°17m 47″ | 14.51 | S0/a | 5515 9 | 138 12 | apr 2001 |
| TGN 382Z123 | 12h 01m 540 | +2°10m 22″ | 14.36 | E | 5871 11 | 302 11 | apr 2001 |
| TGN 383Z019 | 12h 08m 310 | +1°15m 06″ | 14.21 | S0- | 6092 10 | 130 14 | apr 2001 |
| TGN 427Z618 | 10h 32m 160 | +0°56m 06″ | 15.71 | E | 9502 11 | 111 17 | apr 2001 |
| TGS 198Z061 | 23h 59m 015 | -27°51m 08″ | 15.36 | E | 8021 22 | 148 24 | dec 2000 |
| TGS 216Z098 | 1h 22m 496 | -27°30m 24″ | 15.14 | E | 9330 10 | 214 13 | dec 2000 |
| TGS 358Z048 | 0h 02m 582 | -30°51m 55″ | 15.37 | S0 | 8330 11 | 132 11 | dec 2000 |
| Galaxies from Colbert et al. (2001) | |||||||
| A0718-34 | 7h 18m 562 | -34°01m 25″ | 15.8 | SA0- | 8500 15 | 256 19 | dec 2000 |
| ESO 065-G001 | 12h 34m 050 | -72°18m53″ | 14.50 | E4 | 7099 15 | 236 18 | apr 2001 |
| ESO 505-G015 | 12h 04m 330 | -25°24m 53″ | 14.55 | E+3 | 7451 10 | 284 11 | apr 2001 |
| ESO 574-G017 | 12h 37m 580 | -20°17m 15″ | 15.22 | E+ | 8428 10 | 156 13 | apr 2001 |
| IC 1156 | 15h 58m 250 | +19°51m 44″ | 14.48 | E | 9213 9 | 234 11 | apr 2001 |
| IC 2980 | 11h 54m 599 | -73°24m 24″ | 14.6 | E3 | 2092 6 | 141 8 | dec 2000 |
| IIZW017 | 4h 32m 420 | -1°50m 00″ | 15.6 | cE pec | 9728 8 | 143 9 | dec 2000 |
| NGC 179 | 0h 35m 159 | -18°07m 27″ | 14.30 | SAB0- | 5976 9 | 260 9 | dec 2000 |
| NGC 1132 | 2h 50m 196 | -1°28m 45″ | 13.25 | E | 6935 11 | 253 13 | dec 2000 |
| NGC 3332 | 10h 37m 510 | +9°26m 40″ | 13.34 | (R)SA0- | 5758 7 | 226 9 | dec 2000 |
| NGC 6799 | 19h 28m 110 | -56°00m 53″ | 13.39 | SA0- | 3363 6 | 157 8 | apr 2001 |
| Lick galaxies | |||||||
| NGC 1600 | 4h 29m 117 | -5°11m 38″ | 11.93 | E3 | 4681 8 | 315 8 | dec 2000 |
| NGC 1700 | 4h 54m 286 | -4°56m 33″ | 12.20 | E4 | 3889 7 | 246 7 | dec 2000 |
Notes: The first column lists the name of the galaxy, columns (2) and (3) list the B1950 coordinates, column (4) shows the (total) bJ magnitude, column (5) the type of the galaxy as found in NED or the SDSS. Columns (6) and (7) list the recession velocity and the velocity dispersion, respectively, as measured from our spectra. Column (8) indicates in which run the galaxy was observed.
1 Introduction
Understanding the formation and evolution of early-type galaxies is one of the major challenges for current structure-formation models. In particular, one key issue to be addressed is whether the environmental impact on the formation and evolution of galaxies predicted by N-body and semi-analytical models (e.g., Baugh et al., 1996; Kauffmann et al., 1999; Springel et al., 2001; Khochfar & Burkert, 2003) is observed in real galaxies. In the framework of a cold-dark matter (CM) universe, structure assembles hierarchically by successive mergers of smaller structures. Observations of the galaxy merging rate in different environments suggest that interactions in high-density environments were more frequent than interactions in the field at high redshifts. Conversely interaction rates in the field are higher at low redshifts (van Dokkum et al., 1999; Le Fèvre et al., 2000). These trends are predicted by the CDM paradigm (e.g., Governato et al., 1999; Gottlöber et al., 2001; Khochfar & Burkert, 2001). For instance, in high-density environments rich clusters form quickly and subsequent merging between galaxies is suppressed by the large relative velocities. On the other hand, in low-density environments galaxies are still assembling today. The details of these predictions depend on a number of parameters, such as AGN or supernovae feedback processes, gas cooling and accretion rates, and, particularly in clusters, tidal interactions and ram-pressure gas stripping.
In order to constrain the models it is crucial to study galaxies in both high- and low-density environments. In particular, we need to measure the age, metallicity, and -element abundance ratio of their main stellar constituents. However, the stellar population properties of elliptical and lenticular galaxies in low-density environments have received little attention because of the difficulty in identifying a reasonable sample. Based on a sample of 9 galaxies with less than two neighbors within 1.3 Mpc, Kuntschner et al. (2002, hereafter K02) found that galaxies in low-density environments are on average younger, have higher metallicity, and exhibit gas emission more frequently than similar galaxies in the Fornax cluster. The presence of young stellar populations could explain why isolated galaxies seem to fall below the fundamental plane and have lower mass-to-light ratios (Reda et al., 2005).
Following the pilot study of K02, we set out to identify a larger sample of early-type galaxies in low-density regions and to study their stellar populations. We compute the Lick-indices and look for correlations with the velocity dispersion. We correct the absorption indices, in particular the Balmer indices, for the biases introduced by the presence of emission, using the emission-line removal method of Sarzi et al. (2006). We use the single stellar population (SSP) models of Thomas et al. (2003a, hereafter TMB03), to derive ages, metallicities and -abundance ratios for our sample galaxies.
This paper is organized as follows. In section 2 we describe the selection of our sample. In section 3 we present the observations and the basic data reduction, along with the methods used to measure the galaxy recession velocity, central velocity dispersion, emission-line fluxes, and Lick absorption-line indices. In section 4, we compare different index combinations with SSP models to derive the luminosity-weighted mean stellar age, metallicity, and abundance ratio of our sample galaxies. Finally in section 5 we discuss our results and draw our conclusions.
2 Sample selection
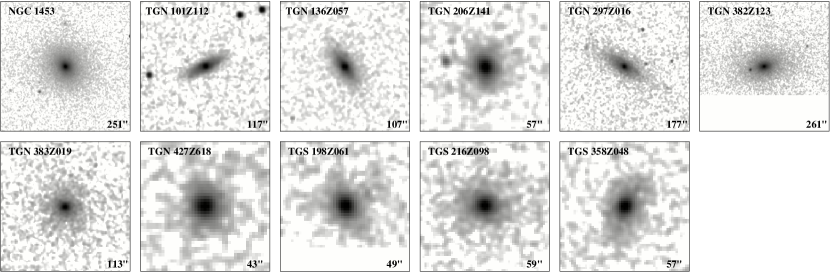
Our sample consists of two sub-samples. The first include galaxies in low-density environment that were selected using the AAO two degree field galaxy redshift survey (2dFGRS, Colless et al., 2001) and the other is drawn from the sample of isolated galaxies of Colbert et al. (2001). The galaxies from the 2dFGRS survey were carefully chosen using well defined criteria. We first selected galaxies with recession velocity and apparent magnitude b, corresponding to a limiting absolute magnitude of . This resulted in a volume and magnitude limited sample of 443 candidate galaxies. For each candidate, we then determined the number of companion galaxies within a sphere of radius 1 and 2 Mpc h-1 at least as bright as the candidate. When no velocity was available for a companion, we assumed it was at the same distance as the candidate. In this way we are conservatively overestimating the number of nearby companions. We selected only candidate galaxies with no more than one and five companions within 1 and 2 Mpc-1, respectively, leaving around 200 candidates. We further restricted the number of candidates by keeping only objects with 2dFGRS spectra of sufficient quality to confidently exclude the presence of strong emission lines. We checked the morphology of these candidates with the Digital Sky Survey (DSS) and NASA/IPAC Extragalactic Database (NED) and eliminated those with obvious spiral or disturbed morphologies, ending up with about thirty galaxies. Of these, we observed 11 galaxies from the Siding Spring Observatory in Australia (see also Section 3.1). The morphology of the 2dFGRS targets was further checked a posteriori using images from the 2MASS survey, which are shown in Figure 1.
We added to this sample of galaxies in low-density environments 11 isolated galaxies taken from the sample of Colbert et al. (2001). They were selected as isolated objects from the Third reference Catalogue of Bright Galaxies (RC3) with no cataloged galaxies with known redshift within a projected radius of 1 Mpc h-1 and a velocity of 1000 . Furthermore, a maximum recession velocity of was imposed.
Table 1 lists the observed sample galaxies, along with their main characteristics. We note that the Hubble classification for the galaxies in our 2dFGRS sub-sample should be considered with care, as it is based on photographic plates which makes it difficult to differentiate between lenticular and elliptical galaxies. Although the isolation criterion applied to select our 2dFGRS galaxies is less stringent than the one used by Colbert et al. (2001), for simplicity we refer hereafter to our sample galaxies as isolated, to distinguish it from the low-density environment sample of K02.
| Telescope | MSSSO (2.3m) |
|---|---|
| Dates | 16–20 Dec 2000, 26 Apr – 1 May 2001 |
| Instrument | DBS spectrograph (blue arm) |
| Spectral range | 3690 Å–5600Å |
| Grating | 600 lines mm-1 |
| Dispersion | 1.1 Å pixel-1 |
| Resolution | 2.3 Å |
| Spatial Scale | 091 pixel-1 |
| Slit Width | 20 |
| Detector | SITe (1752 532 pixels; 15 15 m) |
| Gain | 1.0 e ADU-1 |
| Read-out-Noise | 5.5 e (rms) |
| Typical seeing | 15 |
3 Observation and data reduction
3.1 Observational techniques
The spectra were obtained at the ANU 2.3-m telescope at the Siding Spring Observatory, Australia in two runs: December 2000 and April 2001. The first run was entirely clear whereas in the second run we got only 3 nights of data. In both runs we used the Double Beam Spectrograph (Rodgers, Conroy & Bloxham, 1988), the same instrument as K02. Our analysis is based on data from the blue arm. The spectra obtained with the red arm, which covers the 8100–9050 Å wavelength region, were not used. The details of the set-up are given in Table 2.
The seeing was in the range 13 – 20. A typical exposure time for galaxies was 3600s, subdivided in multiple exposures bracketed by neon-argon lamp calibration spectra, for wavelength calibration. Spectrophotometric standard stars were also observed to calibrate the response function of the system. For comparison purposes we observed two galaxies from the Lick sample, they are listed in Table 1. For the brighter galaxies, such as those from the Lick samples just one exposure was taken. The resulting rest-wavelength range is 3690–5600 Å, covering a range of Balmer and metallic absorption lines such as H, H, Mg , Fe5270, Fe5335, and the [O ii] and [O iii] emission lines.
3.2 Basic data reduction
The data reduction used standard IRAF software packages. Each frame was overscan-corrected and bias subtracted. Both skyflats and domeflats were used to correct for the pixel-to-pixel sensitivity variations and illumination correction along the slit. The cosmic rays were removed using the algorithm of van Dokkum (2001), which rejects cosmic rays using a variation of Laplacian edge detection. The wavelength calibration was determined from the Ne-Ar lamp spectra.
One-dimensional spectra were extracted using the closest physical aperture size to the same equivalent circular aperture diameter used in K02, namely 1.08 kpc. This aperture will not subtend the same fraction of all our sample galaxies. Unfortunately not all our sample galaxies have measured effective radii Re so that apertures with the same relative size could not be extracted. This drawback will not affect our conclusions, however. Using the SAURON integral-field spectrograph, Cappellari et al. (2006) and Kuntschner et al. (2006) have accurately estimated the effect of aperture corrections on the central velocity dispersion, the H, Mg , and Fe5015 indices, after correcting them for gas emission. If we assume that the Fe5270 and Fe5335 indices are subject to similar aperture corrections as the Fe5015 index, even considering a quite conservative range of 0.1 Re–0.6 Re for the relative size of our 1.08 kpc aperture, the central velocity dispersion and indices we measured should not be subject to fluctuation larger than 10%. This value is typically smaller or at most comparable to our error bars.
3.3 Central velocity dispersions and emission-line removal
In order to correct the line-strength indices for kinematical broadening and to account for emission-line contamination, we first measured the recession velocity , and central velocity dispersions , of our sample galaxies using the method of Cappellari & Emsellem (2004), and then applied the procedure described in Sarzi et al. (2006) to derive and remove the emission-line fluxes if emission was detected. The algorithm of Cappellari & Emsellem (2004) minimizes the impact of template-mismatch on the derived stellar kinematics by combining a number of stellar templates to optimally match the galaxy spectra. We used templates from the new library of SSP models from Vazdekis (2005), which are based on a collection of around a thousand stellar spectra. The models range from 3500 to 7500 Å with a resolution of 2.3 Å. We used SSP models with ages between 1.00 to 17.78 Gyr and with metallicities of 0.2, 0.,-0.38,-0.68,-1.28,-1.68. We extracted the stellar kinematics in the wavelength range from 4700 – 5600 Å , while masking the regions potentially affected by H and [O iii] emission. Emission from the [N i]5198, 5200 doublet was never detected.


Once the stellar kinematics is constrained we removed the mask in the H and [O iii] regions and, following the approach of Sarzi et al. (2006), fit simultaneously the stellar spectrum and the H and [O iii] emission lines. This is done by adding a set of Gaussian templates representing the emission lines to the SSP models library, and by solving only for the position, width, and amplitudes of the emission-line templates and the contribution of each SSP template. The latter are convolved by the stellar LOSVD previously derived. To minimize the impact of template mismatch in the H region, we imposed on the H lines the same kinematics as the [O iii] doublet, which was derived in a first emission-line fit. We then measured the standard deviation in the residuals of our fit and deemed detected only emission-lines with Gaussian amplitudes at least 4 times larger than the noise. Out of the 22 galaxies in our sample, H and/or [O iii] emission was detected in 7 galaxies. We subtracted the detected H and [O iii] lines from the spectra, to produce “emission-line free” data for the line-strength analysis.
We note that the relative strength of the H to [O iii] lines spanned a wide range of values, from zero to H/[O iii] 2. This suggests that when possible it is better not to rely on fixed H/[O iii] ratios, such as the H/[O iii] 0.6 values proposed by Trager et al. (1998), to correct the H absorption index.
We applied the same velocity dispersion and emission-line correction also to the spectra of K02, in order to have all low-density sample galaxies reduced in the same way.
3.4 Line-strength indices
We measured the Lick/IDS indices as defined in (Worthey & Ottaviani, 1997; Trager et al., 1998). As our data have higher spectral resolution than the spectra used by the Lick group, we needed to degrade our spectra in order to measure the indices, recognizing that we may loose information. We broadened the spectra with a Gaussian of wavelength-dependent width as the image dissector scanner (IDS) resolution depended on wavelength. We then corrected the indices for velocity broadening using the method of Kuntschner (2000) using templates stars and the values for derived in the previous section. These two steps are needed before comparing our indices with the stellar population models. We did not apply any offset to our indices, since in general the typical offsets are relatively small (e.g., Norris et al., 2006) and the index values measured for the two galaxies from the Lick sample that we observed were very similar to the published values. We measured the age-sensitive Balmer indices H, and metallicity sensitive indices Mg , Fe5270, Fe5335 among others. The errors associated to the line-strength indices are obtained by Monte-Carlo simulations, accounting for the statistical fluctuations in the spectra and for the uncertainties in the derived recession velocity and therefore on the position of the line and pseudo-continuum passbands. The indices and their errors, including CN, CN and Ca4227, are given in Table 3. Recently Kuntschner (2004) found that H is also sensitive to both the h3 and h4 higher moments of the line-of-sight velocity distribution (LOSVD), while the Fe5070, Fe5335, Mg indices are sensitive to h only. For old stellar populations and , h values of 0.1 can introduce variations as high as 15 – 20 % in the ages and metallicities of old stellar populations, respectively.

We also measured the h3 and h4 moments of the central LOSVD and found that in none of the sample galaxies the values for h3 and h4 were significant enough to modify the indices (in average h and h).
4 Results
In this section we first analyze index versus central velocity dispersion measurements for the Fe, Mg and H Lick/IDS-indices. Then, using the TMB03 models, we investigate the luminosity-weighted mean age, metallicity and [/Fe] ratios of the stellar populations. Finally, we explore the relations between these three parameters and the galaxy mass, as traced by .
4.1 Lick/IDS indices as function of velocity dispersion
Burstein et al. (1988), Jørgensen (1997) and Trager et al. (1998) showed that the Mg2 and H indices vary systematically with the velocity dispersion of galaxies , whereas the Fe index presents a rather weak correlation with (see also Kuntschner et al., 2001). We explored the correlation between line strength and the velocity dispersion, considering log Fe versus , Mg versus and H versus . The prime sign , is the index expressed in magnitudes like the “molecular” indices (see e.g., Kuntschner et al., 2001).
Figure 2 illustrates these relations for early-type galaxies from the high-density environment sample from Thomas et al. (2005, hereafter T05). This sample includes 11 galaxies from the Virgo cluster (González, 1993), 32 from the Coma cluster (Mehlert et al., 2000, 2003), and 11 from Beuing et al. (2002). The latter objects were selected from the ESO-UV Catalog (Lauberts & Valentijn, 1989) requiring a local galaxy surface density NGT 9 (NGT being the number of galaxies per square degree inside a radius of 1 degree around the considered galaxy).
There is a good agreement between the relations shown in Figure 2 and the literature (e.g., Colless et al., 1999; Kuntschner et al., 2001; Mehlert et al., 2003) for both the tight Mg- relation, and the anti-correlation between H and . Few galaxies have velocity dispersions below . There is no clear distinction between the S0’s and E’s, except for the H vs relation, where at a given the S0’s are offset from the E’s by dex towards higher values.
Figure 3 shows the same diagrams for our sample on the left and for the low-density environments of K02 (hereafter, LDE) on the right. Besides the Fe– relation of isolated galaxies being steeper than for the other two samples, the relations for the cluster, isolated and LDE samples have similar slopes within the uncertainties. The scatter in the relations derived for the isolated sample is however almost twice larger than in the case of the cluster or LDE samples. In detail, the rms for the Fe– relation is 0.050 for the 2dFGRS/Colbert’s sample, whereas it is only 0.023 and 0.035 for the cluster and LDE sample, respectively. Similarly, for the Mg – relation it is 0.017 for the 2dFGRS/Colbert’s sample, compared to a rms of 0.010 for the cluster environment and a rms of 0.009 for the LDE sample. Finally, for the H– relation we find a rms of 0.012, 0.009 and 0.008 for the 2dFGRS/Colbert’s, the cluster and the LDE samples, respectively.
We note the distinct grouping in the velocity dispersion distribution of our sample with one group clustered around 150 km s-1 and another around 250 km s-1. This separation may be an artifact of our sample selection. No such dichotomy is present in our absolute magnitude distribution. Relatively more galaxies in our sample have a low velocity dispersion (log ) than the cluster galaxies.


In summary, the relations between line strength index and central velocity dispersion are on average quite similar for cluster galaxies and both samples of galaxies in low-density environments, following the same trends: negative correlation between H and the velocity dispersion, increasing metal line strength (Mg , Fe) with increasing . However, we find a larger scatter for the early-type galaxies in low-density environments. Similarly, Denicolo et al. (2005a) found no significant differences in the index– relations between cluster and low-density region galaxies, except for a larger scatter for the group, field, and isolated galaxies compared to the cluster galaxies.
4.2 H versus [MgFe]′
In this section we aim to derive robust and first order estimates of the luminosity weighted age and metallicity of our sample galaxies. A detailed investigation, including the abundance ratios, is presented in Section 4.4. The luminosity-weighed age of a population, can be inferred from a comparison of selected line-strength indices with models of single stellar populations such as those of TMB03. In our study we use H as age indicator because its age sensitivity is greater and it is less degenerate with metallicity, or abundance ratio variations, than the H index (see e.g., Korn et al., 2005). As a metallicity indicator we adopt the [MgFe]′ index of TMB03 as it is virtually independent of abundance ratio variations.
Figure 4 shows the distribution in H versus [MgFe]′ for the cluster galaxies and a grid from the stellar population models of TMB03. The almost vertical lines are of constant metallicity and range from -2.25 to 0.67 dex, whereas the solid lines represent the age from 1 to 15 Gyr. We note that cluster galaxies appear to have a quite small range in metallicity for galaxies older than 5 Gyr; they are almost all between [Z/H] 0 and 0.35 dex. Most of these galaxies are ellipticals. On the other hand the younger galaxies, mainly S0’s, have a larger spread in metallicity reaching [Z/H] 0.67 dex.
Figure 5 presents the same age-metallicity diagnostic plot but for the samples of field galaxies: on the left panel, our sample of isolated galaxies and on the right panel, the LDE sample of K02. Our isolated sample shows a wider spread in ages and metallicities than in the case of cluster galaxies. Most of our sample galaxies have ages between 3 and 15 Gyr and metallicities between -0.3 and 0.3. The LDE sample of K02 shows also a similar range of ages and metallicities. Our data is consistent with the low-density region galaxies of Denicolo et al. (2005b, hereafter D05b), which also show a large spread in age and metallicity. Taking the isolated and LDE samples together and considering the uncertainties in the Hubble classification of our sample, we do not find a clear relation between galaxy type and age or metallicity. On the other hand, early-type galaxies in clusters tend to have different properties depending on their type, S0’s rather younger with a large range in metallicity and elliptical galaxies rather older with a small range in metallicity.
4.3 Fe versus Mg
In this section we have a first look at the abundance ratios of our sample galaxies. We investigate the Mg versus Fe diagram (Figures 6, 7), where the model prediction for solar abundance ratios spans a narrow region in parameter space. This diagram is a diagnostic for the star formation time scale. Magnesium (like the other -elements) is formed in the explosion of Type II supernovae which occur rapidly after a burst of star formation whereas the iron peak elements originate in Type Ia supernovae which lag behind by at least 1 Gyr (Nomoto et al., 1984; Woosley & Weaver, 1995). Thus a super-solar -element to Fe ratio indicates that stars formed in an initial burst taking up the Type II supernova abundance pattern and then star formation ceased, perhaps through the onset of galactic winds sweeping away the gas material (Greggio & Renzini, 1983; Matteucci & Greggio, 1986; Thomas et al., 1998). These short star formation time-scales 1 Gyr are also interesting as they are not achieved by current models of hierarchical galaxy formation (e.g., Matteucci, 1994; Thomas, Greggio & Bender, 1999).
In Figure 6 we plot galaxies in clusters. Most appear to have [/Fe] ratios between 0 and 0.3 dex, and thus have on average clearly super solar abundance ratios, a result first found by Worthey et al. (1992). We note that the lenticular galaxies appear, in this diagram, to be closer to solar abundance ratios than the elliptical galaxies. However, this could be partly attributed to an age effect since the models are not completely degenerate in this parameter space (see Section 4.4 for a more rigorous analysis).
Figure 7 shows the same distribution but for our sample (left panel), and the LDE galaxies (right panel). The plots are very similar, there is no obvious difference between ellipticals and S0s (in contrast to the clusters galaxies) or between our 2dFGRS/Colbert sample of isolated galaxies and the LDE sample of K02. Most isolated and LDE galaxies display a clear -enhancement, although at lower level than the cluster galaxies.

The Mg versus Fe diagram can be used to obtain a first estimate of the abundance ratios but the result crucially depends on the age and metallicity assumed. Often these quantities are estimated using diagrams opposing two indices that are intended to be sensitive only to age and metallicity, such as the H versus [MgFe]′ diagrams of §4.2. However, a perhaps more economic and precise way of deriving age, metallicity and abundance ratio estimates is the fitting approach pioneered by Proctor et al. (2004, hereafter P04). We will explore this technique in the next section.
4.4 Determination of age, metallicity and abundance ratios
P04 pointed out that diagrams using only a few indices such as H or H versus [MgFe] (see e.g., González, 1993) can lead to inconsistent age estimates, even when used to derive the age of globular clusters. In order to improve the stellar population analysis P04 proposed to solve ( minimization) for the best fitting stellar population parameters using a large set of indices. This new method is making better use of the information on the age, metallicity and abundance ratio which is contained in all the indices rather than being biased by a few selected indices.
In our application of the method we interpolated all tabulated indices from TMB03 in steps of 0.025 in metallicity, 0.05 in [/Fe] and 1 Gyr in age. The actual minimization was performed in the log age, [Z/H] and [/Fe] parameter space. Among the indices we measured, we decided to use only G4300, Fe4383, H, Fe5015, Mg , Fe5270, and Fe5335 in the analysis. We excluded the CN1, CN2 and Ca4227 indices because they are not well reproduced within the TMB03 models (Tripicco & Bell, 1995; Thomas et al., 2003b, P04). Errors on the final estimates were obtained by Monte-Carlo simulations using the errors on the index measurements.


The right panel of Figure 8 shows our final results for the isolated galaxies in our sample together with the galaxies in the LDE sample of K02, since these samples have very similar properties. The left panel of Figure 8 shows the same plots for the cluster galaxies of Thomas et al. (2005). A similar figure was presented by T05, but included only galaxies older than 5 Gyr, i.e. their old sub-sample. T05 obtained their values by first fixing the abundance ratio and determining the ages and metallicities with the two pairs (H, Mg ), (H, Fe), then used the metallicities found for Mg and Fe to adjust the abundance ratio, and iterated until consistent results between both pairs were found. Table 3 gives our age, metallicity and abundance ratios estimates and associated errors for the low-density environment galaxy sample. The full table is available in the electronic version of MNRAS.


| Galaxy | age | [Z/H] | [/Fe] | CN1 | CN2 | Ca4227 | G4300 | Fe4383 | H | Fe5015 | Mg | Fe5270 | Fe5335 |
|---|---|---|---|---|---|---|---|---|---|---|---|---|---|
| Gyr | [mag] | [mag] | [Å] | [Å] | [Å] | [Å] | [Å] | [Å] | [Å] | [Å] | |||
| NGC 1453 | 6.0 | 0.43 | 0.20 | 0.116 | 0.156 | 0.92 | 5.96 | 5.90 | 1.55 | 5.33 | 4.83 | 3.24 | 2.81 |
| 2.8 | 0.10 | 0.04 | 0.003 | 0.004 | 0.14 | 0.11 | 0.31 | 0.13 | 0.76 | 0.14 | 0.17 | 0.41 | |
| TGN 101Z112 | 15.0 | 0.17 | 0.15 | 0.094 | 0.136 | 1.18 | 6.66 | 6.34 | 1.49 | 5.41 | 4.40 | 3.20 | 2.31 |
| 1.9 | 0.08 | 0.06 | 0.006 | 0.007 | 0.17 | 0.20 | 0.43 | 0.17 | 0.86 | 0.23 | 0.27 | 0.52 | |
| TGN 136Z057 | 4.0 | 0.43 | 0.25 | 0.122 | 0.163 | 2.25 | 5.77 | 4.93 | 1.68 | 5.34 | 4.91 | 2.99 | 3.42 |
| 2.4 | 0.13 | 0.05 | 0.004 | 0.005 | 0.20 | 0.16 | 0.41 | 0.17 | 1.01 | 0.27 | 0.25 | 0.66 |
Notes: The full table is available in the electronic version of MNRAS.
If we look first at galaxies in clusters (left panel), we notice the clear correlation between [/Fe] and found also by e.g., K00, K01, and T05. The three top plots show that old galaxies have also higher velocity dispersions and higher abundance ratios than younger objects. Similarly, Caldwell et al (2003) and Trager et al. (2000b) claim that there is a trend for lower elliptical galaxies to have younger ages. Using a Spearman rank order test between and age, we find that ellipticals follow a better trend of with age than S0s (98% probability for the existence of a correlation for Es and 85% probability for S0s) as on average the scatter for the S0s is larger. Furthermore, on average Es are older than S0s, with mean luminosity-weighted ages of 11 and 6 Gyr for Es and S0s, respectively. From the plots against the metallicity, the cluster galaxies appear to have only super-solar metallicities, with an average [Z/H] , and no clear trend with or abundance ratio. There also appears to be a weak anti-correlation between [Z/H] and age. Spearman rank order tests yield a 60% and 95% probability that a correlation exists for Es and S0s, respectively. However, the true significance of such a relation is difficult to assess, since the errors in age and metallicity are correlated in the direction of the potential relation (see e.g, Kuntschner et al., 2001; Thomas et al., 2005, for details). Correlations between and age, [Z/H], and [/Fe] for cluster galaxies were also found by T05 (but see also references therein).
In contrast, for the isolated and LDE galaxies (right panel), we notice in all the plots a large spread in age, metallicity and abundance ratio. A Spearman rank order test suggests that metallicity is correlated with or age with a probability of 95%, although as in the case of the cluster galaxies, the relation between metallicity and age would need to be confirmed.
We note that contrary to this study both K02 and T05 found evidence for slightly higher [Z/H] in field early-type galaxies than in clusters. The discrepancy with the results of T05 may be due to a different sample selection. Most of the field galaxies of T05 are not as “isolated” as the ones in our and K02 samples. On the other hand, the difference between the conclusions on the stellar metallicity reached by us and K02 arise from a) our use of a more accurate correction for the emission-line contamination, b) re-analyzing the data of K02 with the latest SSP models, and c) from the fact that the cluster of reference in K02, Fornax, have different population properties than the Virgo and Coma clusters from T05 used here.
The large scatter we find for the luminosity weighted ages of early-type galaxies in low density environments is in agreement with the predictions of semi-analytical models (e.g., Cole et al., 2000, see also K02). Additionally, some of the early-type galaxies with velocity dispersions of about 150 reach solar abundance ratios which would be expected in a hierarchical formation scenario with extended star formation episodes for galaxies in low density regions (e.g., Thomas & Kauffmann, 1999). However, we still find that the most massive galaxies (i.e. highest velocity dispersion) in the low density environments show similar abundance ratios as cluster galaxies and thus have super solar ratios which is difficult to explain in hierarchical formation scenarios. Similarly puzzling is also the finding of super solar abundance ratios in less massive galaxies, which was already noticed by D05b.
Finally, we note that ellipticals and S0s appear to be indistinguishable in low-density environments, which could reflect our inability to separate elliptical from lenticular galaxies on the basis of DSS images. On the other hand, only one third of the combined isolated and LDE samples, were classified in this way and the majority of the objects have well defined morphologies. Hence elliptical galaxies and S0s in low-density environments appear to have similar stellar populations, in contrast to what is observed in clusters.
Overall, galaxies in low-density environments exhibit a more uniform distribution of luminosity-weighted stellar age and a broader range in metallicity than their counterparts in clusters, and on average also appear to be younger. Galaxies in low-density environments can achieve the same degree of non-solar abundance ratios as galaxies in clusters, although a larger range of [/Fe] ratios, even reaching solar values at intermediate velocity dispersions, is observed. The large range in stellar population parameters and lack of correlation with central velocity dispersion observed in our sample is indicative of a more diverse galaxy formation scenario in the field as compared to the typical cluster environment.
5 Conclusions
Following the pilot project of Kuntschner et al. (2002) we set out to study the stellar populations of a larger and more accurately selected sample of galaxies in low-density environments. We have used spectroscopic data from the 2dFGRS survey to select galaxies without strong H emission and with no more than one and five companion within 1 and 2 Mpc-1, respectively, and combined these objects with isolated early-type galaxies from the sample of Colbert et al. (2001), which have no companions within 1 Mpc.
We measured a set of Lick/IDS indices to obtain estimates of the luminosity-weighted mean age, metallicity, and abundance ratio in our sample galaxies. We also applied a new technique (Sarzi et al., 2006) to subtract gaseous emission from our spectra before measuring the absorption line-strength indices. The stellar population estimates were obtained with the models of Thomas et al. (2003a) and the technique of Proctor et al. (2004).
By applying the same methodology to the data of K02, we find that the stellar population properties of the galaxies of K02 appear to be very similar to that of our sample galaxies. After combining all low-density environment samples together (yielding a sample of 31 galaxies), we find that, compared to the cluster galaxies from the compilation of Thomas et al. (2005), early-type galaxies in low-density environments:
-
1.
Show a more uniform distribution of luminosity weighted stellar ages ranging from 2 to 15 Gyr and thus have on average younger stellar populations. This is particularly true for elliptical galaxies.
-
2.
Display a broader range of stellar metallicities, extending to sub-solar values at similar central velocity dispersions, .
-
3.
Can also reach the same amount of non-solar abundance ratios as cluster galaxies. However, there is an increased scatter at fixed with no clear correlation between [/Fe] and .
-
4.
Elliptical galaxies and S0s in low-density environments have stellar populations that are indistinguishable within our sample in contrast to the cluster galaxies, where there is a significant distinction between younger S0s and older elliptical galaxies.
How do these results compare with the predictions of galaxy-formation models (e.g., Cole et al., 2000)? According to the models, galaxies in clusters assemble early, when they repeatedly experienced short star-formation episodes each time they merged. More recently, however, galaxies in clusters do not merge owing to their high relative velocities. On the other hand, galaxies in the field initially merge less often (e.g. Khochfar & Burkert, 2001), while merging continues to low redshifts.
Hence, even considering only merging-induced star formation, early-type galaxies in low-density environments are expected to show a wider range of ages for their stellar constituents, compared to the stars in cluster galaxies. This is qualitatively consistent with our findings as also previously reported by K02 and T05.
In addition, the larger range of [/Fe] and metallicities observed in field early-type galaxies suggest further differences between the evolutionary paths of cluster and field galaxies. The large range of [/Fe] ratios reaching solar values indicates that at least some field galaxies experienced extended star formation episodes. We can speculate that these stars formed in the disks that grew between merger events (Khochfar & Silk, 2005). Finally, we note that the ability of galaxies in low-density environments to grow stellar disks around them in recent epochs may explain why early-type galaxies in low-density environments are so scarce and very often show morphological signatures (such as outer shells or dusts, Colbert et al., 2001, K02) of recent merging events. In other words, most galaxies in the field that we classify as E or S0 may have assembled only recently.
Acknowledgments
We wish to thank Sadegh Khochfar and Daniel Thomas for many helpful discussions.
References
- Bacon et al. (2001) Bacon, et al. 2001, MNRAS, 326, 23
- Baugh et al. (1996) Baugh, C. M., Cole, S., & Frenk, C. S. 1996, MNRAS, 283, 1361
- Beuing et al. (2002) Beuing, J., Bender, R., Mendes de Oliviera, C., Thomas, D., Maraston, C., 2002, A&A, 395,431
- Binney (2004) Binney, J. 2004, MNRAS, 347, 1093
- Burstein et al. (1988) Burstein, D., Bertola, F., Buson, L. M., Faber, S. M., Lauer, T. R., 1988, ApJ, 328, 440
- Caldwell et al (2003) Caldwell, N., Rose, J. A., Concannon, K. D., 2003, AJ, 125, 2891
- Cappellari & Emsellem (2004) Cappellari, M., & Emsellem, E. 2004, PASP, 116, 138
- Cappellari et al. (2006) Cappellari, M., et al., 2006, MNRAS, accepted (astro-ph/0505042)
- Colbert et al. (2001) Colbert, J. W., Mulchaey J. S., Zabludoff, A. I., 2001, ApJ, 121, 808
- Cole et al. (2000) Cole, S., Lacey, C. G., Baugh, C. M., & Frenk, C. S. 2000, MNRAS, 319, 168
- Colless et al. (1999) Colless, M. , Burstein, D., Davies, R. L., McMahan R. K., Saglia R. P., Wegner, G., 1999, MNRAS, 303, 813
- Colless et al. (2001) Colless, M., et al. 2001, MNRAS, 328, 1039
- Denicolo et al. (2005a) Denicolo, Terlevich, R., Terlevich, E., Forbes, D. A., Terlevich, A., Carrasco, L. 2005, MNRAS,356, 1440 (D05a)
- Denicolo et al. (2005b) Denicolo, Terlevich, R., Terlevich, E., Forbes, D. A., Terlevich, A., 2005, MNRAS,358, 813 (D05b)
- van Dokkum et al. (1999) van Dokkum, P. G., Franx, M., Fabricant, D., Kelson, D. D., & Illingworth, G. D. 1999, ApJ, 520, L95
- van Dokkum (2001) van Dokkum, P. G., 2001, PASP, 113, 1420V
- González (1993) González, J. J., 1993, PhD. Thesis, Univ. California, Santa Cruz
- Gottlöber et al. (2001) Gottlöber, S., Klypin, A., & Kravtsov, A. V. 2001, ApJ, 546, 223
- Governato et al. (1999) Governato, F., Gardner, J. P., Stadel, J., Quinn, T., & Lake, G. 1999, AJ, 117, 1651
- Greggio & Renzini (1983) Greggio, L. & Renzini, A. 1983, A&A, 118, 217
- Jørgensen (1997) Jørgensen, I., 1997, MNRAS, 288, 161
- Kauffmann et al. (1999) Kauffmann, G., Colberg, J. M., Diaferio, A., & White, S. D. M. 1999, MNRAS, 303, 188
- Khochfar & Burkert (2001) Khochfar, S., & Burkert, A. 2001, ApJ, 561, 517
- Khochfar & Burkert (2003) Khochfar, S., & Burkert, A. 2003, ApJ, 597, L117
- Khochfar & Silk (2005) Khochfar, S., & Silk, J. 2005, MNRAS, submitted., astro-ph/0509375
- Korn et al. (2005) Korn, A. J., Maraston, C., & Thomas, D. 2005, A&A, 438, 685
- Kuntschner (2000) Kuntschner, H. 2000, MNRAS, 315, 184
- Kuntschner et al. (2002) Kuntschner, H., Russell, J. S., Colless, M., Davies, R. L., Kaldare, R., Vazdekis, A., 2002, MNRAS, 337, 172 (K02)
- Kuntschner (2004) Kuntschner, H. 2004, A&A,426,737
- Kuntschner et al. (2001) Kuntschner, H., Lucey, J. R., Smith, R. J., Hudson, M. J., & Davies, R. L. 2001, MNRAS, 323, 615
- Kuntschner et al. (2006) Kuntschner, H. et al. 2006, MNRAS, accepted (astro-ph/0602192)
- Lauberts & Valentijn (1989) Lauberts, A. & Valentijn, E. A, 1989, The Surface Photometry Catalogue of teh ESO–Upsalla Galaxies (Garching: ESO)
- Le Fèvre et al. (2000) Le Fèvre, O., et al. 2000, MNRAS, 311, 565
- Matteucci & Greggio (1986) Matteucci, F. & Greggio, L. 1986, A&A, 154, 279
- Matteucci (1994) Matteucci, F., 1994, A&A, 288, 57
- Mehlert et al. (2000) Mehlert, D., Saglia, R. P., Bender, R., Wegner, G., A&AS, 2000, 141, 449
- Mehlert et al. (2003) Mehlert, D., Thomas, D., Saglia, R. P., Bender, R., & Wegner, G. 2003, A&AS, 407, 423
- Nomoto et al. (1984) Nomoto, K., Thielemann, F. K., Yokoi, K., 1984 , ApJ, 286, 644
- Norris et al. (2006) Norris, M. A., Sharples, R. M., & Kuntschner, H. 2006, MNRAS, accepted (astro-ph/0601221)
- Proctor et al. (2004) Proctor, R. N., Forbes, D. A., Beasley, M. A. 2004, MNRAS, 355, 1327
- Reda et al. (2005) Reda, F. M., Forbes, D. A., & Hau, G. K. T. 2005, MNRAS, 360, 693
- Rodgers, Conroy & Bloxham (1988) Rodgers, A. W., Conroy, P., Bloxham, G., 1988, PASP, 100, 626R
- Sarzi et al. (2006) Sarzi, M., et al., 2006, MNRAS, accepted (astro-ph/0511307)
- Springel et al. (2001) Springel, V., White, S. D. M., Tormen, G., & Kauffmann, G. 2001, MNRAS, 328, 726
- Thomas et al. (1998) Thomas, D., Greggio, L., Bender, R. 1998, MNRAS, 296, 119
- Thomas, Greggio & Bender (1999) Thomas, D., Greggio, L., Bender, R., 1999, MNRAS, 302, 537
- Thomas & Kauffmann (1999) Thomas, D., & Kauffmann, G. 1999, ASP Conf. Ser. 192: Spectrophotometric Dating of Stars and Galaxies, 192, 261 (astro-ph/ 9906216)
- Thomas et al. (2003a) Thomas, D., Maraston,C., Bender, R., 2003, MNRAS, 339, 897 (TMB03)
- Thomas et al. (2003b) Thomas, D., Maraston, C., & Bender, R. 2003, MNRAS, 343, 279
- Thomas et al. (2005) Thomas, D., Maraston, C., Bender, R., de Oliveira, C. M. 2005, ApJ, 621, 673 (T05)
- Trager et al. (1998) Trager, S. C., Worthey, G., Faber, S.M., Burstein, D., González, J. J., 1998, ApJS, 116, 1
- Trager et al. (2000a) Trager, S. C., Faber, S. M., Worthey, G., D., González, J. J., 2000, ApJ, 119, 1645
- Trager et al. (2000b) Trager, S. C., Faber, S. M., Worthey, G., González, J. J., 2000, AJ, 120, 165
- Tripicco & Bell (1995) Tripicco, M. J., Bell, R. A., 1995, AJ, 110, 3035
- Vazdekis (2005) Vazdekis, A. 2005 in prep
- Woosley & Weaver (1995) Woosley, S.E., Weaver, T. A., 1995, ApJS, 101,181
- Worthey et al. (1992) Worthey, G., Faber, S. M., González J. J., 1992. ApJ, 398, 69
- Worthey (1994) Worthey, G., 1994, ApJS, 95, 107
- Worthey (1997) Worthey, G. 1997, in Holt S., Mundy L. G., eds, AIP conf. Proc. Vol 393, Star Formation Near and Far, Am Inst Phys., New York, p 525
- Worthey & Ottaviani (1997) Worthey, G., Ottaviani, D. L., 1997, ApJS, 111, 377
- Ziegler et al. (2005) Ziegler, B. L., Thomas, D., Böhm, A., Bender, R, Fritz, A., Maraston, C., 2005, A&A, 433,385