APEX mapping of H3O+ in the Sgr B2 region
Abstract
Context. The cosmic-ray ionization rate of dense molecular clouds is a key parameter for their dynamics and chemistry.
Aims. Variations of are well established, but it is unclear if these are related to source column density or to Galactic location.
Methods. Using the APEX telescope, we have mapped the 364 GHz line of H3O+ in the Sgr B2 region and observed the 307 GHz line at selected positions. With the IRAM 30-m telescope we have observed the HO 203 GHz line at the same positions.
Results. Strong H3O+ emission is detected over a 32 pc region, indicating an H3O+ column density of 1015–1016 cm-2 in an 18′′ beam. The H3O+ abundance of 310-9 and H3O+/H2O ratio of 1/50 in the Sgr B2 envelope are consistent with models with 410-16 s-1, 3 lower than derived from H observations toward Sgr A, but 10 that of local dense clouds.
Conclusions. The ionization rates of interstellar clouds thus seem to be to first order determined by the ambient cosmic-ray flux, while propagation effects cause a factor of 3 decrease from diffuse to dense clouds.
Key Words.:
ISM: clouds – ISM: molecules – ISM: cosmic rays – Molecular processes – Astrochemistry1 Introduction
The ionization rate of interstellar clouds is a key parameter for their dynamics and their chemistry (see Caselli & Walmsley 2001 and Van der Tak 2006 for reviews). In dense star-forming regions, the bulk of the ionization is due to cosmic rays, at a rate of 310-17 s-1 as derived from HCO+ and CO emission line observations of the envelopes of young massive stars up to a few kpc from the Sun (Van der Tak & van Dishoeck, 2000). This result is in good agreement with measurements of the local flux of low-energy cosmic rays with the Voyager and Pioneer spacecrafts (Webber, 1998). However, mm-wave observations of DCO+ and HCO+ toward the nearby dark cloud LDN 1544 indicate a decrease of by a factor 10 (Caselli et al., 2002), while observations of H absorption toward the Per diffuse cloud indicate an increase of similar magnitude (Le Petit et al., 2004). Even larger enhancements are found for the Galactic Center, where Oka et al. (2005) derive 10-15 s-1 from H observations toward Sgr A. An enhanced ionization rate in the inner 250 pc of our Galaxy is expected from its strong X-ray and radio synchrotron emission, but this value is at the upper limit based on the observed temperatures of the Sgr B2 clouds (Güsten et al., 1985). It is unclear if these variations in are due to propagation effects (absorption or scattering of cosmic rays) or to variations in the cosmic-ray flux with location in the Galaxy. To resolve this issue, an estimate of the ionization rate of dense gas in the Galactic Center is urgently needed. However, in the case of Sgr B2, using the DCO+/HCO+ ratio is complicated by the uncertain D abundance, while comparing HCO+ with CO is difficult as the molecules may not trace the same gas (Jacq et al., 1999), which calls for other methods.
The high proton affinity of water makes hydronium (H3O+) a key ion in the oxygen chemistry of dense clouds. Its submillimeter rotation-inversion transitions may be used to measure and trace H2O and O2 which are unobservable from the ground. Pioneering work by Wootten et al. (1991) and Phillips et al. (1992) has demonstrated this potential with observations of strong H3O+ emission toward Sgr B2 (OH)111 This position between the Sgr B2 (M) and (S) cores was used for early line surveys of the Galactic Center (e.g., Cummins et al. 1986) but does not correspond to any object, not even the centroid of the OH masers (Gaume & Claussen, 1990). . Unfortunately, the atmospheric transmission from Mauna Kea is rarely good enough to observe H3O+, so mapping is not feasible.
The Chajnantor site greatly facilitates observation of the H3O+ =– line at 364.7974 GHz, which has an upper level energy of 139 K and an Einstein coefficient of 2.810-4 s-1. The =– line (=307.1924 GHz, =80 K, =3.510-4 s-1) is a probe of denser gas, because the emission competes with fast pure inversion decay, unlike for the 364 GHz line. This paper presents new observations of these lines toward the Sgr B2 region. Combined with observations of the HO – line at 203.4075 GHz (=204 K, =4.910-6 s-1), the data are used to estimate in the Sgr B2 region. Due to the high critical densities of the lines, our observations are not sensitive to the extended low-density envelope seen in absorption lines of water (Comito et al., 2003) and H3O+ (Goicoechea & Cernicharo, 2001).
2 Observations
| Position | (J2000) | (J2000) | dV | VLSR | V |
|---|---|---|---|---|---|
| hh mm ss | 0 ′ ′′ | K km s-1 | km s-1 | km s-1 | |
| H3O+ 364 GHz: | |||||
| Sgr B2 (M) | 17:47:20.2 | 28:23:05 | 42.0(13) | +62.0(6) | 17.3(16) |
| Sgr B2 (OH) | 17:47:20.8 | 28:23:32 | 8.7( 4) | +62.7(3) | 15.3( 8) |
| GCS 3-2 | 17:46:14.9 | 28:49:43 | 0.09 | … | … |
| GC IRS3 | 17:45:39.6 | 29:00:24 | 0.10 | … | … |
| H3O+ 307 GHz: | |||||
| Sgr B2 (M) | 27.1(52) | +64.6(14) | 16.6(21) | ||
| Sgr B2 (OH) | 7.7( 7) | +64.9(13) | 24.0(22) | ||
| HO 203 GHz: | |||||
| Sgr B2 (M) | 20.5(3) | +63.3(1) | 13.2(1) | ||
| Sgr B2 (OH) | 0.03 | … | … | ||
In July 2005, we observed the 364 GHz line of H3O+ towards selected sources in the Sgr B2 and Sgr A clouds using the APEX telescope (Güsten et al., this volume)222This paper is based on data acquired with the Atacama Pathfinder EXperiment, which is a collaboration between the Max-Planck-Institut für Radioastronomie, the European Southern Observatory, and the Onsala Space Observatory.. The front end was the facility APEX-2a receiver built at Onsala (Risacher et al., this volume); the back end was an FFT spectrometer built at the MPIfR providing 8192 channels over a bandwidth of 1.0 GHz (Klein et al., this volume). A map of Sgr B2 at 10′′ spacing (Fig. 1) was made by integrating 1 minute per point, which for system temperatures of 340 – 360 K gave a noise level of 0.2 K per 0.8 km s-1 channel. Deeper integrations (2–5 min) were made at the (N), (M) and (OH) positions. The line was also observed toward two positions in the Sgr A cloud, CGS 3-2 and GC IRS3, where strong H mid-infrared absorption suggests a high ionization rate (Oka et al., 2005). The non-detections at these positions probably reflect a lack of dense gas along these lines of sight. Follow-up observations of the 307 GHz line of H3O+ were performed in November 2005. Since this line lies very close to a CH3OH line, several local oscillator settings were used to verify the sideband origin of the detected features. In this case, the system temperature of 300 K resulted in an rms noise level of 90 mK on 0.24 km s-1 channels after 10.4 minutes of on-source integration.
All data were obtained using position switching with a throw of 3′ in Az. Test spectra taken at the Sgr B2 (OH) offset position indicate that the emission is 10% of the strength at the target position. The beam size of APEX is 18′′ at 364 GHz and 21′′ at 307 GHz. Data at both frequencies were calibrated onto scale using forward and main beam efficiencies of 97% and 74%. From a comparison of calibrations using hot and cold loads and using a water vapour radiometer, we estimate the calibration uncertainty to be 10%. For reasonably strong lines (10rms), as is the case here, spectral rms has a negligible contribution to the intensity uncertainty.
Observations of the HO 203 GHz line were performed with the IRAM 30-m telescope333IRAM is an international institute for millimeter-wave astronomy, co-funded by the Centre National de la Recherche Scientifique (France), the Max-Planck-Gesellschaft (Germany) and the Instituto Geografico Nacional (Spain) in February 2006. The facility receiver A230 was used as front end and the VESPA autocorrelator as backend. At this wavelength, the telescope has a beam size of 12′′ and a main beam efficiency of 57%. System temperatures were 500–600 K and integration times 10–30 min, resulting in rms noise levels of 0.1 K on 0.20 km s-1 channels. The line was detected at the Sgr B2 (M) but not at the (OH) position. Calibration was verified to 10% on Sgr B2 (N) which was observed before by Gensheimer et al. (1996).
3 Results
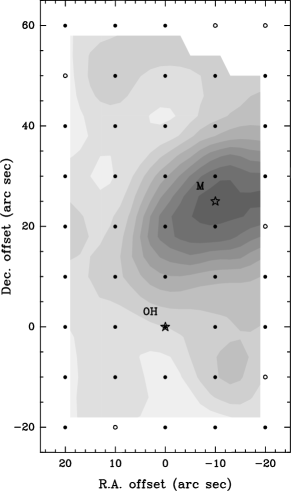
Emission in the H3O+ 364 GHz line is detected over an (8040)′′ region in Sgr B2 (Fig. 1), corresponding to (3.31.6) pc at a distance of 8.5 kpc. The overall distribution of H3O+ 364 GHz in the Sgr B2 region follows that of many other molecular lines when mapped at comparable resolution (e.g., Martín-Pintado et al. 1990; de Vicente et al. 1997). The distribution of H3O+ also follows that of the (sub-)millimeter dust continuum emission (Lis et al., 1991), a common tracer of the H2 distribution. In contrast, the H2O 183.31 GHz emission is strongly peaked at the cores, dropping to 10% of its peak value at the (OH) position (Cernicharo et al., 2006). This behaviour does not necessarily reflect the H2O column density distribution because of the maser nature of the 183 GHz line.
Table 1 lists the results of fitting Gaussian profiles to the spectra after subtracting a polynomial baseline. The 307 GHz line strength toward OH may be overestimated due to blending: fixing V to 15–16 km s-1 reduces the line flux by 25–30%. The strength of this line agrees with the data of Phillips et al. (1992), while the 364 GHz line is a factor of 2 weaker. The steep emission gradient (Fig. 1) makes the measurement sensitive to pointing offsets. In the APEX data, H3O+ and other lines peak at the M core, validating the pointing to 5′′.
The 307 and 364 GHz spectra show many lines in addition to H3O+. While the Sgr B2 (OH) spectra show 10 mostly weak (0.5 K) lines over the 1 GHz bandwidth, the Sgr B2 (M) spectrum shows 20 features with 1 K. The spectra taken in the vicinity of Sgr B2 (N) are so confused that the H3O+ line parameters cannot be reliably extracted. Identification and interpretation of these other lines will be done elsewhere in the framework of a spectral line survey program (Belloche et al., in prep.).

4 Column densities of H3O+ and H2O
| Component | (H2O) | (H3O+) | (H2)a |
|---|---|---|---|
| 1018 cm-2 | 1015 cm-2 | 1024 cm-2 | |
| Core (M) | 35 | 13.6 | 4.4 |
| Envelope (OH) | 0.15b | 3.7 | 1.1 |
| Beam size (′′) | 12 | 18 | 20 |
| a: From CSO 350 m data assuming =40 K | |||
| and =0.07 cm2g-1 (Lis, priv. comm.) | |||
| b: From Cernicharo et al. (2006) assuming H2O/H2=10-7 | |||
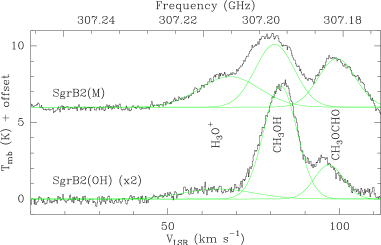
Figure 2 shows spectra of the two H3O+ lines at the positions where 307 GHz observations have been made. At both positions, the intensities of the two H3O+ lines are comparable. Since the lines are optically thin for any chemically reasonable H3O+ abundance, the line ratio of unity indicates a high excitation temperature, 50 K. Statistical equilibrium calculations using molecular data from Schöier et al. (2005)444http://www.strw.leidenuniv.nl/moldata/radex.php indicate that at the conditions in the M core (=200 K, (H2)=107 cm-3), collisions can sustain 100 K, consistent with the observed H3O+ line ratio. However, the density (106 cm-3) at the OH position is too low to thermalize the excitation at the kinetic temperature of 60 K. The observed H3O+ line ratio therefore indicates that the H3O+ excitation is driven by far-infrared pumping by the strong dust continuum radiation in the Sgr B2 region, as found before by Phillips et al. (1992). Models with =40–80 K reproduce the observed line ratio. Far-infrared pumping is also expected to play a major role toward (M), due to its high infrared luminosity, and is therefore included in the model.
For these excitation conditions, the observed line strengths imply (p-H3O+)=1.83(0.27)1015 cm-2 for Sgr B2 (OH) and 6.81(1.01)1015 cm-2 for Sgr B2 (M). The total H3O+ column densities are twice these values, as the ortho/para (/) ratio tends to unity at high temperatures (100 K). These estimates have uncertainties of a factor of 2 due to the uncertain excitation and the difference in estimated values from the two lines. Since the lines are optically thin and the source sizes cannot be constrained, the derived column densities are beam averages. For the Sgr A sources, assuming V=10 km s-1, =100 K and /=1, the observed limit on the line flux of 1 K km s-1 corresponds to (H3O+) 61013 cm-2.
Dividing the above column density estimates by (H2) values based on (sub-)millimeter dust continuum mapping (Table 2) provides estimates of the column-averaged abundance in the two sources: (H3O+)/(H2) = 3.110-9 in Sgr B2 (M) and 3.410-9 in Sgr B2 (OH). These estimates of the H3O+ column density and abundance are higher than previous values by Phillips et al. (1992) which were derived from the H3O+ 396 GHz line assuming a density of 105 cm-3 for the Sgr B2 envelope, a value which likely is an order of magnitude too low (Goicoechea et al., 2004).
To estimate the H2O column density from the IRAM observations, we adopt the same excitation conditions as for H3O+. To convert p-HO into H2O, we adopt /=3 as applicable for warm gas and 16O/18O=250 as applicable for the Galactic Center (Wilson & Rood, 1994). For the Sgr B2 (M) position, we estimate (H2O)=3.51019 cm-2, while the upper limit at the (OH) position implies (H2O)1.71018 cm-2 (1). Within the uncertainty of a factor of two, our estimate of (H2O) at the M position is consistent with radiative transfer modelling of the HO 203 GHz line towards the N core (Comito et al., 2003). The H2O column densities imply abundances of 1.210-5 and 1.710-6 at the (M) and (OH) positions, respectively, consistent with the estimates of 10-5 and 10-7 from observations of the H2O 183 GHz line (Cernicharo et al., 2006).
5 Chemistry of H2O and H3O+
Table 2 summarizes measurements of the H2O and H3O+ column densities toward the Sgr B2 cores (represented by the M position) and the surrounding envelope (represented by the OH position). The H3O+/H2O ratio is seen to be 1/50 in the envelope, or about 20 times the value in local clouds (Phillips et al., 1992), but drops by 100 toward the cores. This drop is more than expected from enhanced recombination at higher densities, and may be due to ongoing injection of H2O into the gas phase by evaporation of icy grain mantles, which also causes the rich (sub-)millimeter spectra of the (M) and (N) cores.
To estimate the cosmic-ray ionization rate in the Sgr B2 region from our observations, we have used the chemical model of Van der Tak & van Dishoeck (2000). Given estimates of temperature, density, , and the abundances of CO, O, N2 and H2O, this model calculates the steady-state abundances of HCO+, N2H+ and H3O+, as well as the total electron fraction. The model neglects metals such as Mg, Fe and S as electron sources and PAHs as electron sinks; including these species may change the calculated electron fraction by 2–3 depending on their abundance. The reaction rates in the model have been updated to follow the UMIST99 values (Le Teuff et al., 2000), except for the dissociative recombination reactions of H, HCO+ and N2H+ where the values of McCall et al. (2003), de Boisanger et al. (1996) and Geppert et al. (2004) are used. For the cores, we adopt = 200 K and = 107 cm-3, while for the envelope, we use = 60 K and = 106 cm-3 (see Goicoechea et al. 2004). The CO abundance of 510-5 is from the SEST line survey (Nummelin et al., 2000), the O abundance of 1.510-4 is based on the ISO-LWS line survey (Goicoechea et al., 2004), and we assume equal CO and N2 abundances.
The model reproduces the observed H3O+/H2O ratio in the Sgr B2 envelope for 410-16 s-1. The uncertainty is a factor of 2 from the observed H3O+/H2O ratio, and another factor of 2 through the assumed CO, N2 and O abundances. For Sgr B2 (M), the model indicates a 10 lower , which we consider a lower limit because the chemistry may not be in steady state. The time scale to equilibrate the H2O/H3O+ ratio is yr (Van der Tak et al., 2006) which for the model electron density of =0.01 cm-3 equals 300 yr.
The derived value of for Sgr B2 (OH) is 10 higher than the value for dense gas in the Solar neighbourhood (§ 1), but 3 lower than indicated by H observations of the Sgr A region (Oka et al., 2005). We conclude that the ionization rates of dense molecular clouds are mainly determined by their location in the Galaxy through variations in the cosmic-ray flux by a factor of 10. As a second order effect, is 3 lower in dense molecular clouds than in diffuse clouds, presumably due to cosmic-ray scattering (Padoan & Scalo, 2005).
In the future, large-scale mapping of the Sagittarius molecular clouds in the H3O+ 364 GHz and HO 203 GHz lines, combined with constraints on the temperature and density structure of the clouds, will provide more detailed understanding of the nature of the interaction between cosmic rays and molecular gas. The IRAM and APEX telescopes are well suited to carry out such observations, especially if equipped with heterodyne array receivers. Observations of H2O and H3O+ ground-state lines with the Heterodyne Instrument for the Far-Infrared (HIFI) on the Herschel Space Observatory will allow us to extend these studies to regions of lower column density.
Acknowledgements.
The authors thank the APEX staff for making the H3O+ observations possible, José Cernicharo and Juan Pardo for communicating their 183 GHz results in advance of publication, Clemens Thum, Nuria Marcelino and Stéphane Leon for arranging the HO observations on short notice, and Darek Lis and Malcolm Walmsley for useful comments on the manuscript.References
- Caselli et al. (2002) Caselli, P., Walmsley, C., et al. 2002, ApJ, 565, 344
- Caselli & Walmsley (2001) Caselli, P. & Walmsley, C. M. 2001, in Origin and Evolution of Young Stellar Clusters, ed. T. Montmerle & P. André, 67
- Cernicharo et al. (2006) Cernicharo, J., Goicoechea, J. R., Pardo, J., & Asensio-Ramos, A. 2006, ApJ, in press; astro-ph/0601336
- Comito et al. (2003) Comito, C., Schilke, P., Gerin, M., et al. 2003, A&A, 402, 635
- Cummins et al. (1986) Cummins, S., Linke, R., & Thaddeus, P. 1986, ApJS, 60, 819
- de Boisanger et al. (1996) de Boisanger, C., Helmich, F. P., & van Dishoeck, E. F. 1996, A&A, 310, 315
- de Vicente et al. (1997) de Vicente, P., Martín-Pintado, J., et al. 1997, A&A, 320, 957
- Gaume & Claussen (1990) Gaume, R. A. & Claussen, M. J. 1990, ApJ, 351, 538
- Gensheimer et al. (1996) Gensheimer, P. D., Mauersberger, R., & Wilson, T. L. 1996, A&A, 314, 281
- Geppert et al. (2004) Geppert, W. D., Thomas, R., et al. 2004, ApJ, 609, 459
- Goicoechea & Cernicharo (2001) Goicoechea, J. R. & Cernicharo, J. 2001, ApJ, 554, L213
- Goicoechea et al. (2004) Goicoechea, J. R., Rodríguez-Fernández, N. J., & Cernicharo, J. 2004, ApJ, 600, 214
- Güsten et al. (1985) Güsten, R., Walmsley, C. M., Ungerechts, H., & Churchwell, E. 1985, A&A, 142, 381
- Jacq et al. (1999) Jacq, T., Baudry, A., Walmsley, C. M., & Caselli, P. 1999, A&A, 347, 957
- Le Petit et al. (2004) Le Petit, F., Roueff, E., & Herbst, E. 2004, A&A, 417, 993
- Le Teuff et al. (2000) Le Teuff, Y., Millar, T., et al. 2000, A&AS, 146, 157
- Lis et al. (1991) Lis, D. C., Carlstrom, J. E., & Keene, J. 1991, ApJ, 380, 429
- Martín-Pintado et al. (1990) Martín-Pintado, J., de Vicente, P., Wilson, T. L., & Johnston, K. J. 1990, A&A, 236, 193
- McCall et al. (2003) McCall, B. J., Huneycutt, A. J., et al. 2003, Nature, 422, 500
- Nummelin et al. (2000) Nummelin, A., Bergman, P., et al. 2000, ApJS, 128, 213
- Oka et al. (2005) Oka, T., Geballe, T. R., Goto, M., Usuda, T., & McCall, B. J. 2005, ApJ, 632, 882
- Padoan & Scalo (2005) Padoan, P. & Scalo, J. 2005, ApJ, 624, L97
- Phillips et al. (1992) Phillips, T., van Dishoeck, E., & Keene, J. 1992, ApJ, 399, 533
- Schöier et al. (2005) Schöier, F. L., van der Tak, F. F. S., van Dishoeck, E. F., & Black, J. H. 2005, A&A, 432, 369
- Van der Tak & van Dishoeck (2000) Van der Tak, F. & van Dishoeck, E. 2000, A&A, 358, L79
- Van der Tak (2006) Van der Tak, F. F. S. 2006, Phil. Trans. R. Soc. Lond. A, in press; astro-ph/0602340
- Van der Tak et al. (2006) Van der Tak, F. F. S., Walmsley, C. M., Herpin, F., & Ceccarelli, C. 2006, A&A, 447, 1011
- Webber (1998) Webber, W. R. 1998, ApJ, 506, 329
- Wilson & Rood (1994) Wilson, T. L. & Rood, R. 1994, ARA&A, 32, 191
- Wootten et al. (1991) Wootten, A., Turner, B., Mangum, J., et al. 1991, ApJ, 380, L79