Image-Subtraction Photometry of Variable Stars
in the Globular
Clusters NGC 6388 and NGC 6441
Abstract
We have applied Alard’s image subtraction method (ISIS v2.1) to the observations of the globular clusters NGC 6388 and NGC 6441 previously analyzed using standard photometric techniques (daophot, allframe). In this reanalysis of observations obtained at CTIO, besides recovering the variables previously detected on the basis of our ground-based images, we have also been able to recover most of the RR Lyrae variables previously detected only in the analysis of Hubble Space Telescope WFPC2 observations of the inner region of NGC 6441. In addition, we report five possible new variables not found in the analysis of the HST observations of NGC 6441. This dramatically illustrates the capabilities of image subtraction techniques applied to ground-based data to recover variables in extremely crowded fields. We have also detected twelve new variables and six possible variables in NGC 6388 not found in our previous ground-based studies. The revised mean period for RRab stars in NGC 6388 is 0.676 day, while the mean period of RRab stars in NGC 6441 is unchanged at 0.759 day. These values are among the largest known for any galactic globular cluster. Additional probable type II Cepheids were identified in NGC 6388, confirming its status as a metal-rich globular cluster rich in Cepheids.
Subject headings:
globular cluster: individual (NGC 6441, NGC 6388) — stars: evolution — RR Lyrae variables1. Introduction
Rich et al. (1997) discovered that the horizontal branch morphologies of NGC 6388 and NGC 6441 were different from those of other metal-rich globular clusters. Although these two clusters have metallicities near (Armandroff & Zinn, 1988; Clementini et al., 2005), they have blue extensions to the horizontal branch in addition to the red horizontal branch components usually seen in metal-rich globular clusters. As a consequence, and unlike other metal-rich globular clusters, NGC 6388 and NGC 6441 have substantial populations of RR Lyrae stars. These RR Lyrae stars are themselves distinguished by having extraordinarily long periods for their metallicities, so that they do not fit the usual pattern of decreasing mean period versus increasing [Fe/H] (Layden et al., 1999; Pritzl et al., 2000, 2001, 2002, 2003). The reasons for the unusual horizontal branch morphologies of these clusters and the unusual characteristics of their RR Lyrae stars have not been established, although several scenarios have been advanced (Piotto et al., 1997; Sweigart & Catelan, 1998; Sweigart, 2002; Ree et al., 2002; Catelan, 2006). In addition to harboring this anomalous population of RR Lyrae stars, NGC 6388 and NGC 6441 each contain several type II Cepheids, making them the most metal-rich globular clusters known to contain such stars (Pritzl et al., 2002, 2003).


Pritzl et al. (2001, 2002) used daophot (Stetson, 1987) and allframe (Stetson, 1994) to analyze CCD images of NGC 6388 and NGC 6441 that were obtained with the 0.9-m telescope at CTIO. Many variable stars were identified in these studies, but the completeness of the variable star searches was low in the most crowded central portions of the clusters. On the other hand, image-subtraction techniques have revealed large numbers of variable stars that had previously gone undetected on the basis of more standard techniques, including allframe (Corwin et al. 2003, 2004 and references therein). We have therefore reanalyzed the 0.9-m observations using the ISIS v2.1 image-subtraction package (Alard, 2000; Alard & Lupton, 1998) in order to obtain a more complete inventory of the variable star populations of the clusters. The utility and completeness of the image-subtraction method can itself be evaluated in the case of NGC 6441, since Pritzl et al. (2003) also studied the variable stars of the inner regions of that cluster using snapshot observations obtained with the WFPC2 camera on the Hubble Space Telescope (HST).


2. Observations and Reductions
The details of the observations and processing of the images can be found in Pritzl et al. (2001, 2002). The ISIS analysis measures the difference in flux for pixels in each image of the time series relative to their flux in a reference image obtained by stacking a suitable subset of images. In the ISIS method, the original images are convolved with a kernel to account for seeing variations and geometrical distortions of the individual frames. We used the 10 images with the best seeing from each of the NGC 6441 and the NGC 6388 datasets to build up the reference images. This process identified a large number of stars with differential flux values above our threshold. Each was evaluated for the likelihood that it was a variable star and most clearly were not. We then compared our list of possible variables with the list of known variables. Any of our suspect variables that were not previously known variables were closely examined and many were eliminated. Some appeared to be genuinely variable and are reported here as new variables.
| Variable | ISIS period | HST period | Type |
|---|---|---|---|
| V106 | 0.361 | 0.36092 | RRc |
| V107 | 0.746 | 0.73891 | RRab |
| V108 | 0.344 | 0.34419 | RRc |
| V109 | 0.365 | 0.36455 | RRc |
| V110 | 0.769 | 0.76867 | RRab |
| V111 | 0.743 | 0.74464 | RRab |
| V112 | 0.614 | 0.61419 | RRab |
| V113 | 0.586 | 0.58845 | RRab |
| V114 | 0.675 | 0.67389 | RRab |
| V115 | 0.860 | 0.86311 | RRab |
| V116 | 0.582 | 0.58229 | RRab |
| V117 | 0.745 | 0.74529 | RRab |
| V118 | 0.979 | 0.97923 | RRab or Ceph |
| V119 | 0.686 | 0.68628 | RRab |
| V120 | 0.364 | 0.36396 | RRc |
| V121 | 0.848 | 0.83748 | RRab |
| V122 | 0.744 | 0.74270 | RRab |
| V123 | 0.336 | 0.33566 | RRc |
| V124 | 0.315 | 0.31588 | RRc |
| V125 | 0.337 | 0.33679 | RRc |
| V140 | 0.616 | 0.35180 | RR |
| V141 | 0.847 | 0.84465 | RRab |
| V142 | 0.887 | 0.88400 | RRab |
| V143 | 0.863 | 0.86277 | RRab |
| Variable | ISIS period | RA (2000) | Dec (2000) | Type |
|---|---|---|---|---|
| NV1(V146) | 0.402 | 17 50 13.15 | -37 03 00.4 | RRc |
| NV2(V147) | 0.355 | 17 50 13.26 | -37 02 52.3 | RRc |
| NV3(V148) | 0.390 | 17 50 12.79 | -37 02 50.9 | RRc |
| NV4(V149) | 0.557 | 17 50 10.06 | -37 02 26.5 | RR |
| NV5(V150) | 0.529 | 17 50 07.07 | -37 03 16.1 | RR |
3. Results
In this section we present results for newly discovered variable stars in both NGC 6388 and NGC 6441. In the case of NGC 6441, we also evaluate the ability of ISIS to detect RR Lyrae and Cepheid variables in ground-based data. In particular, we compare the detection of variable stars in the ISIS analysis of images of NGC 6441 taken at CTIO to the detection of variable stars in Pritzl et al. ’s (2003) analysis of WFPC2 observations of the same cluster.
Periods for the new variables were determined using the period-search program kiwi. kiwi follows Lafler & Kinman (1965) in searching for periodicity by seeking to minimize the total length of the line segments that join adjacent observations in phase space, i.e., to maximize the smoothness of the light curve. (The kiwi program was kindly provided to us by Dr. Betty Blanco.) In some cases the kiwi periods were adjusted to improve the phase match between different nights. The analyzed data cover 10 nights, spanning about 33 cycles for the shorter-period variables, and about 12 cycles for the longer-period ones. Because of this relatively short time interval, ISIS periods are given to only three significant figures. Differential flux light curves for the variables based on the ISIS analysis and the periods given in Tables 1 and 2 (NGC 6441) and 4 (NGC 6388) are shown in Figures 1 and 2 (NGC 6441) and 3 and 4 (NGC 6388).
Differential fluxes can be transformed into standard magnitudes if reliable photometry can be obtained for the variable stars in the reference frame (see, for example, Bruntt et al., 2003; Mochejska et al., 2002; Baldacci et al., 2005). Unfortunately, the newly discovered variables in NGC 6388 and NGC 6441 are in very crowded portions of the field, where the star images are badly blended. Conventional methods of photometry such as allstar and allframe are in these cases unable to provide the accurate magnitude zero-point on which to base a conversion from differential fluxes to magnitudes. Thus, our analysis will be based upon the differential flux light curves produced by ISIS.
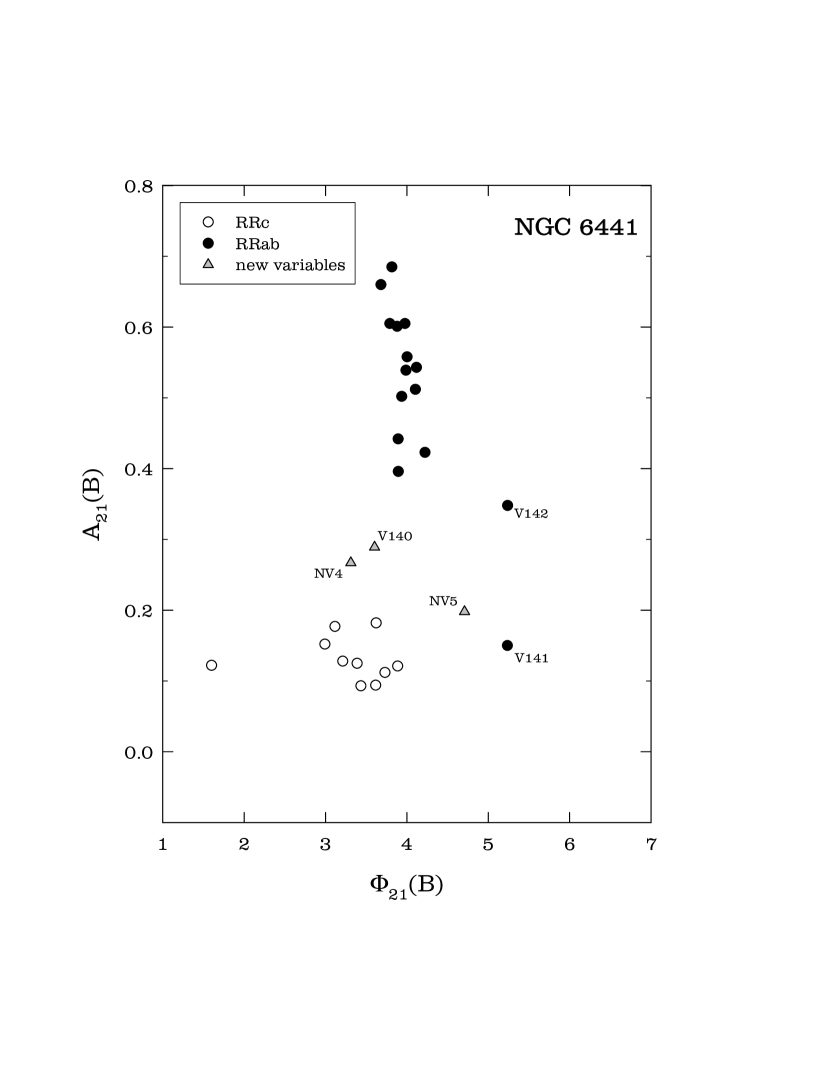
Table 1 and Figure 1 refer to NGC 6441 variables previously identified with HST, whereas Table 2 and Figure 2 report on the new NGC 6441 variable candidates detected with ISIS. There is only one instance where the kiwi period differs significantly from that found in Pritzl et al. (2003) (V140, see section 4). Table 2 contains five possible NGC 6441 variables that were not identified in the HST study by Pritzl et al. (2003). The WFPC2 photometry was reexamined to determine whether these five variables could be recovered from the HST dataset. All were recovered and could be identified as probable or possible variables. For NV1 and NV2 the WFPC2 photometry is noisy, but is consistent with the periods identified from the ISIS data. The WFPC2 photometry for NV3 is especially noisy, but suggests that the star may be truly variable. For NV4 and NV5, there are only 10 and 6 HST epochs of observation, respectively, but the data are again consistent with the identification of NV4 and NV5 as variable stars. Thus, NV1 through NV5 would become NGC 6441 variables V146 through V150, respectively. The positions of these variables were determined from the WFPC2 images as in Pritzl et al. (2003).
Three variables found in the HST analysis of Pritzl et al. (2003) were not found in the ISIS analysis: V136, V138, and V145. All three of these variables are within 10 arcsec of the center of the cluster. In fact, V145 is the variable found by HST that is closest to the center. It would be expected that stars near the very center of a cluster would be the most difficult for ISIS to detect. It is noteworthy in this connection that NGC 6388 and NGC 6441 are both clusters with strong central concentrations of stars (see Harris, 1996; Trager et al., 1995).
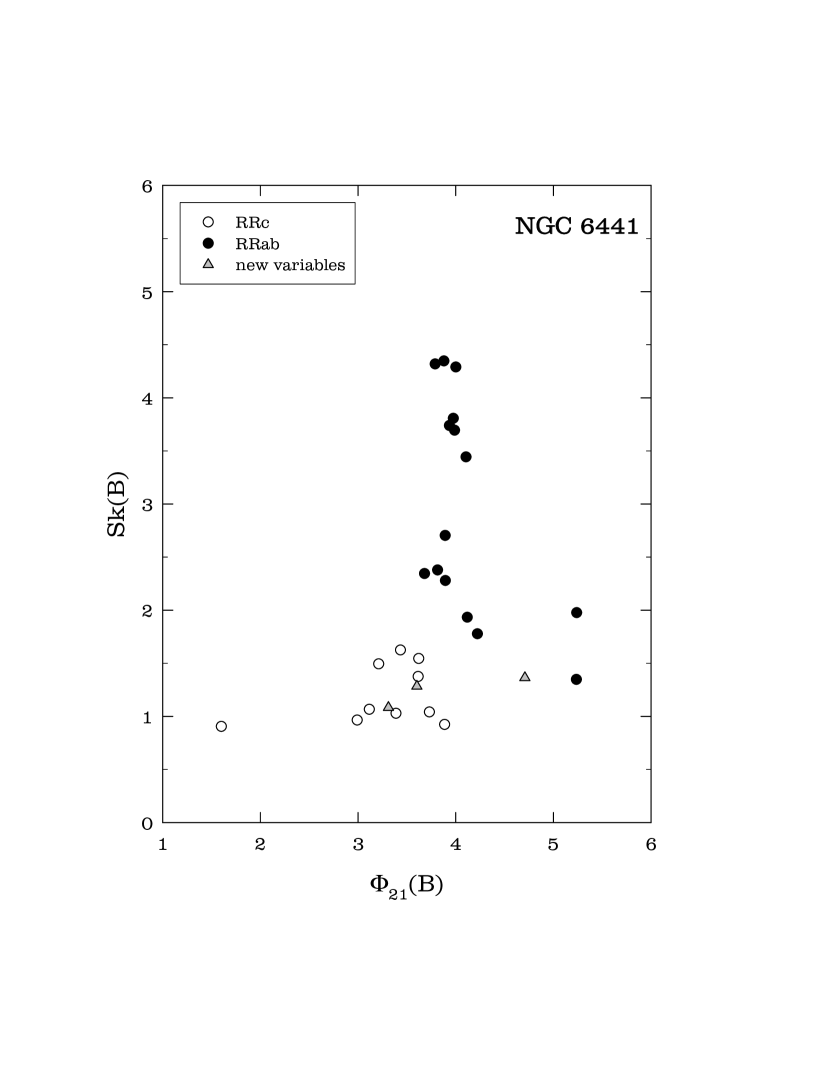
An RRc classification for the newly discovered variables NV1, NV2, and NV3 seems clear on the basis of period and light curve shape. However, results for the longer period variables NV4 and NV5 are not so clear. Plots of the Fourier decomposition parameters of light curves have proven useful in distinguishing between RRab and RRc type variables, e.g. Pritzl et al. (2002). In Figure 5 we plot the Fourier parameters versus , based upon a fifth order fit to the differential light curves. NV4 and NV5, as well as V140, fall between the stars clearly established as belonging to Bailey type ab and the stars clearly established as Bailey type c. We have also calculated the Stellingwerf & Donahue (1987) skewness parameter from the differential light curves. This parameter is defined as Sk = [1/(rise time in phase units)] - 1. Skewness is plotted against in Figure 6. Here, V140 and NV4 fall among the RRc variables, whereas the location of NV5 is closer to those of the RRab stars. The skewness and Fourier parameters for NGC 6441 variables are listed in Table 3. A few outlying points in the light curves were omitted in calculating the parameters. Parameters were not calculated for V118 because of the large gap in its observed light curve.
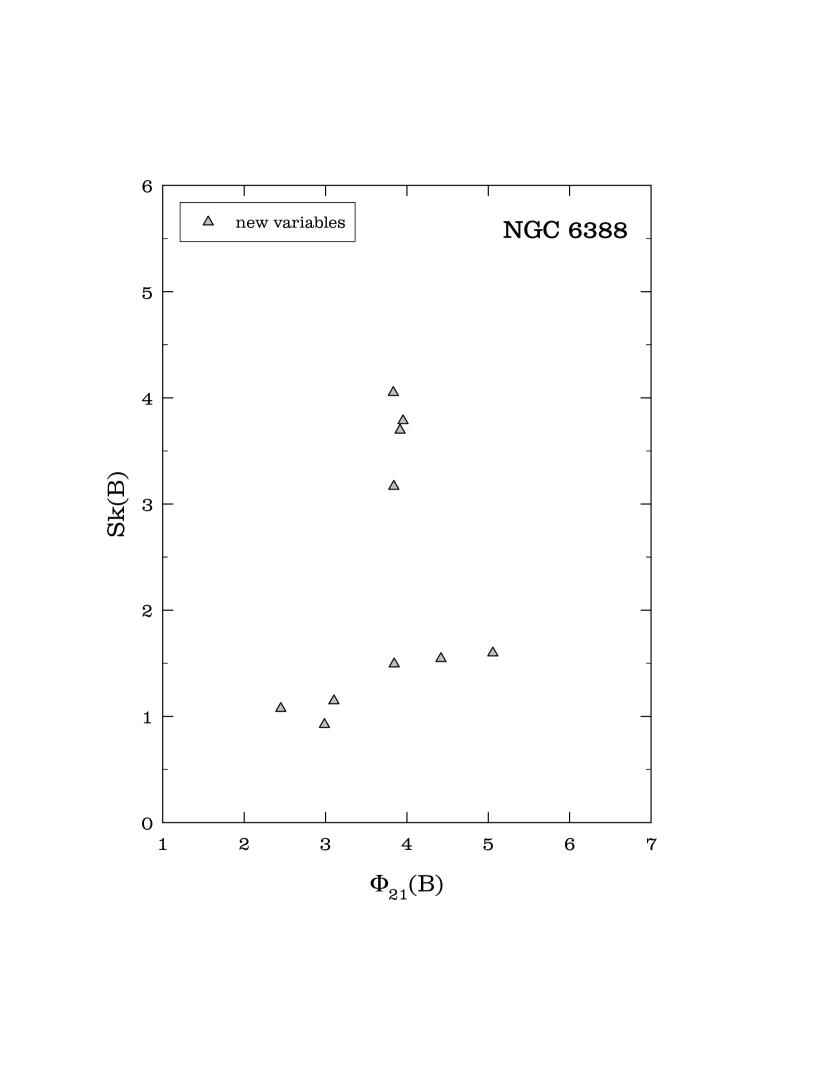
For NGC 6388, for which no HST variable star analysis has been completed, Table 4 lists variable stars not previously detected in the Pritzl et al. (2002) study. Light curves for the new variables NV1 through NV12 are shown in Figure 3, whereas Figure 4 shows light curves for additional suspected variables of uncertain variability type.
| Variable | Sk | ||||||
|---|---|---|---|---|---|---|---|
| V106 | 0.13 | 0.05 | 0.08 | 3.21 | 5.34 | 3.07 | 1.49 |
| V107 | 0.54 | 0.32 | 0.13 | 3.99 | 1.92 | 6.08 | 3.69 |
| V108 | 0.15 | 0.10 | 0.05 | 2.99 | 4.93 | 2.72 | 0.96 |
| V109 | 0.09 | 0.06 | 0.10 | 3.43 | 5.83 | 3.59 | 1.62 |
| V110 | 0.51 | 0.23 | 0.10 | 4.10 | 2.09 | 6.13 | 3.44 |
| V111 | 0.42 | 0.33 | 0.09 | 4.22 | 1.00 | 5.61 | 1.78 |
| V112 | 0.56 | 0.38 | 0.17 | 4.00 | 1.73 | 6.03 | 4.29 |
| V113 | 0.60 | 0.48 | 0.20 | 3.88 | 1.33 | 5.23 | 4.35 |
| V114 | 0.66 | 0.31 | 0.19 | 3.68 | 1.61 | 5.00 | 2.34 |
| V115 | 0.41 | 0.10 | 0.06 | 3.68 | 2.48 | 5.17 | 2.28 |
| V116 | 0.57 | 0.46 | 0.34 | 3.84 | 1.52 | 5.43 | 4.32 |
| V117 | 0.54 | 0.19 | 0.18 | 4.09 | 1.95 | 5.79 | 1.93 |
| V119 | 0.59 | 0.36 | 0.23 | 3.95 | 1.73 | 5.46 | 3.81 |
| V120 | 0.12 | 0.03 | 0.02 | 3.39 | 0.55 | 4.21 | 1.03 |
| V121 | 0.44 | 0.25 | 0.08 | 3.84 | 1.69 | 1.78 | 2.70 |
| V122 | 0.50 | 0.29 | 0.15 | 3.94 | 1.92 | 5.83 | 3.74 |
| V123 | 0.18 | 0.08 | 0.08 | 3.62 | 5.45 | 2.83 | 1.54 |
| V124 | 0.09 | 0.05 | 0.07 | 3.63 | 3.83 | 2.64 | 1.38 |
| V125 | 0.18 | 0.07 | 0.07 | 3.11 | 5.61 | 2.90 | 1.07 |
| V140 | 0.28 | 0.16 | 0.09 | 3.62 | 1.00 | 5.38 | 1.28 |
| V141 | 0.15: | 0.23: | 0.18: | 5.23: | 0.44: | 4.54: | 1.35: |
| V142 | 0.35 | 0.15 | 0.11 | 5.23 | 2.94 | 5.24 | 1.98 |
| V143 | 0.70: | 0.01: | 0.10: | 3.78: | 4.00: | 5.78: | 2.38 |
| V146(NV1) | 0.16 | 0.16 | 0.12 | 1.66 | 6.17 | 0.37 | 0.90 |
| V147(NV2) | 0.13 | 0.08 | 0.07 | 3.82 | 6.00 | 2.74 | 0.92 |
| V148(NV3) | 0.11 | 0.05 | 0.04 | 3.73 | 0.29 | 0.49 | 1.04 |
| V149(NV4) | 0.27 | 0.12 | 0.03 | 3.31 | 0.47 | 4.32 | 1.08 |
| V150(NV5) | 0.19 | 0.03 | 0.12 | 4.71 | 5.85 | 5.01 | 1.36 |
Eighteen new or suspected variables were detected in NGC 6388. The stars labeled NV1 through NV12 seem securely established as variables. They would therefore become NGC 6388 variables V58 through V69, respectively. The nature of the suspected variables, SV1 through SV6, is less certain. Note that SV1 through SV4 are not the same as the suspected variables S1 - S4 listed in Silbermann et al. (1994). Four of these stars are listed as being possible type II Cepheids, based primarily upon the approximate periods indicated by the data. Additional data are needed to confirm this classification. The Delta RA and Delta dec columns of Table 4 give the positions of the new variables in arc seconds relative to the cluster center, and are on the system of Pritzl et al. (2002).
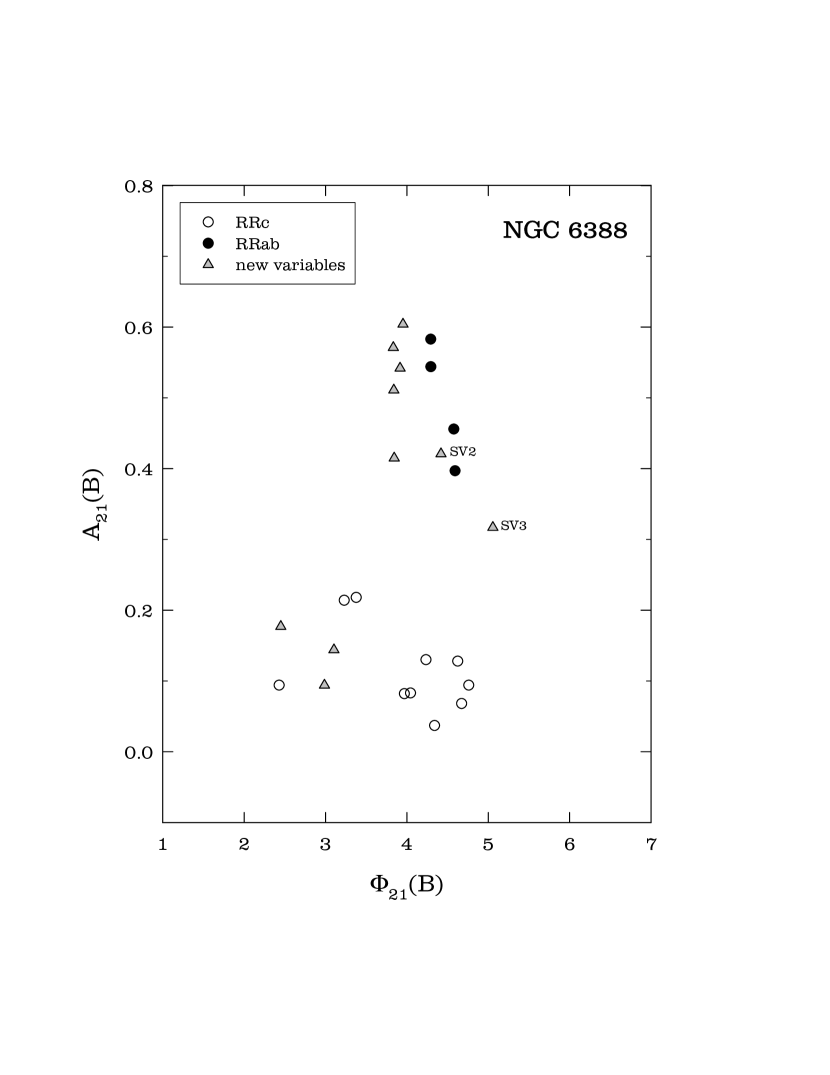
The Fourier and skewness parameters for the newly discovered RR Lyrae in NGC 6388 are listed in Table 5. Plots of versus and skewness versus are shown in Figures 7 and 8. In Figure 7 points for known RRab and RRc stars in NGC 6388 are plotted, using the data from Table 6 of Pritzl et al. (2002). Although those results were based upon standard band light curves, they show the same pattern as do the results from our differential flux light curves. Most of the newly discovered RR Lyrae fall clearly into the RRab or RRc class as indicated in Table 4, but a few cases are still ambiguous.
These results clearly illustrate the power of the image subtraction method to detect variable stars in crowded fields. In these particular cases, the ability of image subtraction analysis applied to ground-based images to identify variable stars is comparable to that based on much better resolved HST images, at least as regards variables of relatively large amplitude. Only in the most crowded areas of the cluster, within 10 arcsec of the cluster center, does the ISIS analysis seem to do significantly worse than Pritzl et al. (2003) in detecting variable stars. In any case, it must be noted that the seeing in our ground-based images was quite mediocre, ranging from to (with a typical seeing of ). It should be remembered, though, that the ISIS program provides light curves in the form of differential fluxes only, and it is not possible for differential-image techniques alone to recover all the information that can be obtained from direct photometric techniques. In particular, no mathematically rigorous algorithm exists for transforming the ISIS differential fluxes to magnitudes on a fundamental scale without additional photometric information obtained by some other method.
| Variable | ISIS period | Delta RA | Delta dec | Type |
|---|---|---|---|---|
| NV1(V58) | 0.683 | -27.40 | -7.16 | RRab |
| NV2(V59) | 0.589 | 6.75 | 12.28 | RRab |
| NV3(V60) | 0.372 | 0.00 | -16.29 | RRc |
| NV4(V61) | 0.657 | -12.70 | -5.18 | RRab |
| NV5(V62) | 0.708 | -8.73 | -0.42 | RRab |
| NV6(V63) | 2.045 | 8.52 | -2.21 | Ceph |
| NV7(V64) | 0.595 | -1.79 | -9.21 | RRab |
| NV8(V65) | 0.395 | -4.77 | 16.68 | RRc |
| NV9(V66) | 0.350 | -10.08 | -9.16 | RRc |
| NV10(V67) | 2.27 | -131.87 | -74.75 | Ceph |
| NV11(V68) | 0.946 | 11.51 | 27.76 | RRab? |
| NV12(V69) | 3.60 | 3.29 | -10.84 | Ceph? |
| SV1 | 8 | 4.26 | 7.33 | Ceph? |
| SV2 | 0.847 | 6.18 | 2.90 | RRab? |
| SV3 | 0.333 | 4.81 | -24.92 | RRc? |
| SV4 | 12 | 4.25 | -8.69 | Ceph? |
| SV5 | 4.5 | 0.94 | -7.18 | Ceph? |
| SV6 | 7 | -7.78 | -24.34 | Ceph? |
| Variable | Sk | ||||||
|---|---|---|---|---|---|---|---|
| NV1 | 0.55 | 0.31 | 0.16 | 3.96 | 1.71 | 5.69 | 3.69 |
| NV2 | 0.51 | 0.35 | 0.19 | 3.77 | 1.47 | 5.47 | 3.78 |
| NV3 | 0.19 | 0.13 | 0.05 | 2.48 | 5.45 | 4.23 | 1.08 |
| NV4 | 0.57 | 0.38 | 0.22 | 3.84 | 1.64 | 5.73 | 4.05 |
| NV5 | 0.51 | 0.26 | 0.13 | 3.85 | 1.83 | 5.46 | 3.17 |
| NV7 | 0.40 | 0.30 | 0.23 | 3.99 | 1.30 | 5.17 | 1.49 |
| NV8 | 0.10 | 0.07 | 0.05 | 2.95 | 5.42 | 2.64 | 0.92 |
| NV9 | 0.13 | 0.08 | 0.05 | 3.16 | 5.50 | 3.07 | 1.15 |
| SV2 | 0.46 | 0.080 | 0.13 | 4.36 | 0.03 | 4.96 | 1.54 |
| SV3 | 0.31 | 0.15 | 0.20 | 5.00 | 4.67 | 4.02 | 1.60 |
4. Notes on Individual Stars in NGC 6441
V107, V113, V115, V121— The ISIS period that best phases our data is slightly different from the HST period. This is shown in Table 1.
V140 — The Pritzl et al. (2003) period does not phase our data. Our smoothest light curve is obtained with a period of 0.616 d. However, the light curve, as seen in Figure 1, is very symmetrical, and, except for the relatively sharp peak, resembles that of an RRc variable. A reanalysis of the WFPC2 photometry from Pritzl et al. (2003) shows that a period of 0.6141 d fits the data, although the light curve shows the star to spend less time at minimum light than is often the case. Thus, it seems likely that the longer period is correct. Note that at present the longest confirmed period for an RRc variable in a globular cluster is about 0.56 d, with only one candidate RRc having recently been suggested with a period longer than 0.6 d (Contreras et al. 2005). Because the Fourier and skewness parameters for V140 do not give a clear classification, further data are needed to confirm whether V140 is an RRab or RRc star.
V141 — Our smoothest light curve is obtained with a period of 0.457 d, as shown in Figure 1. However, the resulting light curve is unusual looking. A period of 0.847 d gives almost as good a light curve and is more consistent with the period in Pritzl et al. (2003). Thus, the longer period has been adopted.
V142 — The HST period phases our data well. However, the resulting light curve is unusual looking.
NV1 (V146) — We could not find a period that phases our data well. The best period we could determine is 0.402 day, which may suggest an RRc variable. We note that, among Oosterhoff type II clusters such as M15, a period near 0.402 day and a light curve showing scatter are sometimes indicators that a star is a double-mode pulsator. However, no double-mode RR Lyrae stars have yet been discovered in NGC 6441 and, since NGC 6441 seems to contain some RRc stars with periods longer than 0.402 day, it is not clear whether one might expect that double-mode RR Lyrae stars in that cluster would have first overtone mode periods near 0.402 day.
NV4 (V149) and NV5 (V150)— These variables have periods of 0.557 d and 0.529 d, again relatively long for RRc-type variables. However, the differential flux light curves are more symmetric than is typical of RRab variables, which would suggest an RRc classification. Long-period RRc variables, while exceedingly rare in globular clusters in general (Catelan 2004 and references therein), have previously been found in both NGC 6388 and NGC 6441 (Pritzl et al., 2001, 2002, 2003).
5. Discussion
The ISIS analysis of the ground-based observations of NGC 6441, in spite of seeing ranging from to , rediscovered virtually all of the RR Lyrae stars and Cepheids catalogued by Pritzl et al. (2003). ISIS also identified a few possible variable candidates not appearing in the Pritzl et al. catalog. This confirms the utility of ISIS for identifying and classifying the brighter variable stars in crowded fields. On the other hand, ISIS does not by itself provide light curves on a standard photometric system, as do reduction routines such as daophot, nor does it give astrometric positions as accurate as those obtained from WFPC2.
Including the five newly discovered variables, we find that NGC 6441 is now known to contain 68 probable RR Lyrae variables. Accepting NV1, 2, and 3 as RRc variables, and taking account of the uncertainty Bailey type of V140, NGC 6441 contains 42 known RRab stars and 23 known RRc stars, changing the ratio of RRc to all RR Lyrae stars from the value of 0.33 found in Pritzl et al. (2003) to 0.35. The resultant mean periods are 0.759 d and 0.392 d for the RRab and RRc stars, respectively. If NV4 and NV5 are also actually RRc variables, then the total of RRc stars increases to 25 and their mean period increases to 0.404 d. In either case, NGC 6441 remains among the clusters with the largest values of and .
For NGC 6388, five of the new variables seem to be clearly RRab stars and three are RRc stars. Adding these variables to those in Pritzl et al. (2002) gives a total of 22 probable RR Lyrae stars. Of these, nine are RRab stars and 11 are RRc stars (if, as Pritzl et al. (2002) suggest, V26 and V34 are excluded as nonmembers). These totals do not include the variables listed as questionable c or ab type stars in Table 3 of Pritzl et al. (2002). It is probable that many of the questionable stars are in fact RR Lyrae variables, as indicated in Pritzl et al. (2002), but for various reasons the light curves of these stars were noisy or incomplete. If all of the additional stars listed as “c?” or “ab?” variables in Table 4 are included, the number of RRc stars goes up by 7 and the number of RRab variables goes up by 2. From the confirmed RRab and RRc variables, Pritzl et al. (2002) obtained a ratio of RRc to total RR Lyrae stars of 0.67 (or 0.71 if v26 and V34 are included). The new discoveries revise this ratio to 0.55 (without V26 and V34) or 0.59 (with V26 and V34). The resultant mean periods are d (excluding all questionable RRab stars) and d (with V26 and V34) or 0.387 d (without V26 and V34). Because the new variables make a significant addition to the RR Lyrae inventory for NGC 6388, we show a revised histogram over period in Figure 9. V26 and V34 have been excluded from this histogram as possible field stars, but all other probable RR Lyrae stars in Table 3 of Pritzl et al. (2002) have been included. The identification of additional probable and suspected type II Cepheids in NGC 6388 confirms its status as a cluster rich in such variables. This further strengthens the unusual status of NGC 6388 and NGC 6441 as metal-rich globular clusters also rich in type II Cepheids.
The periods of the RRc stars in NGC 6388 and NGC 6441 can be transformed to their fundamental mode equivalents by adding 0.128 to the logarithms of their periods. The resultant histograms for RR Lyrae stars in these two clusters are shown in Figure 10. In the case of NGC 6441, we plot V118 as an RRab star, although Pritzl et al. (2003) noted that it might possibly be a type II Cepheid. The newly found variables V146, V147, and V148 have been included. The fundamentalized histogram for NGC 6388 climbs toward the short period end, indicating that the hotter side of the RR Lyrae instability strip is more populated than the cooler side. Although the histogram for NGC 6441 shows some peaks, no such overall trend is clearly discernable. Color-magnitude diagrams of the horizontal branches of NGC 6388 and NGC 6441 (Pritzl et al., 2003; Busso et al., 2004) show that the density of stars on the blue extensions to the horizontal branch in both cases declines toward the cool side of the instability strip, eventually increasing again when a strong concentration of red horizontal branch stars is reached. If this decline takes place within the instability strip in the case of NGC 6388 but mostly to the cool side of the instability strip in the case of NGC 6441, then the existence of a trend in the NGC 6388 histogram but not in that of NGC 6441 can be understood. For further discussion on the relation between the star distribution in the HR diagram and the resulting period distribution, the reader is referred to Rood & Crocker (1989), Catelan (2004a), and Castellani et al. (2005).
Although their metallicities are much higher than those of canonical Oosterhoff type II clusters such as M15 (NGC 7078) or M68 (NGC 4590), the mean periods of RR Lyrae stars in NGC 6388 and NGC 6441 are as large as, or larger than, those in Oosterhoff type II systems. We can compare the fundamentalized histograms of Figure 10 with those of M15 and M68 – see Figure 1 in Castellani et al. (2004). NGC 6441 and, to a lesser extent, NGC 6388 have a higher proportion of RR Lyrae stars with periods longer than 0.8 days. Otherwise, the differences are not greater than are seen among the histograms of more ordinary clusters. The peak toward the shorter period end of the NGC 6388 histogram is similar to that seen in the histogram of M68. M15 also shows a peak toward shorter periods, but, like NGC 6441, the Oosterhoff type II cluster M2 (NGC 7089) shows a relatively flat distribution of RR Lyrae periods. In this sense, it is clear that neither NGC 6388 nor NGC 6441 show sharply peaked period distributions to the same extent that is seen in the case of the Oosterhoff type I cluster M3 (NGC 5272) (Rood & Crocker, 1989; Catelan, 2004a). Pritzl et al. (2002) did note that there was one Oosterhoff type II globular cluster that shared some of the peculiarities of NGC 6388 and NGC 6441. The unusual globular cluster Centauri, like NGC 6388 and NGC 6441, contains some RRab and RRc stars of especially long period. In the case of Cen the long period RR Lyrae stars are, however, accompanied by a shorter period RR Lyrae population, so that the mean period of RRab stars in Cen is shorter than in NGC 6388 or NGC 6441.
References
- Alard (2000) Alard, C. 2000, A&A, 144, 235
- Alard & Lupton (1998) Alard, C., & Lupton, R. H. 1998, ApJ, 503, 325
- Armandroff & Zinn (1988) Armandroff, T., & Zinn, R. 1988, AJ, 96, 92
- Baldacci et al. (2005) Baldacci, L., Rizzi, L., Clementini, G., & Held, E.V., 2005, A&A, 431, 1189
- Bruntt et al. (2003) Bruntt, H., et al. 2003, A&A, 410, 323
- Busso et al. (2004) Busso, G., Piotto, G., & Cassisi, S. 2004, Mem. S. A. It., 76, 46
- Carney (2001) Carney, B. W. 2001, in Star Clusters, ed. L. Labhardt & B. Binggeli (Berlin: Springer), 1
- Castellani et al. (2004) Castellani, M., Caputo, F., & Castellani, V. 2004, A&A, 410, 871
- Castellani et al. (2005) Castellani, M., Castellani, V., & Cassisi, S. 2005, A&A, 437, 1017
- Catelan (2004a) Catelan, M. 2004a, ApJ, 600, 409
- Catelan (2004b) Catelan, M. 2004b, in ASP Conf. Ser. 310, Variable Stars in the Local Group, ed. D. W. Kurtz & K. R. Pollard (San Francisco: ASP), 113
- Catelan (2006) Catelan, M. 2006, in ASP Conf. Ser., Resolved Stellar Populations, ed. D. Valls-Gabaud & M. Chavez (San Francisco: ASP), in press (astro-ph/0507464)
- Clementini et al. (2005) Clementini, G., Gratton, R., Bragaglia, A., Ripepi, V., Martinez Fiorenzano, A., Held, E., & Carreta, E. 2005, ApJ, 630, L145
- Contreras et al. (2005) Contreras, R., Catelan, M., Smith, H. A., & Pritzl, B. J. 2005, ApJ, 623, L117
- Corwin et al. (2003) Corwin, T. M., Catelan, M., Smith, H. A., Borissova, J., Ferraro, F. R., & Raburn, W. S. 2003, AJ, 125, 2543
- Corwin et al. (2004) Corwin, T. M., Catelan, M., Borissova, J., & Smith, H. A. 2004, A&A, 421, 667
- Harris (1996) Harris, W.E. 1996, AJ, 112, 1487
- Lafler & Kinman (1965) Lafler, J., & Kinman, T.D., 1965, ApJS, 11, 216
- Layden et al. (1999) Layden, A. C., Ritter, L. A., Welch, D. L., & Webb, T.M.A. 1999, AJ, 117, 1313
- Mochejska et al. (2002) Mochejska, B.J., et al. 2002, AJ, 123, 3460
- Piotto et al. (1997) Piotto, G. et al. 1997, in Advances in Stellar Evolution, ed. R.T. Rood & A. Renzini (Cambridge: Cambridge University Press), 84
- Pritzl et al. (2000) Pritzl, B., Smith, H. A., Catelan, M., & Sweigart, A. V., 2000, ApJ, 530, L41
- Pritzl et al. (2001) Pritzl, B., Smith, H. A., Catelan, M., & Sweigart, A. V. 2001, AJ, 122, 2600
- Pritzl et al. (2002) Pritzl, B., Smith, H. A., Catelan, M., & Sweigart, A. V. 2002, AJ, 123, 949
- Pritzl et al. (2003) Pritzl, B., Smith, H. A., Stetson, P. B., Catelan, M., Sweigart, A. V., Layden, A. C., & Rich, R. M. 2003, AJ, 126, 1381
- Ree et al. (2002) Ree, C. H., Yoon, S.-J., Rey, S.-C., & Lee, Y.-W. 2002, in ASP Conf. Ser. 265, Omega Centauri: A Unique Window Into Astrophysics, ed. F. van Leeuwen, G. Piotto, & J. Hughes (San Francisco: ASP), 101
- Rich et al. (1997) Rich, R. M., et al. 1997, ApJ, 484, L25
- Rood & Crocker (1989) Rood, R. T., & Crocker, D. A. 1989, in IAU Colloq. 111, The Use of Pulsating Stars in Fundamental Problems of Astronomy, ed. E. G. Schmidt (Cambridge: Cambridge University Press), 218
- Silbermann et al. (1994) Silbermann, N.A., Smith, H.A., Bolte, M., & Hazen, M.L. 1994, AJ, 107, 1764
- Smith (1995) Smith, H. A. 1995, RR Lyrae Stars (Cambridge: Cambridge Univ. Press)
- Stellingwerf & Donahue (1987) Stellingwerf, R. F., & Donohoe, M. 1987, ApJ, 314, 252
- Stetson (1994) Stetson, P. B. 1994, PASP, 106, 250
- Stetson (1987) Stetson, P. B. 1987, PASP, 99, 191
- Sweigart (2002) Sweigart, A. V. 2002, in Highlights of Astronomy, ed. H. Rickman (San Francisco: ASP), 12, 292
- Sweigart & Catelan (1998) Sweigart, A. V., & Catelan, M. 1998, ApJ, 501, L63
- Trager et al. (1995) Trager, S. C., King, I. R., & Djorgovski, S. 1995, AJ, 109, 1669; erratum: AJ, 109, 1912