Ammonia as a tracer of chemical equilibrium in the T7.5 dwarf Gliese 570D
Abstract
We present the first analysis of an optical to mid-infrared spectrum of the T7.5 dwarf Gliese 570D with model atmospheres, synthetic spectra, and brown dwarf evolution sequences. We obtain precise values for the basic parameters of Gl 570D: – 820 K, – 5.23, and to . The Spitzer IRS spectrum shows prominent features of ammonia (NH3) that can only be fitted by reducing the abundance of NH3 by about one order of magnitude from the value obtained with chemical equilibrium models. We model departures from chemical equilibrium in the atmosphere of Gl 570D by considering the kinetics of nitrogen and carbon chemistry in the presence of vertical mixing. The resulting model spectrum reproduces the data very well.
Subject headings:
stars: abundances — stars: atmospheres — stars: individual (Gliese 570D) — stars: low-mass, brown dwarfs1. Introduction
Ammonia is the only significant nitrogen-bearing compound that can be readily observed in brown dwarfs. Its presence in very cool brown dwarf atmospheres has been expected for some time (Tsuji, 1964; Marley et al., 1996; Fegley & Lodders, 1996; Saumon et al., 2000; Allard et al., 2001; Lodders & Fegley, 2002; Burrows, Sudarsky, & Lunine, 2003; Saumon et al., 2003). Saumon et al. (2000) reported a detection of weak NH3 features in the near infrared spectrum of the T7p dwarf Gl 229B but a clear detection had to await the Spitzer InfraRed Spectrograph (IRS) observation of the T1/T6 binary Indi Bab (Roellig et al., 2004). IRS spectra also reveal the presence of NH3 in all observed dwarfs with spectral types of T2 and later (Cushing et al., 2006).
In addition to its importance as a strong absorber in very cool brown dwarfs, NH3 provides an important window into the phenomenon of non-equilibrium chemistry. Because some chemical reactions proceed very slowly at the relatively low temperatures encountered in the atmospheres of T dwarfs, vertical transport can lead to chemical abundances that depart from local thermodynamic equilibrium. This phenomenon has long been established in Jovian planets (Barshay & Lewis, 1978; Fegley & Prinn, 1985; Fegley & Lodders, 1994; Lodders & Fegley, 1994). In brown dwarfs, the strongest expected signatures of departures from equilibrium chemistry are an overabundance of CO and depletion of NH3. The prediction of non-equilibrium chemistry in brown dwarfs (Fegley & Lodders, 1996) was quickly confirmed by the detection of the 4.7m band of CO in Gl 229B (Noll et al., 1997), and subsequently by the detection of NH3 in a high-resolution near-IR spectrum (Saumon et al., 2000). Nonequilibrium chemistry may be common in cool brown dwarfs since photometry shows a systematic flux depletion in T6 – T9 dwarfs that can be attributed to enhanced CO 4.7m absorption (Golimowski et al., 2004) relative to models in chemical equilibrium that
With a spectral type of T7.5 (Burgasser et al., 2006), Gl 570D is one of the latest T dwarfs known and its IRS spectrum shows the strongest 10 – 11m NH3 absorption observed so far (Cushing et al., 2006). It is a particularly interesting target since it is a wide companion to the well-studied K4 V star Gl 570A and to a pair of M dwarfs, Gl 570BC. The distance, metallicity, and age of the system very effectively reduce the parameter space allowed to model Gl 570D. Geballe et al. (2001) used these constraints to determine the effective temperature and gravity of Gl 570D and to analyze its optical and near infrared spectrum. Here, we take advantage of the new spectroscopic information provided by the IRS spectrum to redetermine . We also perform the first quantitative analysis of the NH3 10 – 11m band for any brown dwarf.
2. Observations and Data Reduction
Our analysis of Gl 570D is based on spectroscopic data covering most of its spectral energy distribution. We combine a Keck LRIS 0.63 – 1.01m optical spectrum (Burgasser et al., 2003) with a UKIRT CGS4 near IR spectrum covering 0.79 - 1.35m and 1.43 – 2.52m (Geballe et al., 2001), and a IRS Short Low module spectrum which covers 5.43 – 14.68m (Cushing et al., 2006). Absolute flux calibration for the UKIRT and IRS spectra was obtained by using MKO photometry (Leggett et al., 2002) and IRAC band 4 photometry (B. Patten, priv. comm.), respectively. The far red optical spectrum was then scaled to match the flux density level of the flux-calibrated UKIRT spectrum.
3. Models: evolution and spectra
We analyze the spectrum of Gl 570D with a combination of model atmospheres, synthetic spectra and evolution sequences. Its T7.5 spectral type strongly suggests that its atmosphere is free of condensates and we use cloudless model atmospheres and synthetic spectra which were most recently described in Fortney et al. (2006) and references therein. Averaging recent metallicity determinations for Gl 570A (Thorén & Feltzing, 2000; Santos et al., 2005; Valenti & Fisher, 2005) gives [Fe/H]=0.09. This slight enrichment is negligible in view of the other uncertainties in the data and models and our entire analysis assumes solar metallicity.
We have developed an evolution code for brown dwarfs that assumes an adiabatic internal structure. It uses the H/He equation of state of Saumon et al. (2005). Nuclear energy generation through the first branch of the pp-chain (Burrows & Liebert, 1993) is included. We use the NACRE nuclear reaction rates (Angulo et al., 1999) and ion-ion and electron-ion screening factors (Chabrier, priv. comm.) The surface boundary condition is obtained from our atmosphere models. All brown dwarf atmosphere models become convective at depth, where the specific entropy of the gas becomes essentially constant. The value of the entropy at the bottom of the atmospheres gives the entropy for the adiabatic interior. The boundary condition is described as a tabulated function . Thus, our cooling sequences are fully consistent with the atmosphere models (Chabrier & Baraffe, 1997). Details of the evolution calculation will be provided in a future publication.
4. Determination of the physical parameters
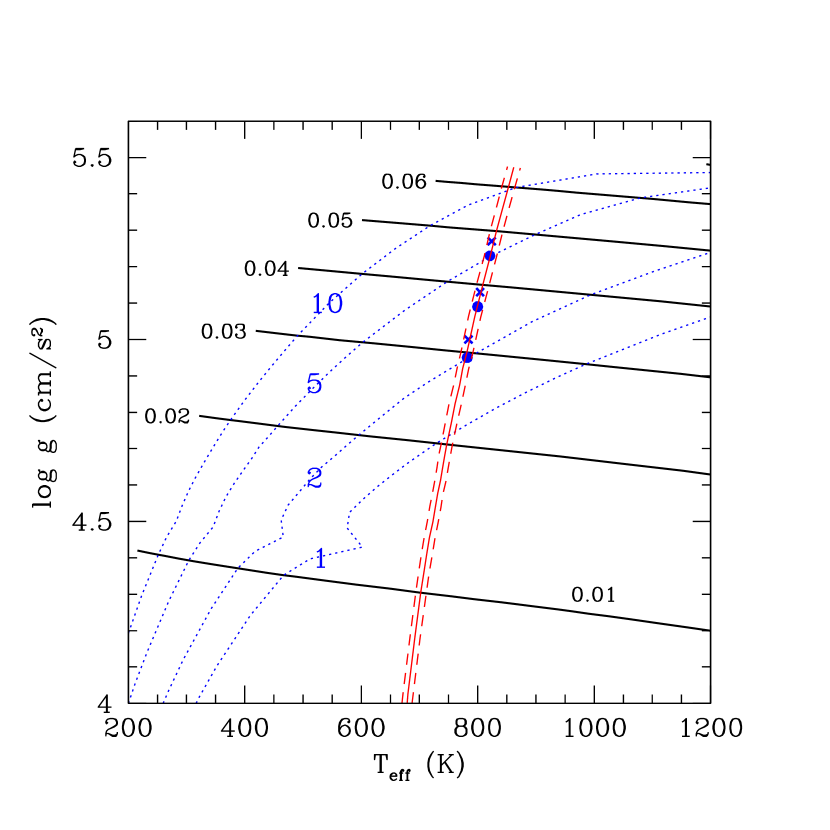
We follow the method developed by Saumon et al. (2000) and initially applied to Gl 570D by Geballe et al. (2001). Briefly, we used the optical, near-IR and mid-IR spectra to determine the integrated flux observed at Earth (erg/s/cm2).111The uncertainty estimate is obtained from the uncertainties in the absolute calibration of each piece of the SED (3% for the optical spectrum, 5% for the near-IR spectrum and 6.5% for the IRS spectrum). A total uncertainty of 5.7% is based on conservatively assuming that the individual calibration uncertainties all add in the same direction. The 1% uncertainty on the distance (Perryman et al., 1997) is negligible by comparison. This represents about 70% of the bolometric flux of Gl 570D. We use our grid of model spectra to compute the bolometric correction and the bolometric luminosity, , which depends on the yet-to-be-determined and . An independent relation is given by our evolution sequences. A consistent solution between the spectrum and the evolution is obtained by imposing . This gives a family of solutions (Fig. 1). A combination of age indicators shows that the Gl 570 system is between 2 and 5 Gyr old (Geballe et al., 2001), which constrains the range of the gravity to that shown by the isochrones in Fig. 1 and the models in Table 1. Models A and C bracket the age limits and model B corresponds to the midpoint. This new determination of the physical parameters of Gl 570D differs from that of Geballe et al. (2001) in several ways. The observed SED has been greatly extended by the Spitzer IRS spectrum and the near-IR spectrum has been recalibrated using the latest MKO photometry. The atmosphere models have steadily improved, most notably with the inclusion of a more extensive line list for CH4 (Champion et al., 1992; Freedman & Lodders, 2006). Finally, the evolution is computed with an independent code, using our cloudless atmosphere grid as the surface boundary condition, rather than relying on the sequences of Burrows et al. (1997). Despite all these changes, the parameters obtained for Gl 570D are remarkably similar to those of Geballe et al. (2001) (crosses on Fig. 1). Most of the difference can be attributed to a shift of the isochrones in the plane between our evolution sequences and those of Burrows et al. (1997) caused mainly by the different surface boundary conditions. This shows that the method is quite robust and that further improvements in the models will not affect the values in Table 1 significantly.
Figure 1 shows that the main uncertainty in the of Gl 570D arises from the uncertainly in the age of the system. By comparison, the uncertainty on from the flux calibration of the data is small.
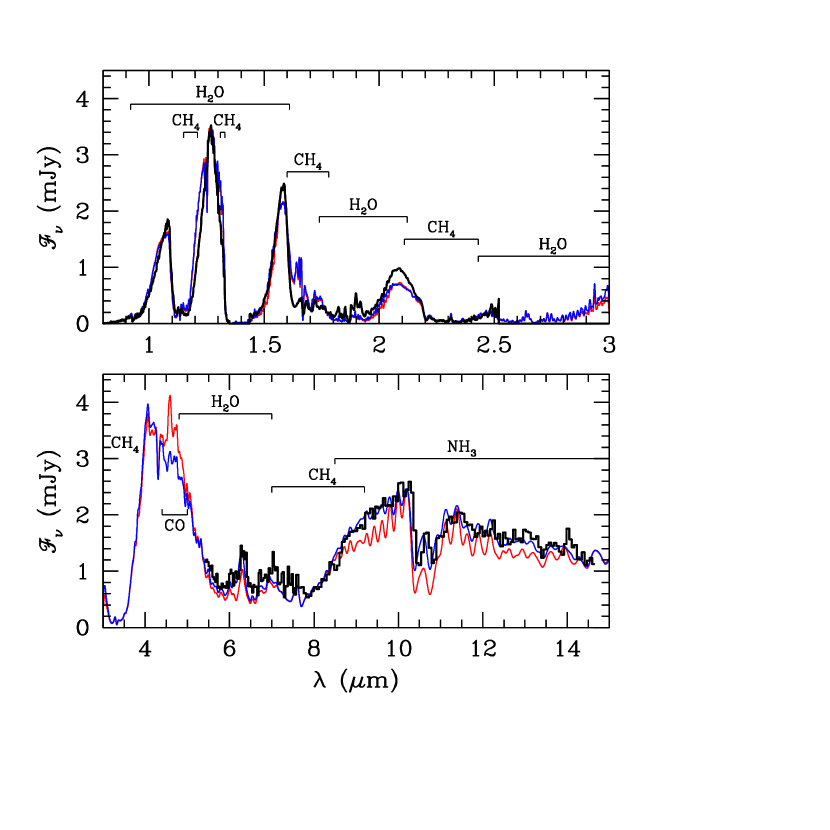
Given , , the radius from the evolution, and the parallax of Gl 570A, we can compute model fluxes at Earth that can be compared directly to the data. The model B spectrum is shown in Fig. 2. This is not a fit of the spectrum per se, but it is obtained solely from the procedure outlined above. The agreement with the optical and near-IR data is generally excellent. The deviations in the 1.6 – 1.7m region are due to the incomplete CH4 line list. The reason for the underestimated band flux is unclear. Models computed with the slightly higher metallicity of Gl 570A would give a higher band flux. A similar effect could also be obtained by flux redistribution from a stronger CH4 1.6m band computed from a more complete line list. We find that a cloudy model with a thin cloud deck parameterized by a sedimentation parameter (Fortney et al., 2006; Ackerman & Marley, 2001), can also improve substantially the agreement with the observed band peak.
In the mid-IR, the model systematically underestimates the flux beyond 9m, which coincides with strong absorption by NH3. The outlier models (A & C in Table 1) give very similar synthetic spectra. The differences remain below mJy in the near-IR and below mJy in the mid-IR, with higher gravity models giving lower fluxes.
5. Nonequilibrium chemistry of NH3
Vertical transport in the atmosphere of a T dwarf will result in a reduced NH3 abundance, which will increase the model flux for m and improve the agreement with the IRS spectrum. We consider atmosphere models that depart from chemical equilibrium to optimize the fit to the data.
The kinetics of the chemistry of carbon and nitrogen in giant planets and brown dwarfs has been described in details in Lewis & Prinn (1980); Fegley & Lodders (1994); Griffith & Yelle (1999); Lodders & Fegley (2002); Bézard et al. (2002); Lodders & Fegley (2006) and the effect on the spectra of brown dwarfs in Saumon et al. (2003). We only provide a brief summary of nonequilibrium chemistry here.
5.1. Nonequilibrium carbon and nitrogen chemistry
The chemistry of carbon and nitrogen in brown dwarfs atmospheres is essentially described by the net reactions
| (1) |
| (2) |
Because of the large binding energies of CO and N2, both reactions proceed much more slowly to the right than to the left. Vertical mixing dredges up hot gas that is relatively rich in CO and N2 to the cooler part of the atmosphere, where CO and N2 are converted very slowly into CH4 and NH3, respectively. The net result is a relative overabundance of CO and N2 in the upper atmosphere and decreased abundances of CH4 and NH3 in the upper atmosphere. The abundance of H2O is also reduced by conservation of the total number of oxygen atoms.
The correct chemical pathway and reaction time scale for the conversion of CO into CH4 remains uncertain (Yung et al., 1988; Griffith & Yelle, 1999; Bézard et al., 2002; Lodders & Fegley, 2002; Visscher & Fegley, 2005). We adopt the “fast” chemical time scale of Yung et al. (1988). For the N2 conversion, we adopt the time scale given in Lodders & Fegley (2002).
5.2. Vertical Transport
Slow mixing can occur in the radiative zones of atmospheres through a variety of processes such as the turbulent decay of waves propagated upward from the convective/radiative boundary and instabilities arising from rapid rotation. In the absence of any detailed modeling of these processes, we adopt a simple model of vertical mixing by eddy turbulence (Griffith & Yelle, 1999). This process is analogous to diffusion and occurs over a characteristic time scale , where is the pressure scale height and is the coefficient of eddy diffusion. ranges from to cm2/s in planetary stratospheres and it is the only free parameter in our non-equilibrium models.
The time scale for mixing in the atmospheric convection zone is where and are the convective mixing length and velocity, respectively, and are evaluated with the mixing length theory. For convenience, we choose . Note that .
5.3. Quenching of the Chemistry
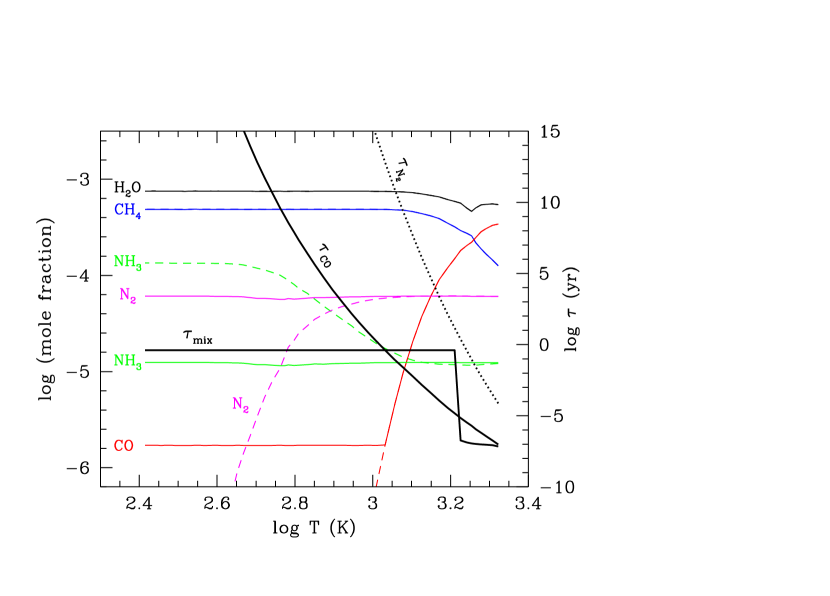
The chemical abundance profiles (Lodders & Fegley, 2002) in model atmosphere B are shown in Fig. 3. Depth in the atmosphere is indicated by the local temperature. The equilibrium abundances are shown with dashed lines that overlap solid lines for H2O and CH4. The transition in the carbon chemistry from CO deep in the atmosphere to CH4 near the surface occurs at . The N2 to NH3 transition occurs around . Remarkably, and in contrast to the carbon chemistry, the N2/NH3 equilibrium ratio remains nearly constant deep in the atmosphere due to a near cancellation of the increased temperature (favoring N2) and the increased pressure (favoring NH3) along this portion of the atmosphere profile.
The chemical time scales for the conversion of CO and N2 are shown by the heavy solid and dotted lines, respectively. These vary over more than 20 orders of magnitude throughout the atmosphere and become extremely long in the upper atmosphere. Mixing occurs rapidly in the convection zone but it is about 7 orders of magnitude slower in the radiative zone for our choice of cm2/s. In regions where , chemical equilibrium prevails. Where , however, abundances of CO, CH4, N2, NH3 and H2O will depart from equilibrium (solid lines). The nonequilibrium mole fractions are approximately determined by their values where . In our calculation, we adopt the scheme of Smith (1998) to determine this “quenching level.” As can be seen in Fig. 3, there can be more than one level where , resulting in alternating zones in and out of chemical equilibrium. For simplicity, we consider only the uppermost (lowest ) crossing. It turns out that in all cases, this is an excellent approximation to the full solution for the chemical profile since the deeper quenching occurs well below the level of formation of the corresponding molecular bands.
Figure 3 shows that above the CO quenching level () the nonequilibrium abundance of CO is orders of magnitude higher than at equilibrium. The abundances of CH4 and H2O are barely affected for this choice of (slow mixing). The NH3 abundance is reduced by about one order of magnitude in the upper atmosphere. In this model, N2 is quenched below the bottom of the atmosphere model, in a region where N2/NH3 is still nearly constant. The fact that the equilibrium mole fraction of NH3 is nearly constant for implies that the non-equilibrium NH3 abundance profile is completely insensitive to the choice of the eddy mixing coefficient over a very wide range (). This means that all plausible choices of will give the same NH3 abundance and therefore the same mid-IR spectrum.
5.4. Optimal model
In view of the above remarks, we arbitrarily choose cm2/s to compute nonequilibrium spectra for the three models in Table 1. Besides the choice of equilibrium or nonequilibrium chemistry, the only fitting parameter left is the gravity, constrained to be between the values for models A and C (Table 1). We determine the goodness of fit of a synthetic spectrum by computing the between the model and the data for m, which is where NH3 features are seen in the spectrum (Fig. 2). For this purpose, model spectra are smoothed to the IRS Short Low point source spectral resolution of with a Gaussian filter and then binned to the instrument’s wavelength sampling. The uncertainty () on the fitted is obtained by fitting 5000 simulated data sets generated by adding a random Gaussian noise distribution to each pixel with a width given by the individual pixel noise (mJy). We also fit renormalized spectra to account for the % calibration uncertainty, which turns out to be the dominant source of uncertainty. Nonequilibrium model C always gives the best fit. A reasonable fit ( worse than model C) is obtained with nonequilibrium model B if the observed flux is increased by the full 6.5% uncertainty. The best equilibrium model fit is worse than the best nonequilibrium model fit.
The nonequilibrium model C spectrum is shown by the dashed (blue) curve on Fig. 2. The agreement with the data is remarkable considering that all we have done is include non-equilibrium chemistry to the calculation and increase the gravity slightly, with no other free parameter. We conclude that the NH3 abundance is reduced by nonequilibrium chemistry and that the parameters of Gl 570D fall between models B and C, and much more likely closer to the latter.
6. Alternative explanations for the NH3 depletion
We briefly consider five possible explanations that could account for the enhanced mid-IR flux in Gl 570D: a low nitrogen abundance, an error in the temperature profile of the atmosphere, uncertain NH3 opacity, time variability, and photodissociation of NH3.
6.1. Low nitrogen abundance
The metallicity of Gl 570D is very nearly solar, based on abundance determinations of Na, Si, Ca, Ti, V, Cr, Fe, Co, and Ni in Gl 570A that range from [X/H] to 0.24, with a typical spread of between independent determinations (Santos et al., 2005; Thorén & Feltzing, 2000; Valenti & Fisher, 2005). To the best of our knowledge however, the N abundance has not been measured. A low [N/H] value would result in a decreased NH3 abundance that could potentially explain the relatively high mid-IR flux. The dependance of the mole fraction of ammonia on the nitrogen abundance is [N/H] (Lodders & Fegley, 2002). In our models, the strongest NH3 absorption occurs at a depth of in the atmosphere where the non-equilibrium chemistry reduces by a factor of 10 (Fig. 3). To obtain a similar reduction from a low nitrogen abundance would require [N/H], which would be an extreme departure from the abundances of other metals in Gl 570A.
In principle, N-bearing condensates may also cause a depletion of N-bearing gases in the atmosphere. However, there are no N-bearing condensates expected along the profile of Gl 570D that can significantly remove nitrogen, and temperatures are not low enough to allow NH4SH or NH3 condensation as in the much cooler upper atmospheres of the Jovian planets.
6.2. Uncertainties in the temperature profile of the atmosphere
Our determination of and our solution for are in excellent agreement with the values obtained by Geballe et al. (2001) without the benefit of the IRS spectrum. This indicates that while the near-IR flux has remained constant, the unknown mid-IR flux of Gl 570D in March 2000 could not be significantly different from that measured in Feb 2005. The fact that our equilibrium model is in very good agreement with the full SED of Gl 570D (Fig. 2) supports the notion that all pieces of the SED are consistent with each other. Finally, would have to increase to K to obtain an equilibrium NH3 mole fraction similar to the non-equilibrium value needed to fit the IRS spectrum. Such a high is completely incompatible with all of the Gl 570D observations. If we consider the temperature profile of the atmosphere, an increase of over 200 K (%) at bar would be required; an implausible error in our models, an inconsitent with the near-IR spectrum of Gl 570D.
6.3. Uncertainties in the NH3 opacity
The opacity of NH3 is computed from a line list obtained by combining the GEISA (Husson et al., 1992) and HITRAN (Rothman et al., 2004) data bases, complemented with recent laboratory measurements and theoretical calculations (see Burrows et al. (1997) for more details). To our knowledge, this compilation of NH3 opacity is the most complete presently available. Nonetheless, the line list is only complete up to K and transitions arising from levels that are excited only at higher temperatures are underrepresented or missing. Qualitatively, the NH3 opacity we calculate for Gl 570D is a lower limit to the actual opacity, implying that the derived underabundance of NH3 is an upper limit. More quantitatively, the 9–14m band of NH3 arises from the ground state (), with a small overlaping contribution from the excited state (). The energy differences between other excited vibrational states of NH3 is too large for the corresponding hot bands to overlap with the band. We are confident that the line list for the 9–14m band on which our analysis of the abundance of NH3 is based is quite complete.
6.4. Time variability of Gl 570D
The spectroscopic data analyzed here was gathered over a period of several years: The optical spectrum is from observations taken in March 2000 and Feb 2001 (Burgasser et al., 2003), the near-IR spectrum in March 2000 (Geballe et al., 2001) and the Spitzer IRS spectrum in February 2005 (Cushing et al., 2006). It is conceivable that the luminosity of Gl 570D may have varied during this 5 year period, affecting our determination of and and fortuitously result in our excellent fit of the combined spectrum with a model departing from chemical equilibrium. Burgasser et al. (2003) do not report any variation in the optical flux of Gl 570D between their two observations taken one year apart, and the reported equivalent width of Cs I and Rb I lines show no variation within 1.5. The near IR spectrum is calibrated to MKO photometry taken in Feb 2000 (Geballe et al., 2001). Repeat observations in July 2005 are fully consistent () with the original photometry. The 2MASS photometry of Gl 570D was obtained in May 1998. Applying the color transformations of Stephens & Leggett (2004) shows agreement to (), () and () with the MKO magnitudes. Based primarily on the stability of the near-IR MKO photometry, we conclude that any time variability in Gl 570D over a period of 7 years is at most at the 2-3% level. This is less than our estimate of a 5.7% uncertainty on .
Nevertheless, we consider the possibility that the absolute mid-IR flux may not be representative of the average or typical state of Gl 570D. If we relax the absolute flux calibration of the IRS spectrum, do we still see a NH3 depletion? For this purpose, we have repeated the fitting procedure described in §5.4, with the flux calibration adjusted by a factor that minimizes the value of . Allowing for the estimated noise in each pixel of the observed spectrum, we find that the non-equilibrium models always fit better than the equilibrium models at the level, with insignificant variation between models A, B and C.
6.5. Photodissociation of NH3
NH3 is a molecule that is easily dissociated by UV photons Å. Since Gl 570D is a companion to a main sequence star, it is possible that the UV flux from the primary results in a depletion of NH3 in Gl 570D. This process was discussed in details by Saumon et al. (2000) in the case of another late T dwarf with a companion, Gl 229B, where it was found to be completely negligible at the level of the photosphere. By comparison, the UV flux of the dK4 star Gl 570A is about 10 times larger than that of the dM1 star Gl 229A (based on the NextGen models of Allard & Hauschildt (1999)) but the flux incident on Gl 570D is smaller because of the much greater projected separation (1525 AU (Burgasser et al., 2000) rather than 44 AU (Golimowski et al., 1998) for Gl 229B). Since the atmospheres of both brown dwarfs are quite similar, we can expect that the photodissociation of NH3 in Gl 570D will be times that in Gl 229B. The Gl 570 BC pair of M dwarfs lies about 10 times closer to Gl 570A than Gl 570D and their contribution to the UV flux incident on Gl 570D is a small correction to the above estimate.
7. Conclusion
Our method to determine and the gravity of brown dwarfs is most effective when applied to objects with known parallax and which are members of systems where the primary provides the metallicity and age indicators. The method is based on integrated fluxes and evolution sequences rather than a direct fit of the spectrum, an approach that largely eliminates biases due to remaining systematic problems in the model spectra. With recalibrated optical and near-IR spectra and, most importantly, a Spitzer IRS spectrum, we have redetermined for Gl 570D to find nearly the same values as Geballe et al. (2001).
An excellent fit of the IRS spectrum can only be obtained if the NH3 abundance reduced by nearly one order of magnitude in the upper atmosphere. This is most readily explained by vertical mixing that drives the nitrogen chemistry away from chemical equilibrium (Lodders & Fegley, 2002). We have considered several other possible explanations but none of them are plausible.
We find that in late T dwarfs, the nonequilibrium N2/NH3 ratio generally does not depend on the efficiency of mixing in the atmosphere. Therefore, while the 10 – 11m band of NH3 is a sensitive indicator of nonequilibrium chemistry in brown dwarf atmospheres, it provides little information about the efficiency of mixing. On the other hand, the CO abundance is very sensitive to the choice of the mixing parameter , and photometric or spectroscopic observations of the 4.7m CO band is the most effective way to determine . Our study provides the most accurate parameters of any known brown dwarf (Fig. 1): – 820 K, – 5.23, – 0.0853, to , – 47 and an age of 3 to 5Gyr. The upper limit of this range (Fig. 1) is at least more likely than the lower limit. Gl 570D joins Gl 229B as the second T dwarf where the effect of nonequilibrium chemistry due to vertical transport has been demonstrated explicitly.
This work is based (in part) on observations made with the Spitzer Space Telescope, which is operated by the Jet Propulsion Laboratory, California Institute of Technology under NASA contract 1407. T. Roellig and M. Marley acknowledge the support of the NASA Office of Space Sciences. K. Lodders is supported by NSF grant AST04-06963. Part of this work was supported by the United States Department of Energy under contract W-7405-ENG-36, and NASA through the Spitzer Space Telescope Fellowship Program, through a contract issued by the Jet Propulsion Laboratory, California Institute of Technology under a contract with NASA. This research has benefited from the M, L, and T dwarf compendium housed at DwarfArchives.org and maintained by C. R. Gelino, J. D. Kirkpatrick, and A. J. Burgasser.
References
- Ackerman & Marley (2001) Ackerman, A. S. & Marley, M. S. 2001, ApJ, 556, 872
- Allard & Hauschildt (1999) Allard, F. Hauschildt, P. H. 1999, ApJ, 525, 871
- Allard et al. (2001) Allard, F. Hauschildt, P. H., Alexander, D. R., Tamanai, A., & Schweitzer, A. 2001, ApJ, 556, 357
- Angulo et al. (1999) Angulo, C. et al. 1999, Nucl. Phys. A, 656, 3
- Barshay & Lewis (1978) Barshay, S. S. & Lewis, J. S. 1978, Icarus, 33, 593
- Bézard et al. (2002) Bézard, B., Lellouch, E., Strobel, D., Maillard, J.-P. & Drossart, P. 2002, Icarus, 159, 95
- Burgasser et al. (2000) Burgasser, A. J., Kirkpatrick, J. D., Cutri, R. M., McCallon, H., Kopan, G., Gizis, J. E., Liebert, J., Reid, I. N., et al. 2000, AJ, 531, L57
- Burgasser et al. (2003) Burgasser, A. J., Kirkpatrick, J. D., Liebert, J. & Burrows, A. 2003, ApJ, 594, 510
- Burgasser et al. (2006) Burgasser, A. J., Geballe, T. R., Leggett, S. K., Kirkpatrick, J. D. & Golimowski, D. A. 2005, ApJ, 637, 1067
- Burrows & Liebert (1993) Burrows, A. & Liebert, J. 1993, Rev. Mod. Phys., 65, 301
- Burrows et al. (1997) Burrows, A., et al. 1997, ApJ, 491, 856
- Burrows, Sudarsky, & Lunine (2003) Burrows, A., Sudarsky, D., & Lunine, J. I. 2003, ApJ, 596, 587
- Chabrier & Baraffe (1997) Chabrier, G. & Baraffe, I. 1997, A&A, 327 1039
- Champion et al. (1992) Champion, J. P., Loete, M. & Pierre, G. 1992, in Spectroscopy of the Earth’s Atmosphere and the Interstellar Medium, K. N. Rao and A. Weber, Eds., 339
- Cushing et al. (2006) Cushing, M. C., Roellig, T. R., Marley, M. S., Saumon, D., Leggett, S. K., Kirkpatrick, J. D., Wilson, J. C., Sloan, G. C., et al. 2006, submitted to ApJ
- Fegley & Lodders (1994) Fegley, B. Jr. & Lodders, K. 1994, Icarus, 110, 117
- Fegley & Lodders (1996) Fegley, B. Jr. & Lodders, K. 1996, ApJ, 472, L37
- Fegley & Prinn (1985) Fegley, B. Jr. & Prinn, R. G. 1985, ApJ, 299, 1067
- Fortney et al. (2006) Fortney, J. J., Saumon, D., Marley, M. S., Lodders, K. & Freedman, R. S. 2006, ApJ, in press.
- Freedman & Lodders (2006) Freedman, R. S. & Lodders, K. 2006, in prep.
- Geballe et al. (2001) Geballe, T. R., Saumon, D., Leggett, S. K., Knapp, G. R., Marley, M. S. & Lodders, K. 2001, ApJ, 556, 373
- Golimowski et al. (1998) Golimowski, D. A., Burrows, C. J., Kulkarni, S. R., Oppenheimer, B. R. & Brukardt, R. A. 1998, AJ, 115, 2579
- Golimowski et al. (2004) Golimowski, D. A., Leggett, S. K., Marley, M. S., Fan, X., Geballe, T. R., Knapp, G. R., Vrba, F. J., Henden, A. A. et al., 2004, AJ, 127, 3516
- Griffith & Yelle (1999) Griffith, C. A. & Yelle, R. V. 1999, ApJ, 519, L85
- Husson et al. (1992) Husson, N., Bonnet, B., Scott, N. A., & Gredin, A. 1992, J. Quant. Spec. Radiat. Transf., 48, 509
- Leggett et al. (2002) Leggett, S. K., Golimowski, D. A., Fan, X., Geballe, T. R., Knapp, G. R., Brinkmann, J., Csabai, I., Gunn, J. et al. 2002, ApJ, 564, 452
- Lewis & Prinn (1980) Lewis, J. S. & Prinn, R. G. 1980, ApJ, 238, 357
- Lodders (2003) Lodders, K. 2003, ApJ, 591, 1220
- Lodders & Fegley (1994) Lodders, K. & Fegley, B. Jr. 1994, Icarus, 112, 368
- Lodders & Fegley (2002) Lodders, K. & Fegley, B. Jr. 2002, Icarus, 155, 393
- Lodders & Fegley (2006) Lodders, K. & Fegley, B. Jr. 2006, Astrophysics Update 2 (New York: Praxis Springer), 1
- Marley et al. (1996) Marley, M. S., Saumon, D., Guillot, T., Freedman, R. S., Hubbard, W. B., Burrows, A., & Lunine, J. I. 1996, Science, 272, 1919
- Noll et al. (1997) Noll, K. S., Geballe, T. R. & Marley, M. S. 1997, ApJ, 489, L87
- Perryman et al. (1997) Perryman, M. A. C., et al. 1997, A&A, 323, L49
- Roellig et al. (2004) Roellig, T. L., Van Cleve, J. E., Sloan, G. C., Wilson, J. C., Saumon, D., Leggett, S. K., Marley, M. S.,Cushing, M. C., et al, 2004, ApJS, 154, 418
- Rothman et al. (2004) Rothman, L. S. et al. 2005, J. Quant. Spec. Radiat. Transf., 96, 139
- Santos et al. (2005) Santos, N. C., Israelian, G., Mayor, M. Bento, J. P., Almeida, P. C., Sousa, S. G. & Ecuvillon, A. 2005, A&A, 437, 1127
- Saumon et al. (2005) Saumon, D., Chabrier, G. & Van Horn, H. M. 1995, ApJS, 99, 713
- Saumon et al. (2000) Saumon, D., Geballe, T. R., Leggett, S. K., Marley, M.S., Freedman, R. S., Lodders, K., Fegley, B., Jr. & Sengupta, S. K. 2000, ApJ, 541, 374
- Saumon et al. (2003) Saumon, D., Marley, M. S. , Lodders, K. & Freedman, R. S. 2003, in Brown Dwarfs, IAU Symp. 211,E.L. Martín, Ed., (ASP: San Francisco), 335
- Smith (1998) Smith, M. D. 1998, Icarus, 132, 176
- Stephens & Leggett (2004) Stephens, D. C. & Leggett, S. K. 2004, PASP, 116, 9
- Thorén & Feltzing (2000) Thorén, P. & Feltzing, S. 2000, A&A, 363, 692
- Tsuji (1964) Tsuji, 1964, Annals of the Tokyo Astronomical Observatory, 9,1
- Valenti & Fisher (2005) Valenti, J. A. & Fisher, D. A. 2005, ApJS, 159, 141
- Visscher & Fegley (2005) Visscher, C., & Fegley, B. Jr. 2005, ApJ, 623, 1221
- Yung et al. (1988) Yung, Y. L., Drew, W. A., Pinto, J. P. & Friel, R. R. 1988, Icarus, 73, 516
| Model | Mass | Radius | Age | |||
|---|---|---|---|---|---|---|
| (K) | (cm/s2) | (Gyr) | ||||
| A | 782 | 4.95 | 31 | 0.0950 | 2.0 | |
| B | 800 | 5.09 | 38 | 0.0901 | 3.2 | |
| C | 821 | 5.23 | 47 | 0.0853 | 5.0 |