Optical Counterparts of Ultra-Luminous X-ray Sources identified from Archival Hubble Space Telescope/WFPC2 Images11affiliation: Based on observations made with the NASA/ESA Hubble Space Telescope, obtained from the Data Archive at the Space Telescope Science Institute, which is operated by the Association of Universities for Research in Astronomy, Inc., under NASA contract NAS 5-26555. This project is associated with Archival proposal #9545.
Abstract
We present a systematic analysis of archival HST WFPC2 “Association” data sets that correlate with the Chandra positions of a set of 44 ultra-luminous X-ray sources (ULXs) of nearby galaxies. The main motivation is to address the nature of ULXs by searching for optical counterparts. Sixteen of the ULXs are found in early-type galaxies (RC3 Hubble type 3). We have improved the Chandra-HST relative astrometry whenever possible, resulting in errors circles of 0.3-1.7” in size. Disparate numbers of potential ULX counterparts are found, and in some cases none are found. The lack of or low number of counterparts in some cases may be due to insufficient depth in the WFPC2 images. Particularly in late-type galaxies, the HST image in the ULX region was often complex or crowded, requiring source detection to be performed manually. We therefore address various scenarios for the nature of the ULX since it is not known which, if any, of the sources found are true counterparts. The optical luminosities of the sources are typically in the range , with (effective) V magnitudes typically in the range 22-24. In several cases color information is available, with the colors roughly tending to be more red in early-type galaxies. This suggests that, in general, the (potential) counterparts found in early-type galaxies are likely to be older stellar populations, and are probably globular clusters. Several early-type galaxy counterparts have blue colors, which may be due to younger stellar populations in the host galaxies, however these could also be background sources. In spiral galaxies the sources may also be due to localized structure in the disks rather than bound stellar systems. Alternatively some of the counterparts in late-type galaxies may be isolated supergiant stars. The observed X-ray/optical flux ratio is diluted by the optical emission of the cluster in cases where the system is an X-ray binary in a cluster, particularly in the case of a low-mass X-ray binaries in old cluster. If any of the counterparts are bound systems with stars and are the true counterparts to the ULX sources, then the X-ray luminosities of the ULX are generally well below the Eddington limit for a black hole with mass of the cluster mass. Finally, we find that the optical flux of the counterparts is consistent with being dominated by emission from an accretion disk around an intermediate-mass black hole if the black hole happens to have a mass and is accreting at close to the Eddington rate, unless the accretion disk is irradiated (which would result in high optical disk luminosities at lower black hole masses).
Subject headings:
catalogs — X-rays: binaries — X-rays: galaxies1. Introduction
In the early 1980s, surveys of normal galaxies with the Einstein X-ray satellite revealed intermediate-luminosity (LX 10391040 erg s-1) X-ray sources which were seemingly located in the centers of spiral galaxies (Fabbiano 1989). This was very interesting, since Seyfert nuclei (active galactic nuclei [AGNs] in nearby spirals) are typically much more luminous (LX 10421044 erg s-1) and black hole X-ray binaries (BH XRBs) are much less luminous (typically LX 1038 erg s-1). It was not clear whether these intriguing sources were underluminous accreting supermassive BHs, overluminous XRBs located near the galactic nucleus, or an entirely new type of astrophysical object altogether (e.g., Colbert et al. 1995). In the 1990s, ROSAT High Resolution Imager (HRI) observations showed that these Ultraluminous X-ray objects (ULXs; also known as Intermediate-luminosity X-ray Objects, or IXOs) are compact X-ray sources, and are quite common in the local Universe (Colbert & Mushotzky 1999; Roberts & Warwick 2000). Many ULXs were found to be offset from the optical nucleus (e.g., Colbert & Mushotzky 1999). More complete surveys from ROSAT (e.g., Roberts & Warwick 2000; Colbert & Ptak 2002) and Chandra imaging data place their frequency of occurrence at about one in every five galaxies (Ptak & Colbert 2004). Most of the ULXs found in these surveys are clearly significantly displaced from the galactic nuclei, implying that their masses must be 105 M⊙ since dynamical friction would otherwise cause them to sink to the center of the galaxy in a Hubble time (Tremaine, Ostriker & Spitzer 1975).
ULXs are generally unresolved at the high spatial resolution () of Chandra, and many show variability (Colbert & Ptak 2002; Fabbiano et al. 2003), which rules out the hypothesis that ULXs are closely-spaced aggregates of lower-luminosity X-ray sources. Bondi accretion from a dense ISM may not be sufficient to explain the observed luminosities (King et al. 2001), although an intermediate mass black hole () in a dense molecular cloud may achieve luminosities in excess of (Krolik 2004) . They are therefore most likely powered by accretion in binary systems. This is supported by evidence for periodicity in a few individual objects (Sugiho et al. 2001; Liu et al. 2002b). If one assumes that ULXs have LX below the Eddington luminosity and are not beamed, then the mass of the central object is required to be in the range . This is too massive to be a neutron star or a black hole formed through normal stellar evolution, thus we would have to be dealing with intermediate-mass black holes (IMBHs). This interpretation is quite fascinating, as reviewed by van der Marel (2004) and Miller & Colbert (2004). For some individual ULXs it has been argued that the presence of an IMBH is plausible (Portegies Zwart et al. 2004), but in general it poses many challenges from a theoretical point of view (see King et al. 2001; King 2002). Alternatively, ULXs may instead be stellar-mass black hole systems that are emitting anisotropically with either mild (King et al. 2001) or relativistic beaming (Körding, Falcke & Markoff 2002), or are actually emitting at super-Eddington rates (Begelman 2002; Grimm, Gilfanov & Sunyaev 2002). For example, the galactic microquasar GRS 1915 has a known black hole mass of and is often observed with X-ray luminosities exceeding , qualifying it as an ULX. In this case the high luminosity is due to both relativistic beaming and super-Eddington emission (King 2002; Mirabel & Rodriguez 1999).
Phenomenologically there appear to be several breeds of ULXs. They may be preferentially found in star-forming galaxies (Kilgard et al. 2002; Grimm et al. 2003), with starburst galaxies such as the Antennae (Zezas et al. 2002; Zezas & Fabbiano 2002) and the Cartwheel (Gao et al. 2003) having large numbers of ULXs. This suggests an association between the incidence of ULXs and star formation (although Ptak & Colbert [2004] have found that this is not necessarily the case in general). Indeed, optical counterparts reported for ULXs suggest a young star cluster in one case (Goad et al. 2002) and a single O-star in another case (Liu, Bregman & Seitzer 2002a). Terashima, Inoue, & Wilson (2006) discuss a study of optical counterparts to ULXs in M51 and varyingly find no, one or several candidate counterparts. The colors and absolute magnitudes of counterparts in several cases (where there were only one or two counterparts) were consistent with stars of mass 7-9 and 10-15 , implying that these ULXs may be high-mass X-ray binaries. A radio counterpart was found for a ULX in the dwarf galaxy NGC 5408 (Kaaret et al. 2003), with two possible HST counterparts in the X-ray error circle. The brighter of these counterparts has , consistent with a supergiant O star.
ULXs have also been found in elliptical galaxies and galactic bulges (Colbert & Ptak 2002; Angelini et al. 2001; Wu et al. 2002; Jeltema et al. 2003). This suggests that some ULXs are associated with old systems such as globular clusters. However, ULXs with found in ellipticals are often not associated with globular clusters and are observed in numbers consistent with the expected number of background sources (Irwin et al. 2004). A study of optical counterparts to four ULXs by Gutierrez (2006) found that three are background AGN and one is likely to be foreground star. Three of these ULXs were found in early-type galaxies, again showing a tendency for ULXs associated with early-type galaxies to be background AGN.
X-ray spectroscopy can give clues about accretion disks and coronae that may be present in ULXs (Colbert & Mushotzky 1999; Makishima et al. 2000; Roberts et al. 2001; Strickland et al. 2001; Zezas et al. 2002; Foschini et al. 2002; Miller et al. 2003). However, there are important questions about the nature of ULXs that can only be answered using the multi-wavelength properties of as large a sample of ULXs as possible. In the Antennae, ULXs are often observed close to star clusters, but not coincident with them. This may suggest a scenario in which ULXs are X-ray binaries that can be ejected out of clusters through recoil (Portegies Zwart & McMillan 2000). If this is generally true then it would preclude an IMBH because the mass would be too large for the binary to be ejected (Miller & Hamilton 2002). In cases where individual counterparts are not detected learning about the environment of the ULXs can also be instructive. For example, it has been suggested that ULXs in late-type galaxies are preferentially found in or near HII regions (Pakull & Mirioni 2002).
We have established a pipeline to continuously analyze Chandra data from galaxies as it becomes publicly available, with emphasis on producing a catalog of ULXs. The present paper presents a study of archival Hubble Space Telescope (HST) images obtained with the Second Wide Field and Planetary Camera (WFPC2) of fields that contain ULXs in our Chandra catalog. The goal is to search for optical counterparts to the ULXs, and to characterize their environment. While a few individual optical ULX counterparts have been reported by other groups, the present work represents the first large-scale Chandra/HST ULX cross-comparison and cataloging effort. The use of HST data is critical, given that ground-based observations do not have the spatial resolution to resolve individual stars (unless the star is unusually isolated) and often cannot reach the apparent magnitudes of even supergiant stars except for the nearest galaxies. The results provide much improved statistics with fewer biases than previous work, as well as a catalog of sources for use in follow-up studies.
The paper is structured as follows. Section 2 discusses the sample selection and the Chandra and HST data that we have used for the study. Section 3 discusses the astrometric registration of the Chandra and HST data. Section 5 discusses the results from photometric analysis on the potential counterparts that were located. Section 6 discusses the main results of the study, and the implications for our understanding of ULXs. Section 7 summarizes the main conclusions.
2. Sample Selection
2.1. Catalog of Chandra ULXs
We searched for Chandra X-ray sources within the R25 radius of all galaxies in the Third Reference Catalog of Bright Galaxies (RC3; de Vaucouleurs et al. 1991) with recessional velocities 5000 km s-1. Here R25 is the 25 mag arcsec-2 isophotal diameter, as listed in RC3. An X-ray point source database was created with the XAssist (Ptak & Griffith 2003) Chandra ACIS pipeline, using all public ACIS data as of 17 July 2002. ULXs were selected by requiring a 210 keV X-ray luminosity L 1039.0 erg s-1, assuming an absorbed power-law model with Galactic absorption (Dickey & Lockman 1990) and photon index 1.7. For galaxies with RC3 recessional velocities 1000 km s-1, distances were taken from Tully (1988), if available, otherwise from Kraan-Kortewag & Tamman (1979). Distances to galaxies with 1000 km s-1 were computed using H 75 km s-1 Mpc-1 (for consistency with Tully 1988). H I line velocities from RC3 were used when available, otherwise “optical” RC3 velocities were used.
The preliminary source list thus obtained was tapered by merging duplicate sources and examining the individual X-ray images to verify that the source was not an X-ray instrumental artifact and that it was indeed point-like. We next cross-correlated the X-ray positions with known sources listed in the NASA Extragalactic Database (NED) to identify known AGNs, galaxy nuclei, and X-ray supernovae. Any objects thus identified were omitted, and questionable objects were flagged as such. The remaining list contained 125 ULXs, which were used as a starting point for searching the HST WFPC2 archive using the selection criteria discussed in Section 2.2. For those ULXs with WFPC2 data that passed our search criteria, we performed an astrometric registration as described in Section 3. With more accurate absolute positions available, we reexamined all of the questionable objects by checking their X-ray position with respect to the galaxy nucleus in the WFPC2 images, and by rejecting sources when spatially coincident with known AGNs or SNe. This ultimately yielded 44 ULXs in 25 different galaxies, that make up our sample for this paper. Table 1 lists the basic properties of the sample.
| ULX | RA | DEC | Galaxy | T-type | Dist. | Chandra | LX |
|---|---|---|---|---|---|---|---|
| ID | (J2000) | (RC3) | (Mpc) | ObsID | (1039 erg s-1) | ||
| (1) | (2) | (3) | (4) | (5) | (6) | (7) | (8) |
| 1 | 0:52:02.72 | 47:33:07.7 | NGC 278 | 3.0 | 11.8 | 2056 | 2.0 |
| 2 | 2:22:31.36 | 42:20:24.4 | NGC 891 | 3.0 | 9.6 | 794 | 1.8 |
| 3 | 2:42:38.89 | -00:00:55.1 | NGC 1068 | 3.0 | 15.2 | 344 | 2.9 |
| 4 | 2:42:39.71 | -00:01:01.4 | NGC 1068 | 3.0 | 15.2 | 344 | 1.0 |
| 5 | 2:46:19.82 | -30:16:02.6 | NGC 1097 | 3.0 | 17.0 | 1611 | 2.9 |
| 2339 | 2.8 | ||||||
| 6 | 3:38:27.64 | -35:26:48.2 | NGC 1399 | -5.0 | 19.3 | 319 | 1.0 |
| 7 | 3:38:31.81 | -35:26:03.8 | NGC 1399 | -5.0 | 19.3 | 319 | 1.3 |
| 8 | 3:38:32.60 | -35:27:05.1 | NGC 1399 | -5.0 | 19.3 | 319 | 1.6 |
| 9 | 4:56:52.21 | -4:52:17.9 | NGC 1700 | -5.0 | 52.2 | 2069 | 2.3 |
| 10 | 4:56:56.03 | -4:51:59.5 | NGC 1700 | -5.0 | 52.2 | 2069 | 3.0 |
| 11 | 4:57:01.82 | -4:51:15.9 | NGC 1700 | -5.0 | 52.2 | 2069 | 6.4 |
| 12 | 9:55:46.44 | 69:40:40.5 | NGC 3034 | 90.0 | 5.2 | 379 | 1.0 |
| 13 | 9:55:50.01 | 69:40:46.0 | NGC 3034 | 90.0 | 5.2 | 361 | 2.1 |
| 1302 | 2.2 | ||||||
| 378 | 6.9 | ||||||
| 379 | 9.0 | ||||||
| 14 | 9:55:50.91 | 69:40:46.6 | NGC 3034 | 90.0 | 5.2 | 378 | 2.8 |
| 15 | 10:27:52.54 | -43:53:50.2 | NGC 3256 | 99.0 | 37.1 | 835 | 1.3 |
| 16 | 10:27:55.15 | -43:54:47.2 | NGC 3256 | 99.0 | 37.1 | 835 | 2.3 |
| 17 | 10:36:42.66 | -27:31:40.8 | NGC 3311 | -4.0 | 50.5 | 2220 | 4.5 |
| 18 | 10:36:42.75 | -27:31:43.5 | NGC 3311 | -4.0 | 50.5 | 2220 | 9.2 |
| 19 | 11:20:15.76 | 13:35:13.7 | NGC 3628 | 3.0 | 7.7 | 2039 | 1.2 |
| 395 | 2.3 | ||||||
| 20 | 11:20:20.90 | 12:58:46.0 | NGC 3627 | 3.0 | 6.6 | 394 | 1.2 |
| 21 | 12:01:51.32 | -18:52:25.4 | NGC 4038/9 | 9.0 | 21.7 | 315 | 2.0 |
| 22 | 12:01:52.08 | -18:51:33.6 | NGC 4038 | 9.0 | 21.7 | 315 | 5.5 |
| 23 | 12:01:54.27 | -18:52:01.9 | NGC 4038/9 | 9.0 | 21.7 | 315 | 1.0 |
| 24 | 12:01:54.35 | -18:52:10.3 | NGC 4039 | 9.0 | 22.1 | 315 | 1.0 |
| 25 | 12:01:54.97 | -18:53:15.1 | NGC 4038/9 | 9.0 | 21.7 | 315 | 2.8 |
| 26 | 12:01:55.65 | -18:52:15.1 | NGC 4038/9 | 9.0 | 21.7 | 315 | 3.8 |
| 27 | 12:01:56.43 | -18:51:57.9 | NGC 4038/9 | 9.0 | 21.7 | 315 | 3.6 |
| 28 | 12:01:58.22 | -18:52:04.5 | NGC 4038/9 | 9.0 | 21.7 | 315 | 1.0 |
| 29 | 12:10:33.77 | 30:23:57.9 | NGC 4150 | -2.0 | 9.7 | 1638 | 1.1 |
| 30 | 12:30:43.26 | 41:38:18.4 | NGC 4490 | 7.0 | 7.8 | 1579 | 1.1 |
| 31 | 12:35:58.56 | 27:57:41.9 | NGC 4559 | 6.0 | 9.7 | 2026 | 2.2 |
| 2027 | 4.2 | ||||||
| 32 | 12:36:17.40 | 25:58:55.5 | NGC 4565 | 3.0 | 16.4 | 404 | 9.8 |
| 33 | 12:40:00.35 | -11:37:24.0 | NGC 4594 | 1.0 | 14.5 | 407 | 1.4 |
| 34 | 12:50:25.68 | 25:31:29.2 | NGC 4725 | 2.0 | 16.1 | 409 | 1.6 |
| 35 | 13:05:21.94 | -49:28:26.6 | NGC 4945 | 6.0 | 5.2 | 864 | 1.0 |
| 36 | 13:12:55.59 | -19:30:39.7 | NGC 5018 | -5.0 | 37.3 | 2070 | 5.3 |
| 37 | 13:13:02.03 | -19:31:05.5 | NGC 5018 | -5.0 | 37.3 | 2070 | 2.5 |
| 38 | 13:13:29.66 | 36:35:23.1 | NGC 5033 | 5.0 | 18.7 | 412 | 2.2 |
| 39 | 13:13:29.46 | 36:35:17.4 | NGC 5033 | 5.0 | 18.7 | 412 | 1.5 |
| 40 | 13:25:19.84 | -43:03:17.2 | NGC 5128 | -2.0 | 4.9 | 316 | 1.0 |
| 41 | 14:13:10.03 | -65:20:45.1 | Circinus | 3.0 | 3.7 | 355 | 1.6 |
| 42 | 14:13:12.24 | -65:20:14.0 | Circinus | 3.0 | 3.7 | 356 | 1.8 |
| 365 | 4.9 | ||||||
| 43 | 17:56:01.59 | 18:20:22.6 | NGC 6500 | 1.7 | 40.0 | 416 | 2.5 |
| 44 | 22:02:07.92 | -31:59:19.7 | NGC 7174 | 1.8 | 37.0 | 905 | 1.5 |
Note. — The table lists basic properties for the ULXs in our sample, selected as described in Section 2.1. Column (1) lists the running ID number of the ULX used throughout this paper. Columns (2) and (3) list the X-ray source position from the Chandra ACIS data. Column (4) lists the host galaxy name, and column (5) lists the galaxy morphology T-type from the Third Reference Catalog of Bright Galaxies (RC3, de Vaucouleurs et al. 1991). Column (6) lists the galaxy distance, obtained as described in Section 2.1. Column (7) lists the Chandra ACIS Observation ID. Column (8) lists the observed X-ray luminosity in the 2–10 keV band, estimated as described in Section 2.1.
2.2. Selection of HST/WFPC2 Data
For the HST parts of our project we chose to work with WFPC2 associations, instead of individual WFPC2 images. Associations are logically related sets of individual WFPC2 images (e.g. the same field, filter, and orientation) with accompanying information on positional offsets between the images. The vast majority of WFPC2 science data (93%) has been made into associations (Micol & Durand 2002). The WFPC2 Associations Science Products Pipeline111WASPP was developed by the Canadian Astronomy Data Centre (CADC) in conjunction with the Space Telescope European Coordinating Facility (ST-ECF) and the Multimission Archive at STScI (MAST). (WASPP) produces data products from the images in an association. To this end it starts by applying the regular WFPC2 pipeline calibration steps (bias subtraction, dark subtraction, flat-fielding, etc.) to the individual images of the association. The reduced images are then registered and co-added with cosmic-ray rejection. If reference stars from the USNO-A2.0 Catalog (Monet et al. 1998) are present in the field, then these are identified by an automated algorithm and the final combined image is registered to their reference frame. For the present project we used the data made available in the first release (November 6, 2002) of the WASPP association data. This release contained data products for 66% of all WFPC2 associations.
We searched the STScI HST Data Archive for WFPC2 images with pointings that might include the ULXs that were identified with Chandra (Section 2.1). Each WFPC2 field was then visually inspected to ensure that the ULX position fell on one of the WFPC2 chips. Fields in which the ULX position was located off the edge of the WFPC2 detectors were eliminated. Of these images, 90% was part of an association. Each association typically contains 2–8 images. Of these associations, 74% had been processed by the WASPP at the time of the first data release. This implies that two-thirds of all the images that we could have used for the present study were part of the first WASPP release. Since manual registration and co-addition of the remaining one-third would have been a substantial effort while providing only a modest increases in overall sample size, we decided to ignore these data for the present study. The final WFPC2 data sample thus obtained consists of 76 WFPC2 images that include the 44 ULXs in our Chandra catalog. Each WFPC2 image is a fully calibrated association data product. For a detailed description of the WASPP data reduction steps we refer the reader to Schade et al. (2002). The WFPC2 association products used in our study are listed in Table 2, together with basic properties such as the filter used and the total exposure time. For some of our ULXs we have images in multiple filters, or even multiple images in the same filter (the WASPP pipeline does not combine images taken at different epochs and telescope orientation, even when taken with the same filter).
3. Astrometric Registration
It is important for our study that the HST and Chandra data are astrometrically aligned as well as possible. The absolute astrometric accuracy of WFPC2 data is dominated by two components. The first is the RMS astrometric accuracy of the Guide Star Catalog, which is used for pointing and guiding. The second is the accuracy with which the relative positions of the WFPC2 and the Fine Guidance Sensors in the focal plane are known. The latter effect dominates the overall error budget, although its actual size has varied over the WFPC2 lifetime (Brammer et al. 2002). By comparing the positions of USNO-A2.0 stars in large numbers of WFPC2 images to their known astrometric coordinates, Schade et al. (2002) found an overall RMS astrometric accuracy for WFPC2 data of . By contrast, Chandra has nominal 90% and 99% confidence astrometric accuracies of and (Aldcroft 2002).
The WASPP association products have the advantage that they have significantly enhanced astrometric accuracy as compared to the nominal WFPC2 accuracy. The WASPP pipeline identifies all stars in the USNO-A2.0 Catalog that might be on the image, and searches for correspondence between the catalog and observed bright sources. The results are used to improve the astrometry of the association data products. In principle the final astrometric accuracy could be as good as that of the USNO-A2.0 Catalog, which has a nominal RMS accuracy of . In practice, however, there are several caveats to this. First, the USNO-A2.0 Catalog has epochs in the 1950s, and accumulated proper motions bring the current RMS accuracy into the range – (Schade et al. 2002). Second, not all fields have (identifiable) USNO-A2.0 stars, and for these fields the association data products have the same RMS astrometric accuracy as regular pipeline-calibrated WFPC2 data. And third, the nearby galaxies of interest for the present study generally fill the field of view and have complicated morphology. In this case the automated source detection software in WASPP may identify the wrong source with a USNO-A2.0 star, and thereby significantly degrade the astrometry of the image. In our sample we found several cases for which this appeared to have happened. Many galaxy nuclei are themselves contained in the USNO-A2.0 Catalog, and due to their complicated nuclear morphologies these are particularly tricky to use in any astrometric registration.
Because of these partial shortcomings of the WASPP astrometric registration algorithm, we did not use its results. Instead, we visually identified stars from the USNO-B1.0 Catalog (Monet et al. 2003) in the association data products, and used them to improve the astrometry. While USNO-A was a two-color, one-epoch catalog, USNO-B instead is a three-color, two-epoch catalog. The main advantage in the present context is that proper motions are included in the catalog, and can hence be corrected for. The nominal RMS accuracy of the catalog is . Note that mosaics produced using the STSDAS task wmosaic were used, which removes known relative rotations and geometric distortions of the individual WPFC2 chips. The relative astrometry between WFPC2 positions should then be good to better than 0.1” 222see http://www.stsci.edu/instruments/wfpc2/Wfpc2_faq/wfpc2_ast_faq.html. The advantage of our visual identification of the stars is that it avoids the potential errors that an automated algorithm could make. This approach allowed us to correct the astrometry of 34 of our 76 images. For the remaining 30 images there were no usable USNO-B1.0 stars in the field (and in general, the WASPP pipeline had not identified any USNO-A2.0 stars either). In these cases we left the astrometry as contained in the header of the original (pre-association) lead image which came out of the STScI on-the-fly-recalibration (OTFR) pipeline.
For the purpose of the present study we are not really interested in the absolute astrometry of either the Chandra or the WFPC2 data itself, but rather in the relative astrometric accuracy between the two. It is possible to increase this accuracy in those cases where the WFPC2 field contains a known X-ray source that also emits at optical wavelengths (other than the ULX itself). This is the case if the galaxy nucleus is a point-like AGN, and if the nucleus is not obscured by dust in the WFPC2 image. We found this to be the case in 27 of the images, corresponding to half of all the galaxies in the sample. This high fraction reflects the fact that the Chandra and/or HST observers tend to bias their observations towards active galaxies.
With the aforementioned approaches we obtained three types of WFPC2 header coordinates: Method 1 coordinates (available for 27 images) were shifted to align the galaxy nucleus with the AGN coordinates in Chandra data; Method 2 coordinates (available for 46 images) were shifted to align observed USNO-B1.0 stars with their catalog coordinates; and Method 3 coordinates (available for all 76 images) contain the original astrometry from the telescope. These methods are listed in order of decreasing accuracy. For our final analysis, we adopt for each image the coordinates from the lowest method number available, as listed in Table 2. Out of 76 images total, 27 images have coordinates from method 1, 34 images have coordinates from method 2, and 15 images have coordinates from method 3. Table 2 also lists for each image the final pixel position of each ULX. Together with the RA and DEC values of the ULXs listed in Table 1 this uniquely defines the astrometry of each image. Note that our overall approach focuses on relative astrometry and not absolute astrometry. In particular, when we register WFPC2 data to the Chandra frame in method 1 we improve the relative astrometry, but not necessarily the absolute astrometry.
The relative accuracy of the coordinates from the different methods can be analyzed with some simple statistics. Let be the RMS (two-dimensional) distance between the coordinates from methods and , for those images that have coordinates available from both methods. We find for our sample: , and . We can safely assume that method 1 yields much better relative Chandra/HST alignment than method 2. This implies that is a measure of the relative RMS Chandra/HST alignment for those images for which the best coordinates are available from method 2. Similarly, is a measure of the relative RMS Chandra/HST alignment for those images for which the the best coordinates are available from method 3. In the following we use and to set the size of the error circles in our search for ULX counterparts. For method 1 the relative RMS Chandra/HST alignment is more difficult to assess, because it is dominated by the accuracy and stability of the geometric distortion solutions for the two instruments. For WFPC2 the relative positions of the chips have shifted by since launch (Anderson & King 2003). Furthermore, this alignment depends on the accuracy to which a centroid of a source can be determined in both the X-ray and the optical data. The complexity of the morphology can affect this determination. In the following we conservatively, and somewhat arbitrarily, assume a RMS Chandra/HST alignment accuracy of for method 1.
We note that our results are more-or-less consistent with expectation. For example, if the absolute RMS accuracy of USNO-B1.0 registered coordinates is , the absolute RMS accuracy of Chandra pipeline coordinates is , and the absolute accuracy of WFPC2 pipeline coordinates is , then we would have expected that , and . This is in statistically acceptable agreement with our sample statistics. Absolute accuracies of for USNO-B1.0 registered coordinates and for Chandra pipeline coordinates are slightly larger than the nominally expected values. However, it is not unreasonable to expect that a variety of small systematic errors could increase the achieved accuracies so as to exceed the nominal values.
4. Images
Figure 1 shows large scale views of each of the galaxies and ULXs in our sample. These images are intended to illustrate the overall morphologies of the sample galaxies and the relative locations of the ULXs with respect to the galaxy nucleus. We therefore show only data for a single filter per galaxy. When images in multiple filters were available we preferentially chose to show a broad- or medium-band filter in the red or visual part of the spectrum, such as F814W, F791W, F606W, F555W, or F547M (see Biretta et al. (2001) for a discussion of the properties of WFPC2 filters). However, there are some exceptions to this. For NGC 1097, NGC 5033, and NGC 7174 there is only data in the ultra-violet (F218W, F300W) part of the spectrum. For the Antennae, one of its ULXs (#25) is included only in a U-band (F336W) image. For NGC 4594 only a narrow-band filter image is available (F658N). For Circinus, one of its ULXs (#41) is included only in a narrow-band image (F656N).
The greyscale panels in Figure 2 show arcsecond regions centered around the individual ULXs in the sample. A circle around each ULX indicates the 1 accuracy of the astrometric registration, i.e., for images aligned by method 1, for images aligned by method 2, or for images aligned by method 3. These images show the general galaxy morphology around each ULX. They form the basis for the search for optical counterparts described in Section 5. Figure 2 shows each ULX, but not each dataset for each ULX. For conciseness we generally only show the highest quality image for each ULX. In most cases the morphology is visually very similar in the different filters for which data are available. However, in some cases the images in different filters do show different morphologies, and for these ULXs we show images of the same region in multiple filters in Figure 2.
The CADC WASPP pipeline performs a full reduction and image combination for the datasets in each association. We therefore did not attempt any additional reduction or calibration of the images. However, we did discover occasional peculiarities in the combined images from the CADC WASPP pipeline. In particular, some of the images show evidence of improperly removed cosmic rays. Most of these are cases in which only two exposures are available, and for which the data may simply having been inadequate to fully remove all cosmic rays and their coincidences. Examples of galaxies for which some datasets appear to have residual cosmic rays are those of, NGC 4594, NGC 5018, and NGC 5033. All counterparts were visually inspected to screen questionable cases.
Another peculiarity in some of the images is a sprinkling of negative pixels that seems inconsistent with the regular tail of the noise distribution. We learned (CADC, priv. comm.) that these are generally the result of combining two or more images with significantly different exposure times. We made sure that these pixels generally do not affect our photometry of potential counterparts (unless in a few rare cases, which we explicitly identify as such below). Figure 2 also shows some peculiarities that are intrinsic to the data and the WFPC2 instrument. Most notably, the diagonal bright stripes visible in the images for ULXs 3, 4, and 31 are chip boundaries in the mosaiced data.
5. Photometry
We searched all the images for potential ULX optical counterparts. In doing so we restricted our attention to a search radius in the optical images that is twice the astrometric registration error for each ULX. All the ULXs in our sample reside in nearby galaxies, and many of these galaxies are spiral galaxies. Such galaxies can have complicated morphologies, and we therefore commonly found diffuse structures of various kinds (e.g., parts of spiral arms, dust bands, etc.) within the search radius around a ULX. Such structures may be interesting if a connection to the ULX phenomenon could be demonstrated. However, we decided not to catalog such structures in the present context. Instead, we decided to restrict our attention to sources within the search radius that appear point-like, i.e., sources that are either consistent with the HST point spread function (PSF) or which are only slightly more extended. Such sources tend to be associated with star clusters, diffuse regions, or individual stars. All of these can provide essential insight into the ULX phenomenon if a direct association with a particular ULX could be demonstrated.
Our method for the identification of point-like sources depended on the galaxy morphology around the ULX. Based on visual inspection we discriminated between several different classes of morphologies within the search radius. We classify as simple morphologies those cases in which there are one or more easily identifiable, point-like sources on a relatively smooth or constant background. For these morphologies we used the standard source detection routine daofind in the IRAF software package to find point-like sources. We utilized 4 as the detection threshold. We will refer to datasets in this category as case S (S for “simple”). Other ULXs are found in regions of more complicated morphology. These show diffuse, extended or dusty structures. In these cases we found that automated routines for source detection did not provide reliable results. Nonetheless, in some fraction of cases with these complicated morphologies it was possible to manually identify point-like sources. We will refer to these as case M (M for “manual”). We emphasize the point that the source detection in these cases is nevertheless somewhat arbitrary, particularly with regard to whether faint sources are considered to be real or artifacts. For the remainder of the complicated morphologies it was not possible to place any reliable limits on the presence or absence of point-like sources. We do not report any results for these cases, which we will refer to as case C (C for “complex”). This primarily occurred in the cases of two galaxies, NGC 1068 and NGC 3034 (M82). In the case of NGC 1068, while it appears that in some fields manual source detection would be possible, taken as a whole the combination of large numbers of sources within the 2 error circle (3.3” in radius) and complex spatial morphology would complicate the interpretation. We therefore defer detailed analysis in this case for future work when better astrometry may be available (e.g., by tying the astrometry of WFPC2 images to ground-based images). We also classified a source as “C” due to it being on the edge of the chip (a possible counterpart to ULX 24 in the u3040205b observation).
Another category is formed by those ULXs for which the optical morphology within the search radius is smooth and straightforward, but in which there is no sign of detectable point-like sources. We will refer to these as case N (N for “nothing”). A final category is formed by those ULXs for which the optical data was unreliable due to a high fraction of unrealistically negative pixels within the search radius. This problem of the data calibration was discussed in Section 4. It only affected a few datasets so significantly that we felt that a quantitative analysis would not be warranted. These datasets are referred to as case X (X for “excluded”). For each ULX and dataset we indicate in column (5) of Table 3 to what case it belongs. Of the 145 unique dataset, ULX, and photometric case combinations, 20 (14%) represent case S, 35 (24%) represent case M, 37 (26%) represent case C, 44 (30%) represent case N and 9 (6%) represent case X.
For 9 ULXs we have one or more datasets of case S, and for 20 ULXs we have one or more datasets of case M. These are the cases for which one or more point-like sources were either automatically or visually identified within the search region around the ULX. In total, we found potential counterparts for 28 of the 44 ULXs in our sample ( there is overlap between S and M cases for ULX 40). We assigned each of the sources thus identified a unique ID number. The sources are labeled and shown schematically in separate panels of Figure 2. Information on the sources is provided in Table 3. Columns (7) and (8) give the offset of each source w.r.t. ULX position (in RA and Dec.). Column (9) gives the corresponding total offset. For each source we performed aperture photometry using the routine phot in the IRAF software package. The photometry on the source was performed with an aperture of radius 0.1” (this is 1 pixel on the Wide Field Camera CCDs and approximately 2 pixels on the Planetary Camera CCD). An appropriate background value was subtracted from the results. For case S, the local background was automatically measured in an annulus surrounding the point source. For case M, the background was kept fixed at the value determined manually from a representative (but carefully chosen) region near the ULX.
The measured count rates in apertures were converted to magnitudes using the zeropoints for each filter given in the WFPC2 Data Handbook (Mobasher et al. 2002). The resulting magnitudes are in the so-called VEGAMAG system. This is a synthetic system in which the magnitude of the star Vega is defined to be exactly zero in all filters. In the traditional Johnson-Cousins system the magnitude of Vega is approximately zero in the UBVRI bands, but not exactly (Bessel, Castelli, & Plez 1998). In general, magnitudes on the VEGAMAG system are close to those on the Johnson-Cousins system, provided the filters have similar central wavelengths. However, to actually transform the magnitudes onto the Johnson-Cousins system it is necessary to know the spectral shape, or at least a color, of each of the identified sources. Since this is not generally known, or known well, we have not attempted such transformations.
Various corrections are necessary to the inferred magnitudes. First, an aperture correction is necessary to estimate the true magnitudes from those that are measured in a small aperture. We used the TinyTim software (Krist & Hook 2001) to generate synthetic PSFs for each of the filters. From aperture photometry on these PSFs we calculated the aperture corrections between the apertures that we used for the data analysis and a radius aperture. These corrections were applied to the inferred magnitudes. An additional correction of mag was applied to transform the results to a nominal infinite aperture (Mobasher et al. 2002). A second correction that must be applied is for geometric distortion, which results in a change of the surface area covered by each pixel. This pixel area variation is imprinted on point source counts during the flat-fielding step (which is defined to make a source of uniform surface brightness look “flat” on the detector). We corrected for this using the known pixel area variations (Mobasher et al. 2002). The correction amounts to at most mag in the corners of each chip. The third correction that must be applied is for imperfect charge-transfer efficiency (CTE), which causes charge to be lost from the aperture during read-out. We corrected all photometric results (detections only) using the CTE correction algorithm of Dolphin (2000), using the equations posted at http://purcell.as.arizona.edu/wfpc2_calib/ (December 2004 version). The CTE corrections increase with decreasing background.
The final magnitudes obtained after application of all corrections are listed in column (10) of Table 3. We calculated the total statistical error as , where is the net number of counts in the aperture, A is the area of the aperture in pixels, is the noise level per pixel determined from the background region, and g is the gain (either 7 or 14 electron/data unit). This error is more conservative than the error computed by the phot routine and was on average / magnitudes larger for sources brighter/fainter than 24. It is likely that these are underestimates of the true errors, especially in cases with complicated morphologies. Implied absolute magnitudes were calculated based on the galaxy distances quoted in Table 1 and are listed in column (12). Signal-to-noise ratio () estimates were calculated for each counterpart in each image and are listed in column (13), using the formula . Sources for case S mostly had , due to the detection threshold used in the daofind routine. For case M sources we found that our manual source identification was also able to detect sources down to , although most of the sources thus identified have much higher .
For each ULX and each dataset (except those of case X for which the data were suspect and case C where the local background level is ambiguous) we estimated the limiting magnitude down to which a source might plausibly have been detected. For this we calculate the noise in a background aperture of the same size as was used for source photometry. We multiply the result by 4 to get the counts needed for a detection. We transform this result to magnitudes using the exposure time and filter zeropoints and apply the appropriate aperture correction. The results are listed in column (6) of Table 3. For comparison, we also calculated the limiting magnitudes using the Exposure Time Calculators (ETCs) for WFPC2 maintained by STScI. These more idealized calculations generally give somewhat fainter limits than the ones we calculated. This is as expected, given that the ETCs do not take into account that we are searching for sources in nearby galaxies. The galaxy light adds both noise, fluctuations and complexity.
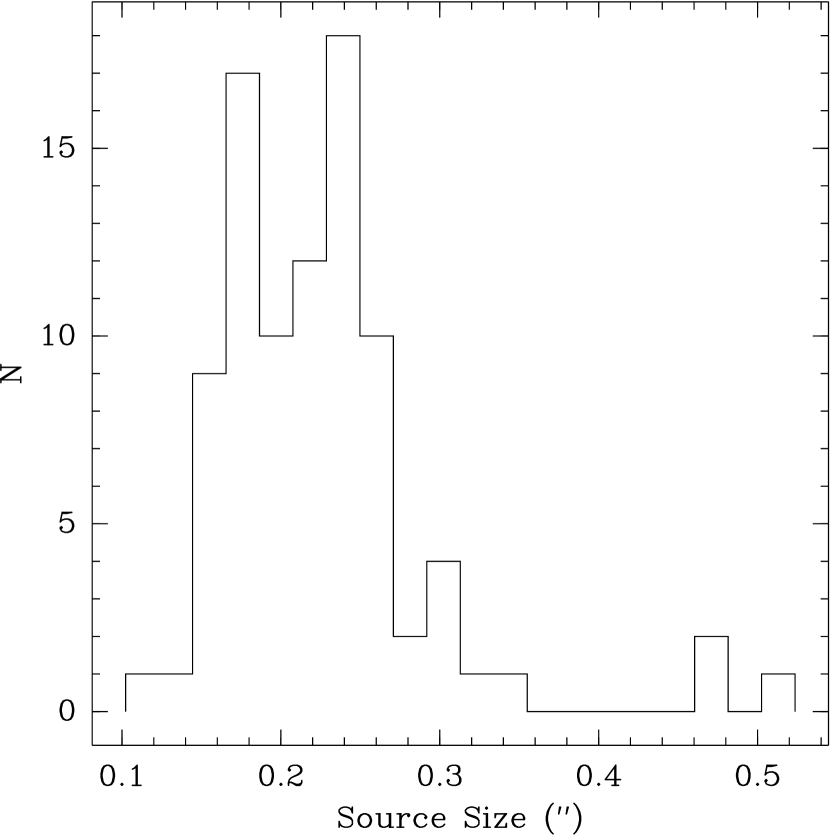
In the final column we list source radius estimates. We found that kernel-fitting routines such as imexamine did not converge consistently, particularly for “M” sources. We therefore estimated the source sizes visually from the mosaic images (with a uniform pixel size of 0.1”). While subjective, the intent here is to simply give an estimate for the spatial extent of the sources and not a detailed spatial analysis. We plot in Figure 3 a histogram of the estimated source sizes. The majority of sizes were in the range 0.1-0.4”, with a few outliers having larger sizes. Excluding these outliers, the mean and standard deviation of the source radii are 0.22” and 0.05”, respectively. For comparison, from the WFPC2 Instrument Handbook, this mean radius corresponds to an encircled energy fraction of at 4000Å. In cases where the use of imexamine resulted in a reasonable full-width half-maximum (FWHM) estimate, the mean value was 0.15” whereas the mean visual source size for these sources was 0.19”. Therefore most sources are likely to be point sources or at most only marginally resolved, with our visual size estimate being larger than the FWHM. We also list the linear extent corresponding to the source size assuming the distances listed in Table 1.
6. Discussion
We have presented a systematic analysis of archival WFPC2 observations for a sample of ULXs. The main motivation was to determine the characteristics of possible optical counterparts to ULXs. Minimally a key goal was to determine what is the probability of detecting a counterpart. Other goals would be to establish the typical optical luminosity of counterparts and how the implied X-ray to optical (or UV) luminosity ratio compares to known source types. Finally, in cases in which observations are available in multiple wide-band filters, the optical colors might also be a useful discriminator of source type. Below we address the color information content of the sample prior to computing optical luminosities since any knowledge of the spectral types of the counterparts would benefit the computation. Of course, when multiple counterparts are present, obviously at most only one of the counterparts within the error circle can be the true counterpart of the ULX. Also, when only a single, faint counterpart is observed, particularly in late-type galaxies, the association may simply be due to chance coincidence. Therefore this discussion should be taken as an assessment of what properties any potential counterparts would have on average.
6.1. ULX WFPC2 Counterpart Frequency
As is evident from Table 3 and Figure 2, variably zero, one or many counterparts are detected within the (combined X-ray/HST) error circles. Since the stellar populations in elliptical galaxies are old (and hence faint), a simple assumption would then be that finding no counterpart would be more common in early-type galaxies. Also, since there is an association between X-ray binaries and globular clusters in elliptical galaxies (see, e.g., Maccarone, Kundu, & Zepf 2003), we might expect to find counterparts to extra-nuclear X-ray sources in elliptical galaxies that are likely to be globular clusters. To test these assumptions, we plot in Figure 4 histograms showing the Hubble type distribution for the Chandra/WFPC2 galaxy sample (with 25 galaxies total), the subset in which at most one counterpart was detected (15 galaxies) and the subset in which more than one counterpart was detected and/or an observation was marked as complex (10 galaxies). As expected, there is a tendency for single or no counterparts to be found in early-type galaxies and multiple counterparts and/or complex cases to occur in late-type galaxies.
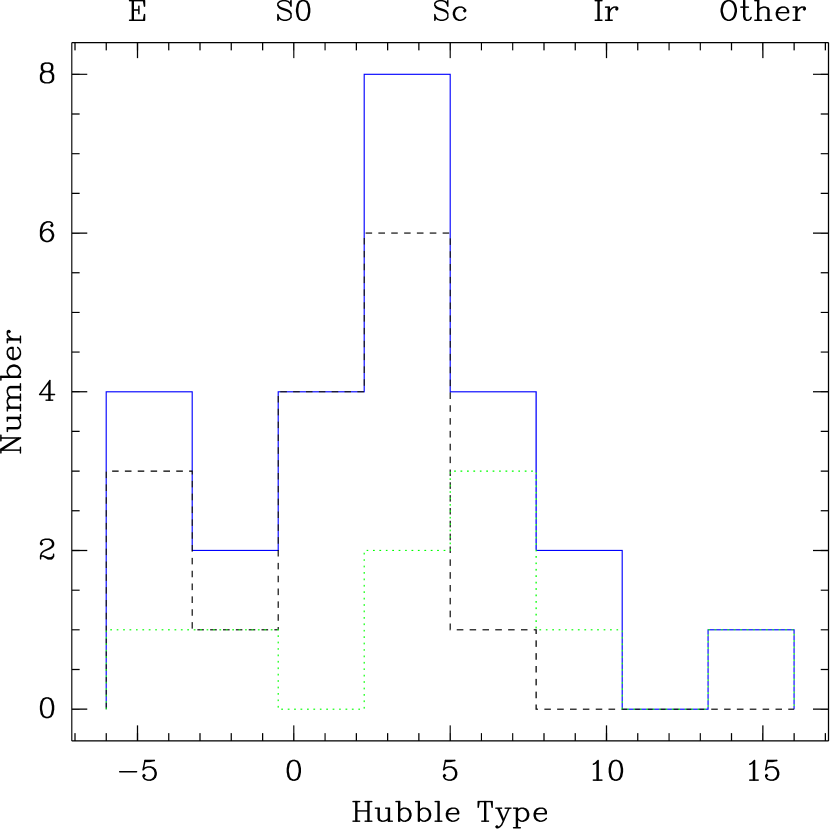
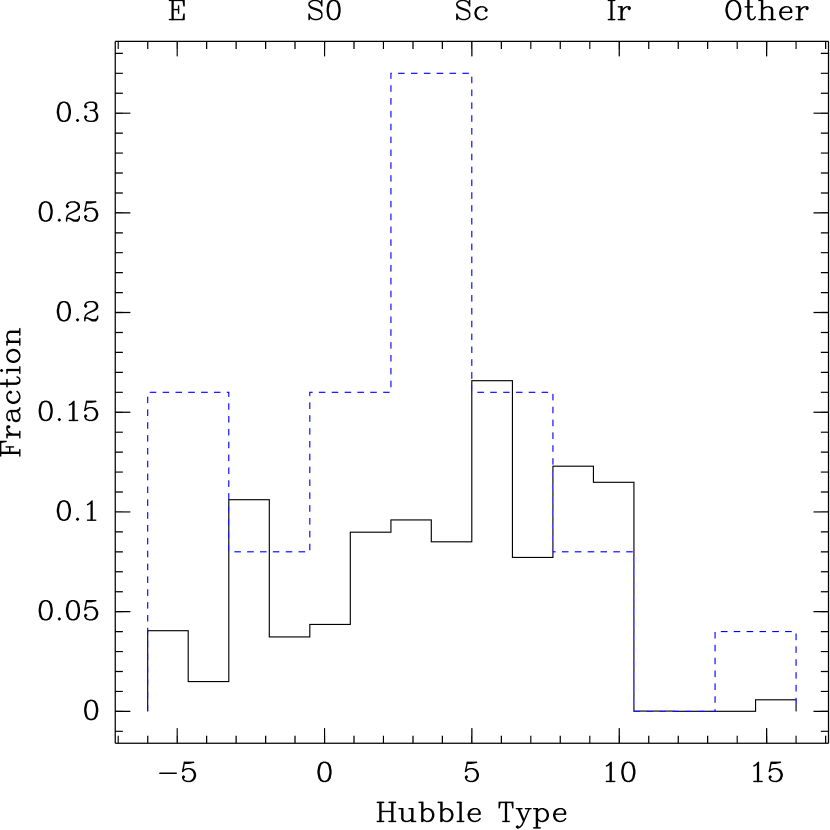
In Figure 4 we also compare the Hubble types of the galaxies in our Chandra/WFPC2 sample to the type distribution of nearby (, or D 66 Mpc for = 75 km s-1 Mpc-1 and = 0.5) galaxies in RC3, in order to assess if there is any bias in our galaxy sample. While the statistics are limited, there is a slight excess of ellipticals and irregular/peculiars, and a more pronounced excess of Sb/c galaxies in our sample relative to nearby galaxies. Note that the prominent peak in the Chandra/WFPC2 galaxy type distribution at Sb/c is mainly due to a large number of Sb (type = 3) galaxies (see Table 1). Therefore, in addition to the excess of Sb galaxies, the main bias in the sample is a lack of early-type (i.e., S0, Sa) and late type (i.e, Sd) spiral galaxies.
Finally, we computed the number of background sources expected for the galaxies with Hubble type 3 and Hubble type 3. This was done by taking the larger of the limiting flux in each Chandra field and the flux associated with a source (i.e., see Ptak & Colbert 2004), in both cases computed in the 2-10 keV band based on the full-band count rates. The number of background sources expected in each field was then taken from the 2-10 keV logN-logS plot given in Bauer et al. (2004) derived from the Chandra Deep Fields. This resulted in an estimate of 5.5 background sources in the early-type galaxies (35% of the total) and 3.8 background sources in the late-type galaxies (14% of the total).
6.2. Optical Colors
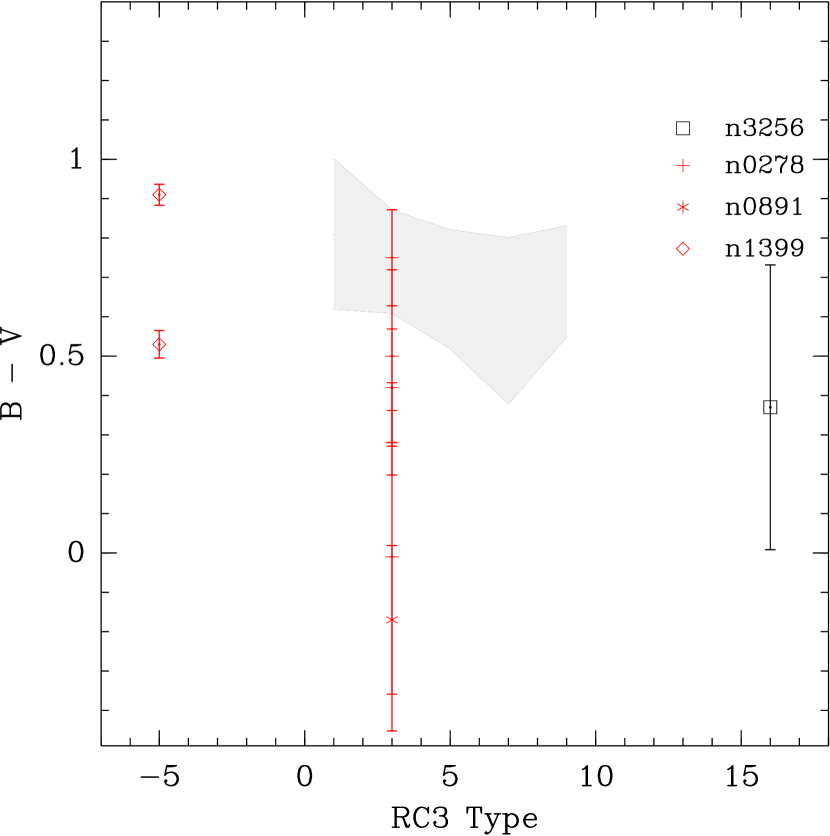
We turn now to cases in which there are observations of a ULX in more than one wide-band filter and at least one detection (and hence a color or color limit can be computed). Here we restrict our sample to observations with the filters F336W, F450W, F555W, F606W and F814W since they map reasonably well to standard UBVI magnitudes. With both F555W and F606W approximating the V band, hereafter we refer to them as and . Only a few ULXs did not have a (CADC) observation in one of these filters, and in those cases the observations were entirely in either narrow-band (e.g., ULX 41 in Circinus) or UV (e.g., ULXs 43 and 44) filters. The colors and color limits are listed in Table 4. The colors B-V and V-I are plotted (as a function of Hubble type of the host galaxy) in Figure 5. Note that 6/9 of the -I and 5/8 of the B- data points are due to ULX 1 in NGC 278 (Hubble type 3 = Sb). The color F555W - F814W differs from Johnson V-I negligibly for V-I in the range -1 to 3 (see Holzman et al. 1995 333see also http://www.stsci.edu/instruments/wfpc2/Wfpc2_hand_current/ch8_calibration10.html). The sense of the correction between and is such that it is negligible for sources with V-I 0.5. For red sources, (for stellar types G and M0III), i.e., at worst we are underestimating V-I where V=.

6.3. Optical Luminosities
Excluding the counterparts marked as complex, there are 67 unique counterparts in which one of UBVI was used. For observations in these filters we first compute the absolute magnitude and the luminosity in solar units, e.g., ), where we use , , , for solar absolute magnitudes (Zombeck 1990). The results are listed in Table 5. Since of the counterparts include either a or measurements, and V is a convenient magnitude for comparison with published photometry and models, we proceed by computing an effective V-band luminosity. For cases with color information available, we classified the counterpart as red if V-I 0.5, B-V 0.5, B-I 1.0, or U-V 0.7 and blue otherwise. If no color information is available, then we assumed sources in galaxies with Hubble type to be red and blue otherwise. For red (blue) counterparts, we computed assuming a G5 (A0) stellar spectrum. We then computed , the effective absolute V magnitude, and (we assumed an effective wavelength of 5500Å and zero-point flux density of ; Zombeck 1990), also listed in Table 5. is listed in units of , and these values are in good agreement with those computed from the absolute magnitudes in individual filters.
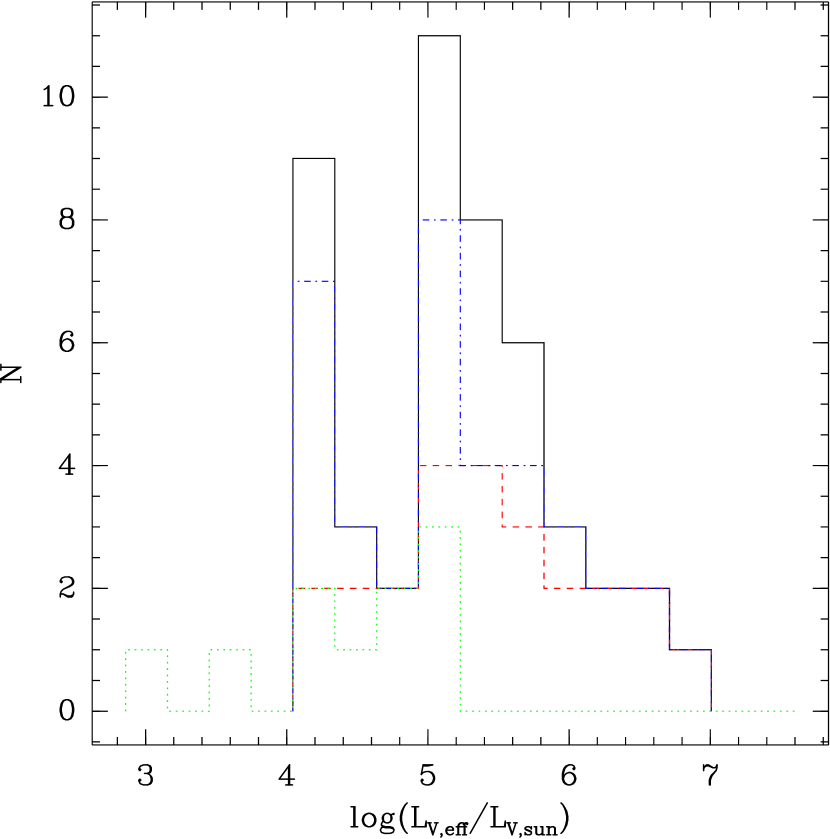
In Figure 6 we show the distributions of and . While the statistics are limited, the distribution is reminiscent of a power-law distribution with a cut-off at , which is consistent with the average limiting magnitude of the fields discussed here (24.9). The distribution shows that we are observing sources at least as luminous , with a mean value of . We also plot the luminosity distributions only including sources brighter that V=24 and V=23.5. The large drop-offs in number counts below suggests that we are only approaching completeness for counterparts with . We also plot the effective V band luminosity distribution for upper-limits (also listed in Table 5). For the majority of cases the limiting luminosity was or higher, suggesting that the lack of a counterpart was due at least in part to the lack of sufficient depth in those fields to detect counterparts of comparable luminosity to the counterparts in the entire sample.

An important issue is to what extent there is a trend in counterpart luminosity with distance since at larger distances only brighter sources would be detectable (i.e., the Malmquist bias), and source confusion may also become problematic at larger distances. In Figure 7 we plot the the optical luminosities of the counterparts as a function of distance, and there is in fact a strong correlation between and distance, although only at distances Mpc. We also plot the luminosity expected for a source at a constant flux level (with arbitrary normalization) to show the sense of the Malmquist bias. The observed optical luminosities increase more rapidly than this trend, although of course in practice the observations were performed with a range of filters and exposure times resulting in a large range in limiting flux. Source confusion may also be contributing, however the lack of a strong trend at larger distances suggests the neither source confusion nor Malmquist bias is a factor at distances Mpc. Since our discussion is largely based on optical luminosities spanning dex, the presence of some source confusion is not going to strongly impact our conclusions.

6.4. Source Assessment
Unless an ULX is in reality an interloper (i.e., a foreground star or background AGN), the most likely physical model is that they are some sort of X-ray binary (XRB; e.g., see Colbert et al. 2004). In this case, the most optimistic scenario is that a given optical counterpart is the companion star. However, the ULX counterpart may also represent a cluster of stars or simply a clump of gas or stars (particularly in an arm of a spiral galaxy). We address these in turn below.
6.4.1 Isolated X-ray Binary
The absolute magnitudes in Table 5 are in the range -5 to -12, corresponding to . Blue giant stars have and supergiants can have . In the supergiant case the colors are not restrictive since blue, yellow or red supergiants could be present. However in all of these cases the stars would be very young ( years; Bertelli et al. 1994) and massive () and therefore the XRB would be a high-mass XRB. High-mass XRB typically have relatively low X-ray/optical flux ratios, in the range of (Bradt & McClintock 1983). In Figure 8 we show the distribution of values from our sample along with the observed values of from Bradt & McClintock (1983) for low and high-mass XRB. In general, . By definition ULXs are orders of magnitude brighter than typical high-mass XRB however the stellar companion would not necessarily be more luminous than those found in Galactic high-mass XRB. Accordingly the values for our counterparts would be expected to be 1-2 dex higher than those found high-mass XRB, and Figure 8 is consistent with this. Therefore the high-mass XRB scenario is not ruled out by our data, although of course such young stars would not be expected in early-type galaxies and are therefore unlikely in galaxies with Hubble types less than or for ULXs that are clearly bulge or halo sources, such as ULX 32 in NGC 4565. Conversely a high-mass XRB association with ULXs would be consistent with the ULX/star formation connection that has been suggested (e.g., Swartz et al. 2004).

Another possibility is that the ULX is an X-ray binary with an accretion disk, and that the accretion disk is contributing significantly to the optical-UV part of the spectrum. Copperwheat et al. (2005) discuss this possibility, taking into account the impact of X-ray irradiation of the accretion disk and companion star. They find that the expected V-band absolute magnitudes () would be in the range of -4 to -9, with the companion star often dominating over the accretion disk at low black hole masses () unless irradiation is significant. This implies optical counterparts with , consistent with many of our counterparts (see Figure 6). Copperwheat et al. also generally predict blue colors for the disk + star system. While these results were calculated for the case of an isotropic X-ray luminosity of , we find similar results for higher luminosities (and hence higher accretion rates for a given black hole mass). Note that the assumption of the X-ray luminosity being of the bolometric luminosity gives , which is often consistent with our observed values. Finally, similar results to those discussed above would be expected in the case of Bondi accretion onto an intermediate-mass black hole in a molecular cloud (Krolik 2004), with the optical emission originating several hundred gravitational radii from the black hole as in the thin-disk case (J. Krolik, priv. comm.).
6.4.2 Structure in Spiral Disks
Inspection of Figure 2 suggests that in several cases we are observing fine structure in the spiral arm of the galaxy. In this case the counterparts would likely be local maxima in the surface brightness and/or holes in the extinction. The mean source extent of 0.2” corresponds to a linear size of pc for the mean distance of 20 Mpc for the galaxies in this sample (see Table 3). In Figure 5 we also plot the 1- range in B-V and V-I color for spiral galaxies given in de Jong (1996). The galaxies NGC 278 and NGC 891 are the only spiral galaxies (both Sb galaxies) with color information for counterparts, and again most of the data points are due to ULX 1 in NGC 278. While the data are (very) limited, the colors are bluer than expected for the integrated emission of an Sb galaxy, possibly implying regions that are younger than Sb disks are on average. This also would be crudely consistent with the ULX/star formation connection that has been suggested.
6.4.3 Clusters
We next consider the case of the counterparts being stellar clusters. In the case of early-type galaxies this would of course correspond to globular clusters (GCs). Although the numbers are limited, for earlier type galaxies, B-V and V-I tend to be red ( 0.5), possibly indicating an older stellar population (e.g., age yrs; see Leitherer et al. 1999; Bruzual & Charlot 2003). For comparison, the mean B-V and V-I colors for GCs in M31 (the Milky Way) are 0.72 (0.71) and 0.96 (0.94) (Barmby et al. 2000), and the globular clusters in NGC 1399 associated with ULXs 8 and 9 (see Angelini et al. 2000) have B-V = 0.5, 0.9 and V-I=1.1, 1.0. Chandar, Whitmore, & Lee (2004) present an HST survey of GCs in nearby spiral galaxies and find that the GC colors similarly lie in the range 0.5 B-V 1.2 and 0.7 V-I 1.5, and that the GC luminosities peak at to , consistent with most counterparts in our sample. The ULX counterparts in NGC 3311 (a lenticular) and ULX 11 in NGC 1700 (an elliptical) have red colors (V-I 1-2), and ULX 40 in Cen-A has a counterpart with V-I 0.9. These are likely to be GCs also. The ULX counterpart in NGC 4565 has also been identified as a globular cluster (albeit with a blue color) by Wu et al. (2002).
Conversely, V-I and B-V 0.5 would be indicative of a stellar population that is very young ( yrs) and/or has low metallicity (Leitherer et al. 1999; see also the discussion in Soria et al. concerning the application of stellar evolutionary models to counterparts in the vicinity of a ULX in NGC 4559). V-I and/or B-I colors in the range 0.0-0.5 are observed for several counterparts in late-type galaxies (ULX 2 in NGC 891 and several of the counterparts for ULX 1 in NGC 278). Only U-V is available (i.e., with our CADC Association data selection criterion) for the ULXs in the Antennae. These counterparts are all blue, with U-V 0.5, and the counterparts in the Antennae that appear more red are probably in regions of higher extinction. Also note that U-F336W varies from 0 to 0.8 as U-B varies from 0 to -1.5 (Holtzman et al. 1995), and therefore the very blue U-V colors in Table 4 are over-estimated (but the true U-V are nevertheless blue). Interestingly there are also some counterparts in elliptical galaxies with blue colors (e.g., ULX 37 in NGC 5018 with U-V = -1.5). If associated with the galaxies these are likely to be young stellar clusters captured or formed after a recent encounter or merger. Finally, there are counterparts in late-type galaxies with red colors (specifically several of the counterparts to ULX 1 in NGC 278 and ULXs 15-16 in NGC 3256) however this may be due to extinction in these galaxies. Alternatively the red colors may be due in part to the onset of a red supergiant phase, although this would require the rather specific circumstances of a year old cluster resulting from an instantaneous star formation burst (Leitherer et al. 1999).
Even if the optical counterpart is a cluster, the X-ray emission is still likely to be due to an accreting X-ray binary. In this case the X-ray/optical flux ratio would be “diluted” by the optical emission of the stars from the cluster, i.e., the observed X-ray/optical flux ratio would be lower than that of an isolated X-ray binary, by a factor of , where is the cluster V-band luminosity and is the X-ray binary V-band luminosity. As discussed above, some of the counterparts in our sample have , in excess of what might be expected from an isolated ULX (Copperwheat et al. 2005) by at least 1-2 dex. In the case of high-mass X-ray binaries (HMXB), the distribution of the expected ratio largely overlaps the observed distribution of our counterparts, although the peak of the HMXB distribution is dex lower than the peak of the counterpart . Therefore the counterpart distribution is consistent with HMXB distribution assuming on the order of 1% of the cluster optical emission is due to the HMXB. Conversely, in old clusters ( years), we would expect any X-ray binary to be a low-mass X-ray binary (LMXB). Here larger amounts of dilution would be consistent with the observed values since the typical LMXB values are 2 dex or more larger than observed in our counterparts. In summary, our observed and X-ray/optical flux ratios are generally consistent with a LMXB in old clusters, but probably only consistent with a HMXB in young clusters if the optical light of the X-ray binary is a larger fraction of the optical light of the entire cluster than is the case with a LMXB in an old cluster.
Finally, we estimate the black hole mass that would be expected if a black hole were present with of the cluster mass. This is roughly consistent with the well-known bulge mass / black-hole mass trend, although the slope is highly uncertain at the low mass end. Laor (2001) finds that tends to be lower for lower-mass systems (i.e., in ellipticals versus in late-type spirals). However recent modeling has shown that clusters may form a black hole with mass of the cluster mass in a relatively short time ( Myr; Portegies Zwart & McMillan 2002; Geurkan, Freitag, & Rasio 2004). The results are shown in Figure 9 and there is no obvious trend between (and hence estimated ) and . Note that we plotted black hole mass estimates based on a mass-to-light (M/L) ratio of 1, i.e., , which is only appropriate for a cluster of age several billion years. From population synthesis modeling the M/L ratio of a cluster is expected to range from to for clusters of age to years (McLaughlin & Van der Marel, 2005). Therefore for young clusters the black hole masses would be dex lower than plotted here. We also plot the Eddington luminosity for a given black hole mass, , which is the maximum expected X-ray luminosity for isotropic emission. Most of the X-ray luminosities are well below the predicted Eddington luminosity given the estimated , although there are some cases where the X-ray luminosity exceeds this value, suggesting either anisotropic emission or a larger black hole mass than of the cluster mass (again the ratio may differ significantly from 1 as assumed here). Also note that, particularly in the case of spiral galaxies, multiple counterparts are found for some ULXs, and the corresponding BH masses for each counterpart are plotted in Figure 9. Of course it is unlikely that all counterparts in those cases are bound systems with an intermediate-mass black hole.

6.4.4 Interlopers
We turn now to the case of either a foreground star or a background AGN. As stated above, we calculate that of the ULXs are likely to be background or foreground X-ray sources (). The typical values of X-ray to optical flux ratio expected in the case of an AGN would be (see, e.g., Norman et al. 2004; Bauer et al. 2004) while in the case of foreground stars it would be (c.f., Georgakakis et al. 2004). From Table 5, most of the counterparts are consistent with the background AGN possibility, particularly in the early-type galaxies, although a few have very low or very high X-ray to optical ratios, making a foreground star or an X-ray binary in one of the scenarios above more likely, respectively.
7. Conclusions
We have presented a comprehensive analysis of the available WFPC2 Association data with coverage of a sample of ULXs. The relative astrometry between the Chandra and HST data was corrected whenever possible, in some cases requiring shifts of several arcseconds. The final error circles were 0.3-1.7” depending on the availability of sources useful for the registration. With the error circles there were varyingly no, one or many potential counterparts. The limiting luminosities are often above the faintest observed luminosities suggesting that the lack of multiple counterparts in some cases is due to insufficient depth. We focused on the “wide” filter observations corresponding to UBVI filters since the colors could be compared to known source properties. This analysis showed that there was a slight tendency for early-type galaxies to have counterparts that were red (i.e., B-V 0.5, V-I 0.5) and conversely late-type galaxies had blue counterparts. In general the source properties did not differ significantly from the properties of those expected from either structure in spiral disks (although in a few cases the colors were blue suggesting a young region) or clusters. The counterparts found in early-type galaxies are generally consistent with globular clusters in both their colors and luminosities. The X-ray/optical flux ratios were generally consistent with high-mass X-ray binaries, background AGN or low-mass X-ray binaries in clusters (i.e., with artificially lowered flux ratios). Therefore for most of the sources, any one scenario cannot be ruled out although there are several cases (i.e., with very low optical luminosities and/or unusual X-ray/optical flux ratios) that may be isolated X-ray binaries. If the counterparts are in fact (bound) clusters, then the observed X-ray luminosities are well within the Eddington luminosities implied by the predicted central black hole masses (i.e., of the cluster mass estimated from the optical luminosity). We also find that the scenario in which the optical flux is dominated by the emission of an accretion disk around a black hole results in optical and X-ray fluxes consistent with those observed, although the black hole mass would have to be unless the disk is irradiated.
8. Notes on Individual ULXs
8.1. ULX 1
ULX 1 is found in disk of NGC 278 , which is a face-on spiral (T=3). 6 potential counterparts are found, mostly in the 1-2 error annulus although the brightest counterpart is within the 1 error circle. The B-V and V-I colors are generally blue although some counterparts have B-V 0.5.
8.2. ULX 2
ULX 2 is found in NGC 891, an edge-on spiral galaxy (T=3), located just outside of a prominent dust lane. B-V = -0.2 and V-I 0.1, suggesting a very blue counterpart or else the optical source varied between the different filter observations.
8.3. ULXs 3-4
These ULXs are found in NGC 1068, a well-known face-on spiral galaxy (T=3) with strong starburst and Seyfert activity. In both cases the source density is high and in most cases different counterparts are found in different filters. However in this case the astrometry could not be corrected, due in part to the complexity of the nuclear region in both the X-ray and optical bands and the small FOV of the WFPC2 images. Future work may improve the registration by leveraging ground-based optical images.
8.4. ULX 5
ULX is found in the disk of NGC 1097, a face-on spiral galaxy (T=3). The only Association image was in the UV and no counterparts were found.
8.5. ULXs 6-8
These ULXs are found in NGC 1399, an elliptical galaxy (T=-5). ULXs 7 and 8 have single counterparts that are consistent with globular clusters (see also Angelini et al. 2001). ULX 6 is possibly due to a background AGN, although its value of 1.4 is somewhat large relative to typical Chandra Deep Field sources (see Bauer et al. 2004).
8.6. ULXs 9-11
These ULXs are found in NGC 1700, an elliptical galaxy (T=-5). NGC 1700 is one of the most distant galaxies in our sample at 52 Mpc. No counterparts are found for ULX 10. The counterparts for ULX 9 and 11 have red colors, consistent with a globular cluster interpretation.
8.7. ULXs 12-14
These ULXs are found in M82 (T=90), which is the archetypal, and one of the nearest, starburst galaxies. In all cases the optical emission is too complex for individual sources to be identified, with the source regions dominated by diffuse emission with non-uniform extinction.
8.8. ULXs 15-16
ULXs 15 and 16 are found in NGC 3256, a merger (T=99). Two counterparts are found for each ULX. One of the counterparts for ULX 16 has a red color limit (B-I 1.0). This may be due to extinction however note that this counterpart is only marginally within the 2 error circle and may be unrelated to the ULX.
8.9. ULXs 17-18
These ULXs are in NGC 3311, the central galaxy of the Hydra cluster (T=-4). The ULXs are found near the nucleus which is dusty. Multiple counterparts are found for both, with one being very red, most likely due to dust extinction.
8.10. ULX 19
ULX 19 is found in the edge-on spiral galaxy NGC 3628 (T=3). The ULX is in the center of a prominent dust lane, and a single counterpart is detected with = 1.6. This is consistent with an isolated X-ray binary scenario however the V-band flux is probably underestimated due to extinction.
8.11. ULX 20
ULX 20 is found in the spiral galaxy (T=3) NGC 3627, located on the edge of the disk. Here it should be noted that we were not able to correct the HST astrometry and the position of the ULX (relative to nearby stars) differs by ” between the two V band images. Therefore the two 3.3” (2) error circles do not overlap and the detection of a counterpart (beyond the 1 error radius) in one image but not the other does not imply variability.
8.12. ULX 21-28
These ULXs are found in the Antennae galaxy merger. As discussed in Section 1, the ULX/HST correlation in the Antennae has been assessed in Zezas et al. (2002) and Zezas & Fabbiano (2002). They did not correct the HST astrometry and assumed a 2” error circle, and often found multiple potential counterparts, typically with blue colors suggesting a young population. Our results are consistent, with our (Method 2) 2 error circle being 1.6” in radius. ULX 25 was identified as a background AGN by Clark et al. (2005).
8.13. ULX 29
ULX 29 is found in NGC 4150, a lenticular galaxy (T=-2). The only Association image available was an I band exposure in which no counterparts were found.
8.14. ULX 30
ULX 30 is found in NGC 4490 which is a late-type spiral galaxy (T=7) with the ULX being located along the disk. Not surprisingly, multiple HST sources are found within the 2 error circle.
8.15. ULX 31
ULX 31 is found in NGC 4559, also a late-type spiral (T=6). The ULX is located in the disk near the nucleus. Two faint point-like counterparts are found although the region is somewhat complex. Cropper et al. (2004) found no counterparts in the vicinity of this ULX (their X10), using Association data. Cropper et al. (2004) also use B and I band images which were not available at the start of this study. Similarly the HST data discussed in Cropper et al. (2004) and Soria et al. (2005) overlapping another ULX in NGC 4559 (their X7) was not available at the start of this study.
8.16. ULX 32
ULX 32 is found in NGC 4565, an edge-on spiral (T=3). The ULX is on the edge of the bulge and has been identified with a globular cluster in Wu et al. (2002).
8.17. ULX 33
ULX 33 is found in NGC 4594 (the Sombrero galaxy; T=1). The ULX is located in the disk near the nucleus (outside the dust lane). An H counterpart is found marginally within the 2 error circle (a cosmic ray not completely removed is noticeable in the 1 error circle).
8.18. ULX 34
ULX 34 is found in NGC 4725, an early-type spiral (T=2). The ULX is located inside an outer spiral arm. Diffuse flux is evident at the ULX position and a (point-like) V-band counterpart is found at the 2 radius.
8.19. ULX 35
ULX 35 is found in NGC 4945, a late-type spiral (T=6). No counterpart is found, however the ULX region is located near the nucleus within the disk and the lack of a counterpart may be due to extinction.
8.20. ULXs 36-37
These ULXs are found in the elliptical galaxy NGC 5018 (T=-5), with ULX 37 being located near the nucleus. The counterpart for ULX 37 has a very blue color (U-V=-1.6). This counterpart is therefore likely to be a background source, with an X-ray/optical flux ratio consistent with AGN.
8.21. ULX 38-39
These ULXs are found in the face-on, late-type spiral galaxy NGC 5033 (T=5). The ULXs are located close to each other, within the disk. Only UV Association images were available and several potential counterparts were detected.
8.22. ULX 40
ULX 40 is found in the elliptical galaxy NGC 5128 (Centaurus A; T=-2). The ULX is located outside of the dusty central region. Two counterparts are found. Neither of our counterparts corresponds to the counterparts discussed in Ghosh et al. (2006), based on the same WFPC2 data. This is because Ghosh et al. applied astrometric corrections to the HST data based on a cataloged globular cluster (an approach not attempted here) and a nearby transient source that was not detected in the ACIS image used here (but was detected in a subsequent ACIS observation not public at the start of our study). The brighter of the two counterparts listed here is magnitude brighter than the counterpart discussed in Ghosh et al., however we derive a similar color (V-I compared with V-I in Ghosh et al.) implying this counterpart is similar in nature to the counterpart discussed in Ghosh et al. Since our discussion is based on the properties of counterparts on average (and often the counterparts to a given ULX have similar colors), our conclusions are not affected our (potentially incorrect) counterpart selection here.
8.23. ULXs 41-42
These ULXs are found in the Circinus galaxy, a face-on spiral (T=3). The ULXs are located in the disk of the galaxy. Only narrow-band Association images were available that overlapped ULX 41. ULX 41 is CG X-2 discussed in Bauer et al. (2001) where they identify it as a supernova based on the detection of an H counterpart (as found here) and a radio point source. ULX 42 is CG X-1 in Bauer et al. (2001), and they find no counterpart in their analysis of the archival F606W image. Their limiting magnitude is 25.3, which is consistent with our value. Weisskopf et al. (2004) claim to have detected a faint, point-like source in the WFPC2 F606W image within 0.25” of the Chandra position after registering the frames using the AGN in Circinus (as we have done here). However they do not give the significance of the source and consider the optical magnitude, 24.3, to be an upper-limit. Also note that in this case the galaxy is located low in the plane of the Milky Way with an estimated extinction of (NED).
8.24. ULX 43
ULX 43 is found in the early-type spiral galaxy NGC 6500 (T=1.7). The only (usable) Association image was in the UV where no counterpart was detected.
8.25. ULX 44
ULX 44 is found in the early-type spiral galaxy NGC 7174 (T=1.8). NGC 7174 is part of the group HCG 90, and has a highly disturbed morphology due to interaction with NGC 7176. As with ULX 43 the only Association image was in the UV/U (F300W) and a single counterpart was detected.
References
- Aldcroft (2002) Aldcroft, T. 2002 (Cambridge: Chandra X-Ray Science Center) [http://asc.harvard.edu/cal/ASPECT/celmon/]
- Anderson & King (2003) Anderson, J., & King, I. R. 2003, PASP, 115, 113
- Angelini, Loewenstein & Mushotzky (2001) Angelini, L., Loewenstein, M. & Mushotzky, R. 2001, 557, L35
- Barmby et al. (2000) Barmby, P., Huchra, J., Brodie, J., Forbes, D., Schroder, L., & Grillmair, C. 2000, AJ, 119, 727
- Bauer et al. (2001) Bauer, F. et al. 2001, AJ, 122, 182
- Bauer et al. (2004) Bauer, F. et al. 2004, AJ, 128, 2048
- Begelman (2002) Begelman, M. 2002, ApJ, 568, L97
- Bessel et al. (1998) Bessel, M. S., Castelli, F., & Plez, B. 1998, A&A, 333, 231
- Biretta et al. (2001) Biretta, J., et al. 2001, WFPC2 Instrument Handbook, Version 6.0 (Baltimore: Space Telescope Science Institute)
- Bradt & McClinktock (1983) Bradt, H. & McClinktock, J. 1983, ARA&A, 21, 13
- Brammer et al. (2002) Brammer, G., Whitmore, B., & Koekemoer, A. 2002, in 2002 HST Calibration Workshop, Arribas, S., Koekemoer, A., & Whitmore, B., eds., p. 329 (Baltimore: Space Telescope Science Institute)
- Brown et al. (2000) Brown, R., Forbes, D., Kissler-Patig, M., & Brodie, J. 2000, MNRAS, 317, 406
- Bruzual & Charlot (2003) Bruzual, G. & Charlot, S. 2003, 344, 1000
- Chandar, Whitmore, & Lee (2004) Chandar, R., Whitmore, B., & Lee, M. 2004, ApJ, 611, 220
- Clark et al. (2005) Clark, D. et al. 2005, ApJ, 631, L109
- Colbert et al. (1995) Colbert, E. J. M., et al. 1995, ApJ, 446, 177
- Colbert & Mushotzky (1999) Colbert, E. J. M., & Mushotzky, R. F. 1999, ApJ, 519, 89
- Colbert & Ptak (2002) Colbert, E., & Ptak, A. 2002, ApJS, 143, 25
- Colbert et al. (2004) Colbert, E., Heckman, T., Ptak, A., Strickland, S., & Weaver, K. 2004, ApJ, 602, 231
- Copperwheat et al. (2005) Copperwheat, C., Cropper, M., Soria, R., & Wu, K. 2005, MNRAS, 362, 79
- Cropper et al. (2004) Cropper, M., Soria, R., Mushotzky, R., Wu, K., Markwardt, C., & Pakull, M. 2004, MNRAS, 349, 39
- de Jong (1996) de Jong, R. 1996, A&A, 313, 377
- de Vaucouleurs et al. (1991) de Vaucouleurs, G., de Vaucouleurs, A., Corwin, H. G., Buta, R. J., Paturel, G., & Fouque, P. 1991, Third Reference Catalog of Bright Galaxies (RC3; New York: Springer-Verlag)
- Dickey and Lockman (1990) Dickey, J. M., & Lockman, F. J. 1990, ARA&A, 28, 215
- Dolphin (2000) Dolphin, A. E., 2000, PASP, 112, 1397
- Fabbiano (1989) Fabbiano, G. 1989, ARA&A, 27, 87
- Fabbiano (2003) Fabbiano, G., et al. 2003, ApJ, 584, L5
- Foschini et al. (2002) Foschini, L. et al. 2002, A&A, 392, 817
- Frank, King, & Raine (2002) Frank, J., King, A., & Raine, D. 2002, Accretion Power in Astrophysics (Cambridge University Press, Cambridge)
- Gao et al. (2003) Gao, Y., Wang, Q. D., Appleton, P. N., & Lucas, R. A. 2003, ApJ, 596, L171
- Georgakakis et al. (2004) Georgakakis, A., et al. 2004, MNRAS, 349, 135
- Geurkan, Freitag, & Rasio (2004) Geurkan, M., Freitag, M., & Rasio, F. 2004, ApJ, 604, 632
- Ghosh et al. (2006) Ghosh, K., Finger, M., Swartz, D., Tennant, A., & Wu, K. 2006, ApJ, 640, 459
- Goad (2002) Goad, M., Roberts, T., Knigge, C., & Lira, P. 2002, MNRAS, 335, L67
- Grimm, Gilfanov, & Sunyaev (2002) Grimm, H., Gilfanov, M., & Sunyaev, R. 2002, A&A, 391, 923
- Grimm, Gilfanov, & Sunyaev (2003) Grimm, H., Gilfanov, M. & Sunyaev, R. 2003, MNRAS, 339, 793
- Gutierrez (2006) Gutierrez, C. 2006, ApJ, 640, L17
- Holtzman et al. (1995) Holtzman, J. et al. 1995, PASP, 107, 1065
- Irwin et al. (2003) Irwin, J. A., Athey, A. E., & Bregman, J. N. 2003, ApJ, 587, 356
- Jeltema et al. (2003) Jeltema, T., et al. 2003, ApJ, 585, 756
- Kaaret et al. (2003) Kaaret, P., Corbel, S., Prestwich, A. & Zezas, A. 2003, Science, 299, 365
- Kalogera et al. (2004) Kalogera, V., Henninger, M., Ivanova, N., & King, A. 2004, 603, L41
- Kilgard et al. (2002) Kilgard, R. E., Kaaret, P., Krauss, M. I., Prestwich, A. H., Raley, M. T., & Zezas, A. 2002, ApJ, 573, 138
- King et al. (2001) King, A. et al. 2001, ApJ, 552, L109
- King et al. (2002) King, A. 2002, MNRAS, 335, L13
- Körding, Falcke H., & Markoff (2002) Körding, E., Falcke H., & Markoff, S. 2002, A&A, 382, 13
- Kraan-Korteweg & Tammann (1979) Kraan-Korteweg, R. C., & Tammann, G. A. 1979, Astronomische Nachrichten, 300, 181
- Krist & Hook (2001) Krist, J., & Hook, R. 2001, The Tiny Tim User’s Guide, (Baltimore: STScI)
- Krolik (2004) Krolik, J. 2004, ApJ, 615, 383
- Laor (2001) Laor, A. 2001, ApJ, 553, 677
- Leitherer et al. (1999) Leitherer, C. et al. 1999, ApJS, 123, 3
- Liu, Bregman, & Seitzer (2002) Liu, J.-F., Bregman, J. & Seitzer, P. 2002a, ApJ, 580, L31
- Liu, Bregman, Irwin, & Seitzer (2002) Liu, J.-F., Bregman, J., Irwin, J., & Seitzer, P. 2002b, ApJ, 581, L93
- Maccarone, Kundu, & Zepf (2003) Maccarone, T., Kundu, A., & Zepf, S. 2003, ApJ, 586, 814
- Makishima (2000) Makishima et al. 2000, ApJ, 535, 632
- McLaughlin & Van der Marel (2005) McLaughlin, D. & Van der Marel, R. 2005, ApJS, 161, 304
- Micol & Durand (2002) Micol, A., & Durand, D. 2002, ST-ECF Newsletter, 30, 14 (Garching: Space Telescope European Coordinating Facility).
- Miller et al. (2003) Miller, J., Fabbiano, G., Miller, M., & Fabian, A. 2003, ApJ, 585, L37
- Miller & Hamilton (2002) Miller, M. C., & Hamilton, D. 2002, ApJ, 576, 894
- Miller & Colbert (2004) Miller, M. C., & Colbert, E. J. M. 2004, Int. J. Mod. Phys. D13, 1
- Mirabel & Rodriguez (1999) Mirabel, I. & Rodriguez, L. 1999, ARAA, 37, 409
- Mobasher et al. (2002) Mobasher, B., et al. 2002, WFPC2 Data Handbook, Version 4.0 (Baltimore: Space Telescope Science Institute)
- Monet et al. (1998) Monet, D., et al. 1998, The USNO-A2.0 Catalog (Flagstaff: U.S. Naval Observatory Flagstaff Station)
- Monet et al. (2003) Monet, D., et al. 2003, AJ, 125, 984
- Pakull & Mirioni (2002) Pakull, M. & Mirioni, L. 2002, in the proceedings of “New Visions of the X-ray Universe in the XMM-Newton and Chandra Era” (Noordwijk: ESTEC) [astro-ph/0202488]
- Portegies Zwart & McMillan (2000) Portegies Zwart, S. & McMillan, S. 2000, ApJ, 528, L17
- Portegies Zwart & McMillan (2002) Portegies Zwart, S. & McMillan, S. 2002, ApJ, 576, 899
- Portegies Zwart et al. (2004) Portegies Zwart, S., Baumgardt, H., Hut, P., Makino, J., & McMillan, S. L. W. 2004, Nature, 428, 6984, 724
- Ptak & Colbert (2004) Ptak, A., & Colbert, E. 2004, ApJ, 606, 291
- Ptak & Griffith (2003) Ptak, A., & Griffiths, R. 2003, in “Astronomical Data Analysis Software and Systems XII,” H. E. Payne, R. I. Jedrzejewski, and R. N. Hook, eds., ASP Conf. Series 295, 465
- Roberts & Warwick (2000) Roberts, T. P., & Warwick, R. S. 2000, MNRAS, 315, 98
- Roberts et al. (2001) Roberts, T. P., et al. 2001, MNRAS, 325, L7
- Schade et al. (2002) Schade, D., Micol, A., Durand, D., Pirenne, B., Simard, L., Dolensky, M., & Stetson, P. B. 2002, The WFPC2 Associations Science Products Pipeline at CADC and ST-ECF (Victoria: Canadian Astronomy Data Centre) [http://archive.eso.org/archive/hst/wfpc2_asn/3sites/WFPC2_Newsletter.pdf]
- Soria et al. (2005) Soria, R., Cropper, M., Pakull, M., Mushotzky, R., & Wu, K. 2004, MNRAS, 356, 12
- Statler & McNamara (2002) Statler, T. & McNamara, B. 2002, ApJ, 581, 1032
- Strickland et al. (2001) Strickland, D., et al. 2001, ApJ, 560, 707
- Sugiho et al. (2001) Sugiho, M. et al. 2001, ApJ, 561, L73
- Terashima, Inoue, & Wilson (2006) Terashima, Y., Inoue, H., & Wilson, A. 2006, ApJ, in press (astro-ph/0603528)
- Tremaine, Ostriker & Spitzer (1975) Tremaine, S., Ostriker, J., & Spitzer, L. 1975, ApJ, 196, 407
- Tully et al. (1988) Tully, R. B. 1988, Nearby Galaxies Catalog (Cambridge: Cambridge Univ. Press)
- van der Marel (2004) van der Marel, R. P. 2004, in Carnegie Observatories Astrophysics Series, Vol. 1: Coevolution of Black Holes and Galaxies, ed. L. C. Ho (Cambridge: Cambridge Univ. Press), 37
- Weisskopf et al. (2004) Weisskopf, M., Wu, K., Tennant, A., Swartz, D., & Ghosh, K. 2004, ApJ, 605, 360
- Wu et al. (2002) Wu, H., Xia, X., Deng, Z., & Mao, S. 2002, ApJ, 576, 738
- Zezas & Fabbiano (2002) Zezas, A. & Fabbiano, G. 2002, ApJ, 577, 726
- Zezas et al. (2002) Zezas, A., Fabbiano, G., Rots, A., & Murray, S. 2002, ApJ, 577, 710
- Zombeck (1990) Zombeck, M. 1990, Handbook of Space Astronomy and Astrophysics (Cambridge: Cambridge Univ. Press)
| Dataset | Galaxy | Filter | Num. of | Exp. | Relative | Shift Method | ULX | X | Y | Chip | |
|---|---|---|---|---|---|---|---|---|---|---|---|
| Exposures | Time | Exp. Times | ID | ||||||||
| (1) | (2) | (3) | (4) | (5) | (6) | (7) | (8) | (9) | (10) | (11) | |
| u6eae601b | NGC 0278 | F450W | 2 | 320 | 1.00,1.00 | 2(7) | 1 | 121.2 | 197.1 | 2 | |
| u6eae603b | NGC 0278 | F606W | 2 | 320 | 1.00,1.00 | 2(8) | 1 | 121.5 | 197.2 | 2 | |
| u6eae605b | NGC 0278 | F814W | 2 | 320 | 1.00,1.00 | 2(8) | 1 | 121.6 | 197.1 | 2 | |
| u6ea1201b | NGC 0891 | F450W | 2 | 460 | 1.00,1.00 | 2(5) | 2 | 199.9 | 350.3 | 4 | |
| u29r0701b | NGC 0891 | F606W | 2 | 160 | 1.00,1.00 | 2(6) | 2 | 319.3 | 159.4 | 2 | |
| u6ea1203b | NGC 0891 | F814W | 2 | 460 | 1.00,1.00 | 2(5) | 2 | 201.5 | 350.4 | 4 | |
| u3030101b | NGC 1068 | F160BW | 2 | 2400 | 1.00,1.00 | 3 | 3 | 141.9 | 192.0 | 4 | |
| 4 | 30.2 | 109.8 | 4 | ||||||||
| u2m3010eb | NGC 1068 | F218W | 2 | 2400 | 0.67,1.33 | 3 | 3 | 97.3 | 50.8 | 4 | |
| 4 | 137.2 | 32.4 | 2 | ||||||||
| u2m3010cb | NGC 1068 | F336W | 2 | 900 | 0.67,1.33 | 3 | 3 | 97.3 | 50.8 | 4 | |
| 4 | 137.2 | 32.4 | 2 | ||||||||
| u2m3010ab | NGC 1068 | F343N | 2 | 1800 | 0.67,1.33 | 3 | 3 | 97.3 | 50.8 | 4 | |
| 4 | 137.2 | 32.4 | 2 | ||||||||
| u2m30108b | NGC 1068 | F375N | 2 | 1800 | 0.67,1.33 | 3 | 3 | 97.3 | 50.8 | 4 | |
| 4 | 137.2 | 32.4 | 2 | ||||||||
| u3030103b | NGC 1068 | F487N | 2 | 3400 | 0.65,1.35 | 3 | 3 | 141.9 | 192.0 | 4 | |
| 4 | 30.2 | 109.8 | 4 | ||||||||
| u2m30104b | NGC 1068 | F502N | 2 | 900 | 0.67,1.33 | 3 | 3 | 97.3 | 50.8 | 4 | |
| 4 | 137.2 | 32.4 | 2 | ||||||||
| u2m30106b | NGC 1068 | F658N | 2 | 900 | 0.67,1.33 | 3 | 3 | 97.3 | 50.8 | 4 | |
| 4 | 137.2 | 32.4 | 2 | ||||||||
| u3030105b | NGC 1068 | F673N | 2 | 1800 | 0.67,1.33 | 3 | 3 | 141.9 | 192.0 | 4 | |
| 4 | 30.2 | 109.8 | 4 | ||||||||
| u2m3010gb | NGC 1068 | F791W | 2 | 440 | 0.64,1.36 | 3 | 3 | 97.3 | 50.8 | 4 | |
| 4 | 137.2 | 32.4 | 2 | ||||||||
| u33z0101b | NGC 1097 | F218W | 2 | 1200 | 1.00,1.00 | 1 | 5 | 689.3 | 507.3 | 3 | |
| u34m0204b | NGC 1399 | F450W | 4 | 5200 | 1.00,1.00 | 1 | 6 | 316.5 | 32.3 | 2 | |
| 7 | 188.1 | 444.2 | 3 | ||||||||
| 8 | 240.0 | 479.3 | 4 | ||||||||
| u5cv0101b | NGC 1399 | F606W | 8 | 4000 | 1.00,1.00 | 1 | 6 | 262.4 | 50.8 | 2 | |
| 7 | 511.5 | 63.1 | 4 | ||||||||
| 8 | 152.7 | 572.4 | 4 | ||||||||
| u34m0201b | NGC 1399 | F814W | 3 | 1800 | 1.00,1.00 | 1 | 6 | 311.6 | 37.2 | 2 | |
| 7 | 193.0 | 449.1 | 3 | ||||||||
| 8 | 244.9 | 474.3 | 4 | ||||||||
| u2bm0401b | NGC 1700 | F555W(1) | 2 | 1000 | 1.00,1.00 | 1 | 9 | 119.5 | 504.6 | 2 | |
| 10 | 298.6 | 436.6 | 1 | ||||||||
| u2bm0403b | NGC 1700 | F814W(1) | 2 | 460 | 1.00,1.00 | 1 | 9 | 119.5 | 504.6 | 2 | |
| 10 | 298.7 | 436.7 | 1 | ||||||||
| u3m73201b | NGC 1700 | F555W(2) | 4 | 1600 | 1.00,1.00 | 1 | 10 | 497.6 | 592.1 | 1 | |
| 11 | 592.1 | 401.3 | 3 | ||||||||
| u3m73206b | NGC 1700 | F814W(2) | 3 | 1800 | 0.33,1.33 | 1 | 10 | 497.6 | 592.5 | 1 | |
| 11 | 592.1 | 401.1 | 3 | ||||||||
| u6fiub02b | NGC 1700 | F606W(1) | 2 | 2500 | 0.80,1.20 | 1 | 11 | 262.9 | 787.1 | 4 | |
| u6fiud02b | NGC 1700 | F606W(2) | 2 | 2500 | 0.80,1.20 | 1 | 11 | 279.8 | 696.7 | 4 | |
| u45t0103b | NGC 3034 | F555W(1) | 4 | 3100 | 0.45,2.06 | 2(2) | 12 | 314.8 | 650.0 | 4 | |
| 13 | 200.7 | 492.3 | 4 | ||||||||
| 14 | 179.3 | 449.9 | 4 | ||||||||
| u3jv0101b | NGC 3034 | F656N | 2 | 1000 | 1.00,1.00 | 2[u45t0103b] | 12 | 331.5 | 69.1 | 2 | |
| 13 | 299.4 | 413.9 | 1 | ||||||||
| 14 | 391.8 | 366.5 | 1 | ||||||||
| u3jv0103b | NGC 3034 | F658N | 2 | 1200 | 1.00,1.00 | 2[u45t0103b] | 12 | 331.3 | 69.8 | 2 | |
| 13 | 298.6 | 413.2 | 1 | ||||||||
| 14 | 391.0 | 365.8 | 1 | ||||||||
| u2s04201b | NGC 3034 | F656N(2) | 2 | 600 | 1.00,1.00 | 2[u45t0103b] | 13 | 527.3 | 326.5 | 1 | |
| 14 | 436.5 | 376.8 | 1 | ||||||||
| u3jv0201b | NGC 3034 | F656N(3) | 2 | 1000 | 1.00,1.00 | 2[u45t0103b] | 13 | 559.3 | 436.5 | 1 | |
| 14 | 482.4 | 506.3 | 1 | ||||||||
| u3jv0203b | NGC 3034 | F658N(4) | 2 | 1200 | 1.00,1.00 | 2[u45t0103b] | 13 | 559.1 | 435.9 | 1 | |
| 14 | 482.2 | 505.6 | 1 | ||||||||
| u3jv0206b | NGC 3034 | F502N(5) | 4 | 3600 | 0.67,1.44 | 2[u45t0103b] | 13 | 559.1 | 435.9 | 1 | |
| 14 | 482.2 | 505.6 | 1 | ||||||||
| u3jv020bb | NGC 3034 | F631N(6) | 2 | 1200 | 1.00,1.00 | 2[u45t0103b] | 13 | 559.0 | 435.5 | 1 | |
| 14 | 482.1 | 505.2 | 1 | ||||||||
| u45t010fb | NGC 3034 | F555W(7) | 4 | 2500 | 0.32,1.60 | 2[u45t0103b] | 13 | 331.2 | 750.7 | 4 | |
| 14 | 309.8 | 708.4 | 4 | ||||||||
| u2bl0303b | NGC 3256 | F450W(2) | 2 | 1800 | 1.00,1.00 | 2[u67q4203b] | 15 | 100.9 | 683.4 | 4 | |
| u67q4101b | NGC 3256 | F555W(1) | 2 | 320 | 1.00,1.00 | 2[u67q4203b] | 15 | 102.8 | 376.1 | 4 | |
| u67q4201b | NGC 3256 | F555W(2) | 2 | 320 | 1.00,1.00 | 2[u67q4203b] | 15 | 113.5 | 437.6 | 4 | |
| u67q4103b | NGC 3256 | F814W(2) | 2 | 320 | 1.00,1.00 | 2[u67q4203b] | 15 | 102.8 | 376.1 | 4 | |
| u67q4203b | NGC 3256 | F814W(3) | 2 | 320 | 1.00,1.00 | 2(21) | 15 | 113.5 | 437.7 | 4 | |
| u2bl0301b | NGC 3256 | F814W(4) | 2 | 1600 | 1.00,1.00 | 2[u67q4203b] | 15 | 99.6 | 684.0 | 4 | |
| u6dw0801b | NGC 3256 | F300W | 2 | 600 | 1.00,1.00 | 2[u67q4203b] | 15 | 160.1 | 468.1 | 3 | |
| 16 | 61.3 | 412.4 | 4 | ||||||||
| u2bl0203b | NGC 3256 | F450W(1) | 2 | 1800 | 1.00,1.00 | 2[u67q4203b] | 15 | 131.7 | 112.5 | 4 | |
| 16 | 47.7 | 745.4 | 4 | ||||||||
| u2bl0201b | NGC 3256 | F814W(1) | 2 | 1600 | 1.00,1.00 | 2[u67q4203b] | 15 | 131.8 | 112.8 | 4 | |
| 16 | 47.8 | 745.6 | 4 | ||||||||
| u3vz0304b | NGC 3311 | F555W | 4 | 3700 | 0.97,1.08 | 2(5) | 17 | 520.7 | 439.0 | 1 | |
| 18 | 516.4 | 374.2 | 1 | ||||||||
| u3vz0306b | NGC 3311 | F814W | 4 | 3800 | 0.95,1.05 | 2(6) | 17 | 521.9 | 440.3 | 1 | |
| 18 | 517.6 | 375.6 | 1 | ||||||||
| u29r1l01b | NGC 3628 | F606W | 2 | 160 | 1.00,1.00 | 2(1) | 19 | 65.2 | 437.1 | 4 | |
| u29r1k01b | NGC 3627 | F606W(1) | 2 | 160 | 1.00,1.00 | 3 | 20 | 654.2 | 623.8 | 3 | |
| u67n3402b | NGC 3627 | F606W(2) | 2 | 560 | 0.57,1.43 | 3 | 20 | 538.2 | 523.4 | 3 | |
| u6a02901b | NGC 3627 | F814W | 2 | 700 | 1.00,1.00 | 3 | 20 | 579.1 | 589.0 | 3 | |
| u304010lb | NGC 4038 | F336W | 4 | 4500 | 0.89,1.07 | 2[u3040205b] | 21 | 236.4 | 153.6 | 1 | |
| 22 | 489.9 | 298.1 | 2 | ||||||||
| 23 | 85.8 | 420.7 | 2 | ||||||||
| 24 | 394.5 | 88.9 | 3 | ||||||||
| 25 | 140.6 | 695.0 | 3 | ||||||||
| 26 | 529.7 | 224.6 | 3 | ||||||||
| 27 | 713.0 | 132.1 | 3 | ||||||||
| u3040205b | NGC 4038 | F555W | 2 | 60 | 1.00,1.00 | 2(2) | 21 | 286.4 | 511.8 | 4 | |
| 22 | 284.0 | 394.6 | 1 | ||||||||
| 23 | 48.9 | 293.7 | 3 | ||||||||
| 24 | 370.3 | 62.2 | 4 | ||||||||
| 26 | 151.1 | 507.9 | 3 | ||||||||
| 27 | 334.5 | 415.4 | 3 | ||||||||
| 28 | 520.7 | 602.1 | 3 | ||||||||
| u3040202b | NGC 4038 | F658N | 4 | 3800 | 0.84,1.16 | 2[u3040205b] | 21 | 268.6 | 162.3 | 1 | |
| 22 | 493.9 | 283.4 | 2 | ||||||||
| 23 | 89.8 | 406.1 | 2 | ||||||||
| 24 | 379.8 | 84.9 | 3 | ||||||||
| 25 | 125.9 | 691.0 | 3 | ||||||||
| 26 | 515.0 | 220.6 | 3 | ||||||||
| 27 | 698.4 | 128.1 | 3 | ||||||||
| u2tv1501b | NGC 4150 | F814W | 2 | 320 | 1.00,1.00 | 2(5) | 29 | 462.3 | 228.8 | 1 | |
| u29r2501b | NGC 4490 | F606W | 2 | 160 | 1.00,1.00 | 2(2) | 30 | 68.0 | 638.5 | 2 | |
| u29r2b01b | NGC 4559 | F606W | 2 | 160 | 1.00,1.00 | 2(4) | 31 | 247.8 | 41.9 | 2 | |
| u31s010cb | NGC 4565 | F450W(1) | 3 | 630 | 0.95,1.10 | 1 | 32 | 425.1 | 121.1 | 4 | |
| u3ji030bb | NGC 4565 | F450W(2) | 2 | 460 | 1.00,1.00 | 1 | 32 | 283.4 | 304.3 | 3 | |
| u3ji0307b | NGC 4565 | F555W | 2 | 320 | 1.00,1.00 | 1 | 32 | 282.7 | 304.4 | 3 | |
| u31s0107b | NGC 4565 | F814W(1) | 3 | 480 | 1.00,1.00 | 1 | 32 | 420.2 | 125.6 | 4 | |
| u3ji0309b | NGC 4565 | F814W(2) | 2 | 320 | 1.00,1.00 | 1 | 32 | 282.4 | 304.4 | 3 | |
| u2uh0601b | NGC 4594 | F658N | 2 | 1600 | 1.00,1.00 | 1 | 33 | 577.4 | 664.1 | 1 | |
| u67n4602b | NGC 4725 | F606W | 2 | 560 | 0.57,1.43 | 1 | 34 | 290.3 | 711.8 | 2 | |
| u29r2p01b | NGC 4945 | F606W | 2 | 160 | 1.00,1.00 | 2(4) | 35 | 457.6 | 361.1 | 2 | |
| u2st0201b | NGC 5018 | F336W | 3 | 1800 | 1.00,1.00 | 1 | 36 | 486.3 | 397.0 | 3 | |
| 37 | 724.7 | 522.5 | 1 | ||||||||
| u3m72505b | NGC 5018 | F555W | 6 | 1200 | 0.50,2.00 | 1 | 36 | 509.6 | 394.5 | 3 | |
| 37 | 679.4 | 521.9 | 1 | ||||||||
| u2kt0302b | NGC 5033 | F218W | 2 | 4500 | 0.93,1.07 | 1 | 38 | 90.0 | 57.0 | 4 | |
| 39 | 140.2 | 93.6 | 4 | ||||||||
| u2kt0303b | NGC 5033 | F300W | 2 | 2000 | 1.00,1.00 | 1 | 38 | 89.0 | 57.6 | 4 | |
| 39 | 139.3 | 94.1 | 4 | ||||||||
| u3lba104b | NGC 5128 | F555W | 3 | 180 | 1.00,1.00 | 3 | 40 | 493.9 | 615.3 | 2 | |
| u3lba101b | NGC 5128 | F814W | 3 | 180 | 1.00,1.00 | 3 | 40 | 493.9 | 615.3 | 2 | |
| u4im0101b | Circinus | F502N | 2 | 1800 | 1.00,1.00 | 1 | 41 | 101.3 | 75.0 | 4 | |
| 42 | 153.0 | 676.5 | 1 | ||||||||
| u4im0104b | Circinus | F656N | 2 | 1600 | 1.00,1.00 | 1 | 41 | 101.4 | 74.1 | 4 | |
| 42 | 151.0 | 676.4 | 1 | ||||||||
| u3320801b | Circinus | F606W | 2 | 600 | 0.67,1.33 | 1 | 42 | 777.0 | 403.5 | 1 | |
| u2ex0i01b | NGC 6500 | F218W | 2 | 2200 | 1.00,1.00 | 1 | 43 | 208.7 | 115.9 | 2 | |
| u2uh1202b | NGC 6500 | F547M | 2 | 276 | 0.12,1.88 | 1 | 43 | 390.4 | 175.2 | 2 | |
| u67gb301b | NGC 7174 | F300W | 2 | 1000 | 1.00,1.00 | 1 | 44 | 526.2 | 172.2 | 1 |
Note. — The table lists basic properties of the HST/WFPC2 data used for our study, selected as described in Section 2.2. Column (1) lists the HST/WFPC2 association name. Column (2) lists the host galaxy name. Column (3) lists the filter with which the data were obtained. When multiple datasets with the same filter are available for a given galaxy, a unique identifier is added in parentheses. Column (4) lists the number of exposures in the WFPC2 association. Column (5) lists the total exposure time. Column (6) indicates the relative exposure times of the different exposures in the association. The first number is the shortest exposure time divided by the average exposure time. The second number is the longest exosure time divided by the average. Column (7) indicates the method by which the astrometry was calibrated, as described in Section 3. Method 1 coordinates were shifted to align the galaxy nucleus with the AGN coordinates in Chandra data; method 2 coordinates were shifted to align observed USNO-B1.0 stars with their catalog coordinates; and method 3 coordinates are obtained from the original HST pipeline headers. When the number is followed by the name of a dataset in square brackets, that means that the image was aligned with the listed dataset for the same galaxy (which itself was aligned using the listed method). For method 2 the number of USNO-B1.0 stars that was identified is listed in parentheses. The relative accuracy of the Chandra/HST alignment for each method is discussed in Section 3. Column (8) lists the ID numbers (from Table 1) of the ULXs that fall on the image. Columns (9)–(11) list the (X,Y) pixel position in WFPC2 detector coordinates and WFPC2 chip number that correspond to the position of the ULX given in Table 1.
| ULX | Galaxy | Src. | Filter | Phot. | mlim | RA | Dec. | Offset | App. | Error | Abs. | S/N | Size |
|---|---|---|---|---|---|---|---|---|---|---|---|---|---|
| ID | No. | Flag | (”) | (”) | (”) | Mag. | Mag. | ”/pc | |||||
| (1) | (2) | (3) | (4) | (5) | (6) | (7) | (8) | (9) | (10) | (11) | (12) | (13) | (14) |
| 1 | NGC 0278 | 1 | F450W | M | 23.98 | 0.20 | 0.71 | 0.74 | 22.31 | 0.10 | -8.05 | 17.8 | 0.2/13.3 |
| F606W | M | 23.55 | 0.25 | 0.68 | 0.73 | 21.56 | 0.07 | -8.80 | 24.7 | 0.2/14.3 | |||
| F814W | M | 23.12 | 0.24 | 0.69 | 0.73 | 20.91 | 0.06 | -9.45 | 30.1 | 0.2/12.2 | |||
| 2 | F450W | M | 23.98 | 1.20 | 0.43 | 1.27 | 22.91 | 0.17 | -7.45 | 10.1 | 0.2/13.0 | ||
| F606W | M | 23.55 | 1.23 | 0.31 | 1.27 | 22.41 | 0.14 | -7.95 | 11.3 | 0.3/16.8 | |||
| F814W | M | 23.12 | 1.24 | 0.31 | 1.28 | 21.65 | 0.11 | -8.71 | 15.1 | 0.2/12.2 | |||
| 3 | F450W | M | 23.98 | -0.60 | 1.17 | 1.32 | 21.62 | 0.06 | -8.74 | 33.9 | 0.2/13.4 | ||
| F606W | M | 23.55 | -0.56 | 1.13 | 1.26 | 21.34 | 0.06 | -9.02 | 30.2 | 0.3/14.5 | |||
| F814W | M | 23.12 | -0.56 | 1.18 | 1.31 | 20.96 | 0.06 | -9.40 | 28.7 | 0.2/14.3 | |||
| 4 | F450W | M | 23.97 | -1.35 | -0.39 | 1.40 | 23.42 | 0.26 | -6.94 | 6.3 | 0.2/10.4 | ||
| F606W | M | 23.55 | -1.33 | -0.43 | 1.40 | 23.43 | 0.36 | -6.93 | 4.4 | 0.2/10.3 | |||
| F814W | M | 23.12 | -1.33 | -0.43 | 1.40 | 23.09 | 0.40 | -7.27 | 3.9 | 0.2/11.2 | |||
| 5 | F450W | M | 23.98 | 0.14 | 1.50 | 1.51 | 22.42 | 0.11 | -7.94 | 16.1 | 0.2/13.1 | ||
| F606W | M | 23.55 | 0.08 | 1.44 | 1.44 | 22.00 | 0.10 | -8.36 | 16.5 | 0.3/18.0 | |||
| F814W | M | 23.12 | 0.03 | 1.39 | 1.39 | 21.47 | 0.10 | -8.89 | 18.0 | 0.2/13.5 | |||
| 6 | F450W | N | 24.20 | ||||||||||
| F606W | M | 23.55 | -1.06 | 0.96 | 1.43 | 22.68 | 0.18 | -7.68 | 8.7 | 0.2/13.7 | |||
| F814W | M | 23.12 | -1.10 | 0.98 | 1.47 | 22.03 | 0.15 | -8.33 | 10.6 | 0.1/8.5 | |||
| 2 | NGC 0891 | 1 | F450W | M | 24.88 | -1.76 | -0.47 | 1.82 | 22.99 | 0.10 | -6.92 | 19.8 | 0.2/10.1 |
| F606W | M | 24.26 | -1.55 | -0.59 | 1.65 | 23.16 | 0.16 | -6.75 | 11.0 | 0.2/7.3 | |||
| F814W | N | 23.03 | |||||||||||
| 3 | NGC 1068 | F336W | C | ||||||||||
| F791W | C | ||||||||||||
| F673N | C | ||||||||||||
| F336W | C | ||||||||||||
| F487N | C | ||||||||||||
| F658N | C | ||||||||||||
| F160BW | C | ||||||||||||
| F218W | X | ||||||||||||
| F343N | X | ||||||||||||
| F375N | X | ||||||||||||
| F502N | X | ||||||||||||
| 4 | NGC 1068 | F218W | X | ||||||||||
| F336W | C | ||||||||||||
| F343N | X | ||||||||||||
| F375N | X | ||||||||||||
| F502N | X | ||||||||||||
| 5 | NGC 1097 | F218W | N | 20.67 | |||||||||
| 6 | NGC 1399 | F450W | N | 25.79 | |||||||||
| F606W | N | 25.20 | |||||||||||
| F814W | N | 24.28 | |||||||||||
| 7 | NGC 1399 | 1 | F450W | S | 26.74 | 0.16 | -0.12 | 0.20 | 22.83 | 0.03 | -8.60 | 142.5 | 0.2/15.6 |
| F606W | S | 27.04 | 0.16 | 0.01 | 0.16 | 22.30 | 0.02 | -9.13 | 312.5 | 0.2/17.8 | |||
| F814W | S | 25.35 | 0.16 | -0.13 | 0.21 | 21.18 | 0.02 | -10.25 | 182.1 | 0.2/15.9 | |||
| 8 | NGC 1399 | 1 | F450W | S | 26.67 | 0.07 | -0.14 | 0.16 | 22.43 | 0.02 | -9.00 | 194.2 | 0.2/14.7 |
| F606W | S | 26.61 | 0.12 | -0.12 | 0.17 | 21.52 | 0.01 | -9.91 | 424.7 | 0.2/21.9 | |||
| F814W | S | 25.07 | 0.08 | -0.15 | 0.17 | 20.56 | 0.02 | -10.87 | 252.5 | 0.2/17.2 | |||
| 9 | NGC 1700 | 1 | F555W(1) | S | 25.84 | 0.10 | -0.11 | 0.15 | 22.07 | 0.02 | -11.52 | 127.1 | 0.2/40.0 |
| F814W(1) | S | 24.19 | 0.11 | -0.11 | 0.16 | 19.04 | 0.01 | -14.55 | 451.5 | 0.2/43.8 | |||
| 10 | NGC 1700 | F555W(1) | N | 24.92 | |||||||||
| F555W(2) | N | 25.41 | |||||||||||
| F814W(1) | N | 23.21 | |||||||||||
| F814W(2) | N | 24.00 | |||||||||||
| 11 | NGC 1700 | 1 | F555W(2) | S | 26.64 | 0.12 | -0.18 | 0.22 | 23.85 | 0.07 | -9.74 | 45.4 | 0.2/62.0 |
| F606W(1) | S | 26.91 | -0.05 | -0.24 | 0.25 | 23.31 | 0.03 | -10.28 | 96.7 | 0.2/54.9 | |||
| F606W(2) | S | 27.15 | 0.04 | -0.23 | 0.23 | 23.35 | 0.03 | -10.24 | 117.2 | 0.2/45.6 | |||
| F814W(2) | S | 25.72 | 0.13 | -0.20 | 0.23 | 22.05 | 0.04 | -11.54 | 108.1 | 0.2/60.5 | |||
| 12 | NGC 3034 | F555W(1) | C | ||||||||||
| F656N | C | ||||||||||||
| F658N | C | ||||||||||||
| 13 | NGC 3034 | F502N(5) | C | ||||||||||
| F555W(1) | C | ||||||||||||
| F555W(7) | C | ||||||||||||
| F631N(6) | C | ||||||||||||
| F656N | C | ||||||||||||
| F656N(2) | C | ||||||||||||
| F656N(3) | C | ||||||||||||
| F658N | C | ||||||||||||
| F658N(4) | C | ||||||||||||
| 14 | NGC 3034 | F502N(5) | C | ||||||||||
| F555W(1) | C | ||||||||||||
| F555W(7) | C | ||||||||||||
| F631N(6) | C | ||||||||||||
| F656N | C | ||||||||||||
| F656N(2) | C | ||||||||||||
| F656N(3) | C | ||||||||||||
| F658N | C | ||||||||||||
| F658N(4) | C | ||||||||||||
| 15 | NGC 3256 | 1 | F450W(1) | M | 25.92 | -0.09 | -0.00 | 0.09 | 24.99 | 0.18 | -7.86 | 9.4 | 0.3/46.3 |
| F450W(2) | M | 25.95 | 0.16 | -0.15 | 0.22 | 25.50 | 0.28 | -7.35 | 5.9 | 0.2/44.6 | |||
| F555W(1) | M | 25.21 | -0.00 | 0.03 | 0.03 | 24.62 | 0.31 | -8.23 | 5.5 | 0.3/46.5 | |||
| F814W(1) | M | 24.93 | -0.16 | 0.10 | 0.19 | 24.20 | 0.21 | -8.65 | 7.9 | 0.2/27.8 | |||
| 2 | F300W | N | 23.11 | ||||||||||
| F555W(2) | N | 24.88 | |||||||||||
| F814W(1) | M | 24.93 | 0.42 | 0.13 | 0.44 | 23.95 | 0.17 | -8.90 | 9.9 | 0.2/30.6 | |||
| F814W(2) | N | 24.15 | |||||||||||
| F814W(3) | N | 24.08 | |||||||||||
| F814W(4) | N | 24.69 | |||||||||||
| 16 | NGC 3256 | 2 | F300W | N | 23.07 | ||||||||
| F450W(1) | N | 25.53 | |||||||||||
| F814W(1) | M | 25.37 | -0.30 | 1.37 | 1.41 | 24.50 | 0.20 | -8.35 | 8.5 | 0.2/42.4 | |||
| 17 | NGC 3311 | 1 | F555W | N | 26.30 | ||||||||
| F814W | M | 25.16 | 0.89 | 0.07 | 0.90 | 23.85 | 0.13 | -9.67 | 13.0 | 0.5/116.0 | |||
| 2 | F555W | M | 26.48 | 0.44 | -0.11 | 0.45 | 24.80 | 0.10 | -8.72 | 18.2 | 0.2/49.4 | ||
| 3 | F555W | M | 26.48 | 0.38 | -1.18 | 1.24 | 25.07 | 0.12 | -8.45 | 14.2 | 0.1/31.7 | ||
| F814W | M | 25.17 | 0.47 | -1.23 | 1.31 | 23.95 | 0.14 | -9.57 | 11.9 | 0.5/115.3 | |||
| 4 | F555W | M | 26.48 | 0.84 | -1.14 | 1.41 | 25.09 | 0.12 | -8.43 | 13.9 | 0.1/25.0 | ||
| F814W | N | 25.01 | |||||||||||
| 18 | NGC 3311 | 1 | F555W | M | 26.48 | -0.35 | 0.73 | 0.81 | 25.68 | 0.20 | -7.84 | 8.0 | 0.2/39.2 |
| F814W | N | 25.02 | |||||||||||
| 2 | F555W | M | 26.28 | -0.38 | -1.17 | 1.23 | 24.21 | 0.07 | -9.31 | 26.3 | 0.2/39.6 | ||
| F814W | M | 24.78 | -0.32 | -1.18 | 1.23 | 23.11 | 0.09 | -10.41 | 18.2 | 0.2/51.8 | |||
| 19 | NGC 3628 | 1 | F606W | M | 24.81 | -0.35 | 0.29 | 0.45 | 23.68 | 0.18 | -5.75 | 10.5 | 0.2/6.5 |
| 20 | NGC 3627 | 1 | F606W(1) | N | 24.91 | ||||||||
| F606W(2) | M | 25.36 | -3.05 | 0.72 | 3.13 | 23.55 | 0.10 | -5.55 | 17.6 | 0.3/9.5 | |||
| F814W | N | 24.66 | |||||||||||
| 21 | NGC 4038 | 1 | F336W | M | 24.69 | -0.19 | -0.22 | 0.29 | 22.15 | 0.06 | -9.53 | 40.0 | 0.2/17.7 |
| F555W | N | 21.81 | |||||||||||
| F658N | M | 23.34 | 0.14 | -0.11 | 0.18 | 19.54 | 0.03 | -12.14 | 129.0 | 0.3/29.4 | |||
| 2 | F336W | M | 24.69 | -0.49 | 0.31 | 0.58 | 19.86 | 0.02 | -11.82 | 335.9 | 0.3/32.6 | ||
| F555W | M | 23.93 | -0.28 | 0.23 | 0.36 | 20.37 | 0.05 | -11.31 | 96.0 | 0.2/24.8 | |||
| F658N | M | 23.34 | -0.17 | 0.53 | 0.55 | 19.69 | 0.04 | -11.99 | 111.4 | 0.2/24.8 | |||
| 3 | F336W | M | 24.69 | 1.11 | 0.94 | 1.46 | 21.22 | 0.04 | -10.46 | 95.1 | 0.3/35.1 | ||
| F555W | M | 23.92 | 1.28 | 0.84 | 1.53 | 21.30 | 0.08 | -10.38 | 39.3 | 0.3/29.5 | |||
| F658N | M | 23.34 | 0.85 | 0.94 | 1.26 | 19.64 | 0.04 | -12.04 | 116.6 | 0.5/55.1 | |||
| 4 | F336W | M | 24.69 | -0.59 | 0.15 | 0.61 | 20.78 | 0.03 | -10.90 | 142.7 | 0.3/32.6 | ||
| F555W | N | 21.81 | |||||||||||
| 22 | NGC 4038 | 1 | F336W | M | 24.03 | -0.16 | -0.31 | 0.35 | 23.39 | 0.25 | -8.29 | 6.8 | 0.2/15.8 |
| F555W | N | 23.66 | |||||||||||
| 2 | F336W | M | 24.03 | -0.26 | 0.22 | 0.34 | 23.60 | 0.30 | -8.08 | 5.5 | 0.2/18.9 | ||
| F555W | N | 23.66 | |||||||||||
| 3 | F336W | M | 24.03 | 0.89 | -0.14 | 0.90 | 23.72 | 0.34 | -7.96 | 5.0 | 0.2/21.0 | ||
| F555W | N | 23.66 | |||||||||||
| 4 | F336W | M | 24.03 | 0.96 | 0.78 | 1.24 | 23.44 | 0.26 | -8.24 | 6.5 | 0.2/21.0 | ||
| F555W | N | 23.66 | |||||||||||
| 5 | F336W | M | 24.03 | 0.67 | -1.32 | 1.48 | 23.81 | 0.36 | -7.87 | 4.5 | 0.2/17.9 | ||
| F555W | N | 23.66 | |||||||||||
| 6 | F555W | N | 23.66 | ||||||||||
| F658N | M | 23.35 | -0.52 | 0.40 | 0.65 | 21.84 | 0.15 | -9.84 | 15.0 | 0.2/22.3 | |||
| 23 | NGC 4038 | 1 | F336W | M | 24.43 | 1.19 | -0.77 | 1.42 | 21.49 | 0.05 | -10.19 | 57.4 | 0.2/18.9 |
| F555W | N | 23.51 | |||||||||||
| F658N | N | 22.77 | |||||||||||
| 24 | NGC 4038 | 1 | F336W | M | 24.35 | 0.84 | 1.12 | 1.40 | 18.88 | 0.01 | -12.80 | 611.6 | 0.2/26.2 |
| F555W | C | ||||||||||||
| 2 | F658N | M | 22.44 | 1.04 | 0.25 | 1.07 | 20.15 | 0.07 | -11.53 | 32.7 | 0.3/27.5 | ||
| 25 | NGC 4038 | 1 | F336W | M | 24.67 | -0.39 | 0.17 | 0.43 | 20.58 | 0.04 | -11.10 | 157.0 | 0.3/27.4 |
| F658N | M | 23.28 | -0.07 | 0.46 | 0.47 | 20.42 | 0.07 | -11.26 | 49.2 | 0.2/24.4 | |||
| 26 | NGC 4038 | F336W | C | ||||||||||
| F555W | C | ||||||||||||
| F658N | C | ||||||||||||
| 27 | NGC 4038 | F336W | N | 24.62 | |||||||||
| F555W | N | 23.47 | |||||||||||
| F658N | N | 23.44 | |||||||||||
| 28 | NGC 4038 | F555W | N | 23.47 | |||||||||
| 29 | NGC 4150 | F814W | N | 23.85 | |||||||||
| 30 | NGC 4490 | 1 | F606W | M | 24.44 | -0.57 | -1.00 | 1.15 | 24.15 | 0.34 | -5.31 | 4.9 | 0.2/9.5 |
| 2 | F606W | M | 24.44 | 0.98 | -0.12 | 0.99 | 23.08 | 0.14 | -6.38 | 13.4 | 0.2/8.2 | ||
| 3 | F606W | M | 24.44 | 0.56 | -1.11 | 1.24 | 23.52 | 0.20 | -5.94 | 8.9 | 0.2/7.0 | ||
| 4 | F606W | M | 24.44 | 0.02 | -1.50 | 1.50 | 23.76 | 0.24 | -5.70 | 7.1 | 0.2/5.7 | ||
| 5 | F606W | M | 24.44 | -0.23 | 1.28 | 1.30 | 23.54 | 0.20 | -5.92 | 8.7 | 0.2/6.3 | ||
| 6 | F606W | M | 24.44 | 1.11 | -1.30 | 1.71 | 21.40 | 0.04 | -8.06 | 64.3 | 0.2/7.3 | ||
| 31 | NGC 4559 | 1 | F606W | M | 24.50 | -0.62 | 0.19 | 0.65 | 24.39 | 0.37 | -5.54 | 4.4 | 0.2/8.6 |
| 2 | F606W | M | 24.51 | 0.88 | -0.64 | 1.09 | 23.69 | 0.21 | -6.24 | 8.4 | 0.2/10.2 | ||
| 32 | NGC 4565 | 1 | F450W(1) | S | 25.64 | 0.20 | 0.12 | 0.23 | 23.81 | 0.12 | -7.26 | 20.7 | 0.2/18.3 |
| F450W(2) | N | 25.22 | |||||||||||
| F555W | N | 25.22 | |||||||||||
| F814W(1) | S | 24.78 | 0.19 | 0.13 | 0.23 | 22.55 | 0.09 | -8.52 | 30.7 | 0.2/18.2 | |||
| F814W(2) | N | 24.25 | |||||||||||
| 33 | NGC 4594 | 1 | F658N | S | 22.07 | 0.53 | 0.29 | 0.60 | 19.09 | 0.04 | -11.72 | 58.7 | 0.3/18.0 |
| 34 | NGC 4725 | 1 | F606W | M | 25.41 | 0.15 | -0.59 | 0.61 | 22.08 | 0.03 | -8.95 | 76.2 | 0.2/16.9 |
| 35 | NGC 4945 | F606W | N | 24.17 | |||||||||
| 36 | NGC 5018 | F336W | N | 23.30 | |||||||||
| F555W | N | 26.42 | |||||||||||
| 37 | NGC 5018 | 1 | F336W | M | 23.77 | 0.01 | -0.05 | 0.05 | 22.00 | 0.11 | -10.86 | 17.9 | 0.2/35.1 |
| F555W | M | 25.67 | -0.05 | -0.02 | 0.05 | 23.58 | 0.09 | -9.28 | 22.8 | 0.2/33.1 | |||
| 38 | NGC 5033 | 1 | F218W | N | 21.86 | ||||||||
| F300W | S | 24.18 | -0.22 | -0.07 | 0.24 | 23.91 | 0.34 | -7.45 | 5.1 | 0.2/18.3 | |||
| 39 | NGC 5033 | 1 | F300W | S | 24.19 | -0.23 | 0.07 | 0.24 | 21.91 | 0.08 | -9.45 | 32.5 | 0.2/19.5 |
| 2 | F218W | S | 22.06 | 0.17 | -0.19 | 0.26 | 20.65 | 0.14 | -10.71 | 14.4 | 0.2/17.2 | ||
| 40 | NGC 5128 | 1 | F555W | S | 24.40 | -0.15 | -0.87 | 0.88 | 22.89 | 0.18 | -5.56 | 11.0 | 0.3/6.4 |
| F814W | S | 23.26 | -0.16 | -0.85 | 0.87 | 21.99 | 0.21 | -6.46 | 8.7 | 0.2/5.7 | |||
| 2 | F555W | N | 24.32 | ||||||||||
| F814W | M | 23.26 | 0.73 | -1.04 | 1.27 | 22.28 | 0.27 | -6.17 | 6.5 | 0.2/5.0 | |||
| 41 | Circinus | 1 | F502N | M | 22.67 | 0.50 | 0.17 | 0.53 | 20.70 | 0.10 | -7.14 | 23.5 | 0.2/3.5 |
| F656N | M | 21.92 | 0.42 | 0.25 | 0.49 | 17.93 | 0.03 | -9.91 | 154.5 | 0.2/3.2 | |||
| 42 | Circinus | F502N | N | 22.30 | |||||||||
| F606W | N | 24.97 | |||||||||||
| F656N | N | 21.67 | |||||||||||
| 43 | NGC 6500 | F218W | N | 21.53 | |||||||||
| F547M | X | ||||||||||||
| 44 | NGC 7174 | 1 | F300W | M | 23.28 | 0.39 | 0.14 | 0.42 | 22.54 | 0.25 | -10.30 | 6.6 | 0.2/42.7 |
Note. — Column (1) lists the ULX ID number from Table 1. Column (2) lists the host galaxy name. Column (3) lists a running ID number of the optical sources spatially coincident with the ULX given in column (1). These optical source ID numbers are also used to label the sources in Figure 2. Column (4) lists the filter used for the HST observation, as in Table 2; the corresponding HST dataset name can be obtained from that table. Column (5) indicates the optical morphology of the region surrounding the ULX, as defined in Section 5. Column (6) lists the limit for source detection determined as described in Section 5. Columns (7) and (8) lists the offset in RA and Dec. of the optical sources to the ULX in arcseconds. Column (9) lists the total offset of the optical sources to the ULX in arcseconds. Column (10) lists the apparent magnitude of the optical source in the VEGAMAG system. Column (11) lists the formal error in the apparent magnitude. Column (12) lists the absolute magnitude of source, calculated using the galaxy distance in Table 1. Column (13) lists the level of the optical source detection.Column (14) lists an estimate of the source extent in arcseconds and pc assuming the distances listed in Table 1 (in most cases the sources are unresolved in which case this estimate is intended to give an upper-limit to the physical source size).
| ULX | Galaxy | T-type | Src. | Color | Value |
|---|---|---|---|---|---|
| ID | RC3 | No. | |||
| (1) | (2) | (3) | (4) | (5) | (6) |
| 1 | n0278 | 3.0 | 1 | B - V606 | |
| 1 | n0278 | 3.0 | 1 | B - I | |
| 1 | n0278 | 3.0 | 1 | V606 - I | |
| 1 | n0278 | 3.0 | 2 | B - V606 | |
| 1 | n0278 | 3.0 | 2 | B - I | |
| 1 | n0278 | 3.0 | 2 | V606 - I | |
| 1 | n0278 | 3.0 | 3 | B - V606 | |
| 1 | n0278 | 3.0 | 3 | B - I | |
| 1 | n0278 | 3.0 | 3 | V606 - I | |
| 1 | n0278 | 3.0 | 4 | B - V606 | |
| 1 | n0278 | 3.0 | 4 | B - I | |
| 1 | n0278 | 3.0 | 4 | V606 - I | |
| 1 | n0278 | 3.0 | 5 | B - V606 | |
| 1 | n0278 | 3.0 | 5 | B - I | |
| 1 | n0278 | 3.0 | 5 | V606 - I | |
| 1 | n0278 | 3.0 | 6 | V606 - I | |
| 1 | n0278 | 3.0 | 6 | B - V606 | |
| 1 | n0278 | 3.0 | 6 | B - I | |
| 2 | n0891 | 3.0 | 1 | V606 - I | |
| 2 | n0891 | 3.0 | 1 | B - V606 | |
| 2 | n0891 | 3.0 | 1 | B - I | |
| 7 | n1399 | -5.0 | 1 | B - I | |
| 7 | n1399 | -5.0 | 1 | B - V606 | |
| 7 | n1399 | -5.0 | 1 | V606 - I | |
| 8 | n1399 | -5.0 | 1 | B - I | |
| 8 | n1399 | -5.0 | 1 | B - V606 | |
| 8 | n1399 | -5.0 | 1 | V606 - I | |
| 9 | n1700 | -5.0 | 1 | V555 - I | |
| 11 | n1700 | -5.0 | 1 | V555 - I | |
| 11 | n1700 | -5.0 | 1 | V555 - V606 | |
| 11 | n1700 | -5.0 | 1 | V606 - I | |
| 15 | n3256 | 99.0 | 1 | B - I | |
| 15 | n3256 | 99.0 | 1 | B - V555 | |
| 15 | n3256 | 99.0 | 1 | V555 - I | |
| 16 | n3256 | 99.0 | 2 | B - I | |
| 17 | n3311 | -4.0 | 1 | V555 - I | |
| 17 | n3311 | -4.0 | 3 | V555 - I | |
| 17 | n3311 | -4.0 | 4 | V555 - I | |
| 18 | n3311 | -4.0 | 1 | V555 - I | |
| 18 | n3311 | -4.0 | 2 | V555 - I | |
| 21 | n4038/9 | 9.0 | 1 | U - V555 | |
| 21 | n4038/9 | 9.0 | 2 | U - V555 | |
| 21 | n4038/9 | 9.0 | 3 | U - V555 | |
| 21 | n4038/9 | 9.0 | 4 | U - V555 | |
| 22 | n4038/9 | 9.0 | 1 | U - V555 | |
| 22 | n4038/9 | 9.0 | 2 | U - V555 | |
| 22 | n4038/9 | 9.0 | 3 | U - V555 | |
| 22 | n4038/9 | 9.0 | 4 | U - V555 | |
| 22 | n4038/9 | 9.0 | 5 | U - V555 | |
| 23 | n4038/9 | 9.0 | 1 | U - V555 | |
| 32 | n4565 | 3.0 | 1 | V555 - I | |
| 32 | n4565 | 3.0 | 1 | B - I | |
| 32 | n4565 | 3.0 | 1 | B - V555 | |
| 37 | n5018 | -5.0 | 1 | U - V555 | |
| 40 | n5128 | -2.0 | 1 | V555 - I | |
| 40 | n5128 | -2.0 | 2 | V555 - I |
Note. — Column (1) lists the ULX ID number from Table 1. Column (2) lists the host galaxy name. Column (3) lists the galaxy morphology T-type from the Third Reference Catalog of Bright Galaxies (RC3, de Vaucouleurs et al. 1991). Column (4) lists the id number of the source from Table 3. Column (5) lists the color being computed, with the filters designations U, B, V555, V606 and I refer to HST WFPC2 filters F336W, F450W, F555W, F606W and F814W. Column (6) lists the color or color limit.
| ULX | Src. | |||||
|---|---|---|---|---|---|---|
| ID | No. | |||||
| (1) | (2) | (3) | (4) | (5) | (6) | (7) |
| 1 | 1 | 5.4(B) , 5.4(V) , 5.4(I) | 21.9 | -8.5 | 5.3 | 0.5 |
| 1 | 2 | 5.1(B) , 5.1(V) , 5.1(I) | 22.7 | -7.6 | 5.0 | 0.9 |
| 1 | 3 | 5.7(B) , 5.5(V) , 5.4(I) | 21.3 | -9.0 | 5.5 | 0.3 |
| 1 | 4 | 4.9(B) , 4.7(V) , 4.5(I) | 23.4 | -6.9 | 4.7 | 1.2 |
| 1 | 5 | 5.3(B) , 5.3(V) , 5.2(I) | 22.0 | -8.4 | 5.3 | 0.6 |
| 1 | 6 | 5.0(V) , 4.9(I) , 4.6 (B) | 23.0 | -7.4 | 4.9 | 1.0 |
| 2 | 1 | 4.6(V) , 4.9(B) , 4.4 (I) | 23.2 | -6.8 | 4.6 | 1.2 |
| 6 | 1 | 4.5 (I) , 4.4 (B) , 4.4 (V) | 25.9 | -5.5 | 4.1 | 1.4 |
| 7 | 1 | 5.7(I) , 5.6(B) , 5.6(V) | 22.6 | -8.8 | 5.5 | 0.2 |
| 8 | 1 | 6.0(I) , 5.8(B) , 5.9(V) | 21.8 | -9.6 | 5.8 | -0.0 |
| 9 | 1 | 6.5(V) , 7.4(I) | 22.1 | -11.5 | 6.5 | -0.6 |
| 10 | 1 | 5.2 (V) , 5.4 (I) , 5.4 (V) , 5.8 (I) | 25.4 | -8.1 | 5.2 | 0.8 |
| 11 | 1 | 5.8(V) , 6.2(I) , 6.0(V) , 6.0(V) | 23.6 | -10.0 | 5.9 | 0.4 |
| 15 | 1 | 5.3(B) , 5.1(I) , 5.1(B) , 5.2(V) | 24.6 | -8.2 | 5.2 | 0.4 |
| 15 | 2 | 5.2(I) , 4.9 (I) , 5.1 (I) , 5.1 (V) , 5.1 (I) | 24.1 | -8.8 | 5.4 | 0.2 |
| 16 | 1 | 5.1 (B) , 4.9 (I) | 25.6 | -7.2 | 4.8 | 1.1 |
| 16 | 2 | 5.0(I) , 5.1 (B) | 25.1 | -7.7 | 5.0 | 0.9 |
| 17 | 1 | 5.5(I) , 4.8 (V) | 24.5 | -9.0 | 5.5 | 0.7 |
| 17 | 2 | 5.4(V) | 24.8 | -8.7 | 5.4 | 0.8 |
| 17 | 3 | 5.3(V) , 5.4(I) | 25.1 | -8.4 | 5.3 | 0.9 |
| 17 | 4 | 5.3(V) , 5.0 (I) | 25.1 | -8.4 | 5.3 | 0.9 |
| 18 | 1 | 5.1(V) , 5.0 (I) | 25.7 | -7.8 | 5.1 | 1.5 |
| 18 | 2 | 5.6(V) , 5.8(I) | 24.2 | -9.3 | 5.6 | 0.9 |
| 19 | 1 | 4.2(V) | 23.7 | -5.8 | 4.2 | 1.6 |
| 20 | 1 | 4.1(V) , 3.6 (V) , 3.4 (I) | 23.6 | -5.5 | 4.1 | 1.5 |
| 21 | 1 | 6.0(U) , 5.9 (V) | 22.2 | -9.4 | 5.7 | 0.1 |
| 21 | 2 | 6.9(U) , 6.4(V) | 20.4 | -11.3 | 6.4 | -0.6 |
| 21 | 3 | 6.4(U) , 6.1(V) | 21.3 | -10.4 | 6.1 | -0.2 |
| 21 | 4 | 6.6(U) , 5.9 (V) | 20.9 | -10.8 | 6.2 | -0.4 |
| 22 | 1 | 5.5(U) , 5.1 (V) | 23.5 | -8.2 | 5.2 | 1.1 |
| 22 | 2 | 5.4(U) , 5.1 (V) | 23.7 | -8.0 | 5.1 | 1.2 |
| 22 | 3 | 5.4(U) , 5.1 (V) | 23.8 | -7.9 | 5.1 | 1.2 |
| 22 | 4 | 5.5(U) , 5.1 (V) | 23.5 | -8.2 | 5.2 | 1.1 |
| 22 | 5 | 5.4(U) , 5.1 (V) | 23.9 | -7.8 | 5.0 | 1.2 |
| 22 | 6 | 5.1 (V) | 23.7 | -8.0 | 5.1 | 1.2 |
| 23 | 1 | 6.3(U) , 5.2 (V) | 21.6 | -10.1 | 6.0 | -0.4 |
| 24 | 1 | 7.3(U) | 19.0 | -12.7 | 7.0 | -1.5 |
| 25 | 1 | 6.6(U) | 20.7 | -11.0 | 6.3 | -0.3 |
| 27 | 1 | 5.0 (U) , 5.2 (V) | 24.7 | -7.0 | 4.7 | 1.4 |
| 28 | 1 | 5.2 (V) | 23.5 | -8.2 | 5.2 | 0.3 |
| 29 | 1 | 4.0 (I) | 24.0 | -6.0 | 4.3 | 1.3 |
| 30 | 1 | 4.0(V) | 24.1 | -5.3 | 4.0 | 1.5 |
| 30 | 2 | 4.5(V) | 23.1 | -6.4 | 4.5 | 1.1 |
| 30 | 3 | 4.3(V) | 23.5 | -5.9 | 4.3 | 1.3 |
| 30 | 4 | 4.2(V) | 23.8 | -5.7 | 4.2 | 1.4 |
| 30 | 5 | 4.3(V) | 23.5 | -5.9 | 4.3 | 1.3 |
| 30 | 6 | 5.1(V) | 21.4 | -8.1 | 5.1 | 0.4 |
| 31 | 1 | 4.1(V) | 24.4 | -5.5 | 4.1 | 1.9 |
| 31 | 2 | 4.4(V) | 23.7 | -6.2 | 4.4 | 1.6 |
| 32 | 1 | 5.0(I) , 5.1(B) , 4.3 (V) , 4.3 (I) , 4.5 (B) | 23.3 | -7.7 | 5.0 | 1.5 |
| 34 | 1 | 5.5(V) | 22.4 | -8.7 | 5.4 | 0.4 |
| 35 | 1 | 3.7 (V) | 24.2 | -4.4 | 3.7 | 1.9 |
| 36 | 1 | 6.0 (U) , 4.5 (V) | 26.5 | -6.4 | 4.5 | 1.8 |
| 37 | 1 | 6.5(U) , 5.6(V) | 23.6 | -9.3 | 5.6 | 0.3 |
| 40 | 1 | 4.2(I) , 4.1(V) | 22.9 | -5.6 | 4.1 | 1.4 |
| 40 | 2 | 4.1(I) , 3.6 (V) | 22.9 | -5.5 | 4.1 | 1.4 |
| 42 | 1 | 3.1 (V) | 25.0 | -2.9 | 3.1 | 3.0 |
Note. — Column (1) lists the ULX ID number from Table 1. Column (2) lists ID number of the optical source from Table 3. Column (3) lists the optical luminosity computed for the band(s) in which photometric data was available. Column (4) lists , the effective V band magnitude computed based on the observed or assumed color of the source. Column (5) lists the absolute magnitude computed using and the distance listed in Table t:sample. Column (6) lists , the optical luminosity of the source based on the estimate, in solar luminosities. Column (7) lists the ratio of X-ray to optical luminosity.