Discovery of new Milky Way star cluster candidates in the 2 MASS point source catalog V. Follow-up observations of the young stellar cluster candidates RCW 87, [BDSB2003] 164 and [DBSB2003] 172. ††thanks: Based on observations collected with the 6.5m Magellan Baade telescope, Las Campanas Observatory and NTT, ESO, La Silla.
Abstract
Context. Massive clusters are more often found in actively star forming galaxies than in quiescent ones, similar to the Milky Way.
Aims. We have carried out an extensive survey of obscured Milky Way clusters to determine whether our Galaxy is still forming such objects.
Methods. Near-infrared spectral classification of some probable cluster members was used to derive the distances to the cluster candidates. Isochrone analysis of deep near-infrared color-magnitude diagrams allowed us to obtain age and mass estimates.
Results. We report the physical parameters of three cluster candidates:
RCW 87 is 25 Myr old, located at a distance of D7.6 Kpc in the general direction of the Galactic center. Adding the mass of the suspected cluster members we obtain an estimated total cluster mass of 10300. The mid-infrared photometry indicates that some next-generation star formation is on-going in the associated H II region, probably triggered by supernovae or stellar wind from the older stars in RCW 87.
The brightest member of [BDSB2003] 164 is an O5 V type star, based on our spectroscopy. This limits the cluster age to less than a few million years. The estimated total mass is 1760 and the distance is D3.2 Kpc.
[DBSB2003] 172 lacks central concentration and most likely this is not a cluster but an extended star forming region.
Conclusions. The high mass of RCW 87 – if confirmed – puts this object in line with Arches and Quintuplet, among the most young massive clusters in the Galaxy. Further study is necessary to confirm this important result.
Key Words.:
Galaxy: open clusters and associations: general– Infrared: general1 Introduction
Recent all-sky near-infrared (IR) surveys (2 MASS, Skrutskie et al. 1997; DENIS, Epchtein et al. 1997; GLIMPSE, Benjamin et al. 2003) made it possible to carry out uniform census of highly obscured Milky Way clusters. However, as a rule, the determination of the physical parameters of these objects requires better-quality data than the ones the surveys can offer. This motivated us to carry out follow up observations to derive the cluster parameters. Our target list was selected from the 2 MASS Point Source Catalog (Ivanov et al. 2002, Borissova et al. 2003) and from the cluster candidate catalogues of Bica et al. (2003a,b) and Dutra et al. (2003). The detailed studies of about two dozen objects are reported in Borissova et al. (2005) and Ivanov et al. (2005). They all are young (typically 7-10 Myr) and significantly smaller (5000 M⊙) than the Galactic globular clusters and than the most massive young clusters known (Arches & Quintuplet), indicating that the formation of massive young clusters is not a common event in the present-day Milky Way.
In this paper we report high angular resolution deep near-IR imaging and spectroscopy of three more star cluster candidates. The next section describes the data and the third section discusses the confirmed clusters in detail. The last section is a summary of the results.
2 Observations and data reduction
The imaging observations were carried out with the PANIC (Persson’s Auxiliary Nasmyth Infrared Camera) near-IR imager on the 6.5-meter Baade telescope at the Las Campanas Observatory. The instrument uses a 10241024 HgCdTe Hawaii detector array. The scale is 0.125 arcsec , giving a total field of view of 2.12.1 arcmin. The observing log is given in Table 1. The observing strategy is described in Borissova et al. (2005).
| ID | R.A. | Dec. | l | b | Filter | Exposure | Date |
|---|---|---|---|---|---|---|---|
| (J2000.0) | Observ. | ||||||
| RCW 87 | 15 05 20.0 | 57 31 15 | 320.15 | 0.79 | 300 | 25.06.2004 | |
| DBSB2003 172 | 16 41 10.0 | 47 07 27 | 337.92 | 0.47 | 300 | 25.06.2004 | |
| BDSB2003 164 | 17 25 32.0 | 36 21 58 | 351.47 | 0.46 | 300 | 25.06.2004 | |
The stellar photometry of the final images was carried out with ALLSTAR in DAOPHOT II (Stetson ste93 (1993)). We considered only stars with DAOPHOT errors less than 0.2 mag. The median averaged internal photometric errors are for the , , stars brighter than 17 mag and for the fainter ones. We added to the errors in quadrature an extra observational uncertainty of 0.03 mag due to the sky background variations. We replaced the brightest stars (usually with 12 mag), that were saturated on our images, with the 2 MASS measurements.
The weather conditions were nonphotometric (typical seeing 1-1.2 arcsec) during all our observing runs, forcing us to calibrate the data by comparing our instrumental magnitudes with the 2 MASS magnitudes of 10-25 stars per image, depending on the field crowding and the band. The standard error values for the coefficients are less than 0.03 for the zero-point and less than 0.02 for the colour term. Our conservative estimate of the total external errors of our photometry is 0.04-0.05 mag.
3 [BDB2003] 0320.15+00.79 or RCW 87
The IR star cluster candidate RCW 87 was selected from the Bica et al. (2003a) catalog. It is surrounded by CH87 320.153+0.780 (RCW 87) H II region (Rodgers et al. rod60 (1960)). Caswell & Haynes (cas87 (1987)) measured a radial velocity Vr=36.01 km/s from the H2CO and based on a Galaxy rotation model they determine a distance between 2.5 and 12.9 kpc, giving preference to the smaller value. Later, Simpson & Rubin (sim90 (1990)) measured the luminosity of the H II region =2.4104 from an improved Galactic rotation model.
3.1 Near-IR imaging
We covered RCW 87 with two overlapping pointings. The images are shown on Fig. 1 and Fig. 2. A pseudo-true colour image is shown in Fig. 3.
We used the common stars on the two pointings to estimate the errors of our photometry. The difference versus the mean value plots for the -band and the colour are shown in Fig. 4. The r.m.s. for the -band is 0.02 mag, and 0.06 mag for the colour, with a small systematic trend. Thus, we transformed the () of the first field to the second one with the equation: ()Field 2=0.214+1.17*()Field 1. We attribute the difference to the changing weather conditions during the observations.

Our final photometry list contains 1471 stars. The three brightest stars in the field are saturated on our images and their magnitudes were taken from the 2 MASS Point Source Catalog. The versus colour-magnitude diagram (CMD) of all stars is shown in Fig. 5 (left). We also observed a comparison field for back-/foreground subtraction with the same integration time and field of view, at RA=15:05:14.3 and DEC=57:28:8.7 (J2000). The CMD of that field is also shown on Fig. 5 (right). As can be seen, the field stars have 1.5 mag, while the cluster stars occupy the region 1.53.0 mag. There are also stars with strong IR excess at 3.0 mag. One of the three brightest stars at RA=15:05:20.566 and DEC=57:30:57.5 (J2000) has =1.08 mag and =8.57 mag and it is obviously a field star, while the others at RA=15:05:25.04 and DEC=57:30:55.96, and RA=15:05:16.9, DEC=57:30:05.67 (J2000) have =6.06 mag, =7.89 mag and =7.73 mag, =8.87 mag, respectively, and are the reddest stars in the CMD. We statistically decontaminated the cluster CMD from the field population using the comparison field, leaving only 1121 probable cluster members. The details of the procedure are given in Borissova et al. (2005).
To determine the boundaries of the cluster we performed direct star counting, assuming spherical symmetry. Since the field of view of Panic covers the object only partially, we used the 2 MASS photometry within 10 arcmin from the cluster center. The cluster boundary was defined as the point of the profile where the excess density becomes twice the standard deviation of the surface density of the surrounding field. This yields a radius of 2.5 arcmin. Fig. 6 shows the projected band star number density (number of stars per sq. arcmin) as a function of the radius. The depression near the cluster center is due to crowding in the 2 MASS.

3.2 Near-IR Spectroscopy
Near-IR spectra in the K atmospheric window of three stars (marked with squares in Fig. 5) in the field of RCW 87 were obtained with SofI at the ESO NTT. We used a grism yielding a resolution R2200 over 2.10-2.35m range, and 1 arcsec wide slit. The observations were made with nodding between two positions along the slit. The poor weather conditions made it possible to use only three images of 120 sec integration each. The data were reduced in the typical manner: sky subtraction, extraction of 1-dimensional spectra, wavelength calibration, division by a telluric standard (HIP 78169, G1 V) and removal of the artificial emission lines created by the telluric (Maiolino et al. mai96 (1996)).
The spectrum of the brightest star (RA=15:05:22, DEC=57:31:27, J2000) is plotted on Fig. 7. Since there is no clear scheme for spectral classification of red stars in the near-IR we simply cross-correlated the spectrum with the red stars in the spectral library of Ivanov et al. (iva04 (2004)). The best fit was obtained for a K0.5 II star. Note that metallicity effects are not taken into account, and the comparison with other spectra indicated that the error of the spectral type determination is three sub-types.

The comparison between the observed and the intrinsic colours, and the apparent and absolute magnitudes for the K0 supergiant – ()0=0.58 mag and =4.66 mag from Koornneef (kor83 (1983)) – yields: reddening of E()=1.98 mag or E()=3.41 mag and distance modulus of ()0=17.42 mag (D=7.6 Kpc). These values were used to plot the unreddened main sequence from Schmidt-Kaler (sch82 (1982)) on the CMD shown in Fig. 5. As can be seen, the main sequence stars form a well-defined locus and the brightest cluster members are evolved red supergiants.
The two other spectra of fainter stars that fell in the slit serendipitously were disregarded because they had insufficient signal-to-noise for spectral classification.
We estimate the age of the cluster by comparison with isochrones from the Padova stellar library (Bonatto et al. 2004), which provided theoretical isochrones computed for the 2 MASS photometric system. We used the distance and the reddening listed above and solar metallicity. The best fit favors a cluster age between 20 and 25 Myr (Fig. 8).
The total cluster mass was calculated as described in Borissova et al (2003): we adopted the 20 Myr isochrone, and counted cluster stars between reddening lines originating from positions on the isochrone for different initial masses. The mass interval is relatively narrow: from 4.5 to 11 solar masses, so we refrain from determining the initial mass function slope. The minimal total cluster mass, equal to the sum of the masses of suspected cluster members is 10300 solar masses.
Given the nature of our distance estimate we cannot obtain a formal error estimate but taking into account the difference in the luminosity of stars with the nearest spectral classes, we tentatively assume that our distance has 20% uncertainty. This corresponds to about 300 variation in the total cluster mass.
3.3 Mid-IR imaging
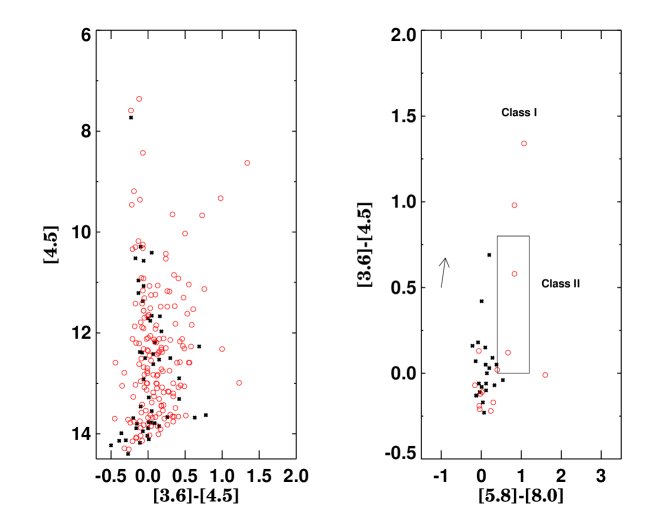
We used the 3.6, 4.5, 5.8 and 8.0 m observations of RCW 87 obtained with the Infrared-Array Camera on the Spitzer Space Telescope as a part of the Galactic Legacy Infrared Mid-Plane Survey Extraordinaire (hereafter GLIMPSE; Benjamin et al. 2003) to search for pre-main sequence cluster members. Wilking & Lada (1983) developed a classification scheme of young stellar objects based on the slope of their mid-IR Spectral Energy Distributions (SEDs). Later, it was placed in an evolutionary context by Adams et al. (ada87 (1987)) who modeled the SEDs as stars surrounded by dusty disks and envelopes. The comparison of these models with the observed SEDs suggested that the Class I objects are protostars with infalling envelopes, and Class II objects are stars with disks. Class III objects have the SEDs of stellar photospheres. The three classes form an evolutionary sequence, with young stars evolving from Class I to Class II and finally to Class III objects (Kenyon & Hartmann ken95 (1995)).
The cluster is clearly visible on [3.6] and [4.5] m, while the other bands are dominated by dust emission (see Fig. 9 and Fig. 10). In total, 171 stars within radius 2.5 arcmin around the cluster center have at least one mid-IR measurement (marked with squares on Fig. 9). The [4.5], [3.6-4.5] colour magnitude diagram and [5.8-8.0], [3.6-4.5] colour-colour diagram are shown in Fig. 11. Most RCW 87 stars that cluster around [3.6][4.5]=0 mag and [5.8][8.0]=0 mag appear to be field stars or Class III sources, with no intrinsic IR excess. We identified three Class II objects and two Class I objects.
4 [BDSB2003] 164
The IR star cluster candidate [BDSB2003] 164 (Fig. 12) was selected from Bica et al. (2003b ). It is located in a crowded field, and it is surrounded by an H II region IRAS 17221-3619. Peeters et al. (pet02 (2002)) measured a radial velocity of 21.0 km s-1 from IR recombination lines. They derived a distance of 3.4 Kpc and a luminosity of =7.52104.
The object is practically invisible on the -band images, but the overdensity on the and -bands is obvious. Based on the profile we adopted a radius of 0.3 arcmin. The versus colour-magnitude diagram of all stars in our field (2785 stars) is shown in Fig. 13, left panel. To obtain an estimate of the fore- and background contamination we define a non-cluster region, with radius greater than 0.7 arcmin and an area equal to that of the cluster. The stars within the adopted cluster radius are shown with open red circles, while the comparison field stars are plotted as black asterisks. The brightest stars are saturated and their magnitudes are taken from 2 MASS (shown in Fig. 13 as triangles). Most of the field stars in the CMD have 1.0 mag, while the stars within a 0.3 arcmin radius are located between 1.53.0 mag. The () vs. () colour-colour diagram is plotted on the right panel. Two reddening vectors for , encompassing the main sequence locus, are drawn as arrows on the colour-colour diagram. The unreddened Main Sequence (Schmidt-Kaler sch82 (1982)) is shown as a solid line. We used the absorption ratios from Bessell et al. (1998). The colour-colour diagram reveals the severe and variable extinction – almost half of the stars are reddened main-sequence stars. Some stars with strong IR excess and probably pre-main sequence stars. After statistically cleaning the cluster CMD by removing from the cluster colour-magnitude diagram as many stars as there are present on the “field” colour-magnitude diagram, we selected 74 probable cluster members.
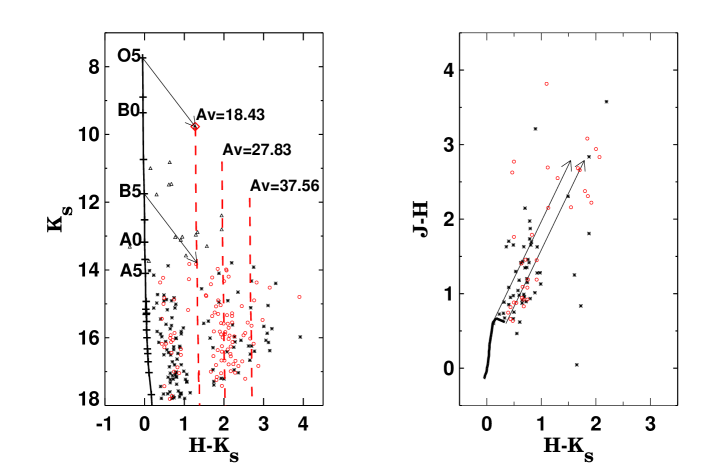
The reduced NTT spectrum of the star with coordinates: RA=17:25:32 and DEC=36:21:50 is plotted in Fig. 14. The star is marked with a square on the colour magnitude diagram and lies away from the locus of the main sequence stars. In the true colour image, however we can see that it is in the middle of the cluster and probably is its brightest cluster member. To obtain the spectral type we compared our spectrum with the stellar library of Pickles (1998). The H- (Fig. 14, left) and K-band (Fig. 14, right) spectra of O5 V, O9 V and B0 V from this library are shown in the first three positions, followed by the program star and spectrum of the sky. Most likely the target star belongs to the O5 V – 09 V sub-class. The intrinsic IR colour and the absolute magnitudes for O5 V and O9 V stars are: ()0=0.05, =4.79 mag, and ()0=0.04, =3.63 mag (Schmidt-Kaler sch82 (1982)), respectively. If the stellar type is O9 V, the calculated reddening and distance are E()=5.72 and ()0=11.32 mag (D=1.9 Kpc), much smaller than the distance of D=3.4 Kpc to the Hii region (Peeters et al. pet02 (2002)). Assuming O5 V type leads to E()=5.76 and ()0=12.53 mag (D=3.2 Kpc), fully comparable with the those for the H II region. However, plotting in Fig. 13 the reddened main sequence of Schmidt-Kaler (sch82 (1982)) shows that the low luminosity cluster members are redder than expected. Most likely this is due to differential reddening – the strong wind of the O star has cleared the dust from its immediate surroundings while low mass stars are still dust-embedded. Therefore, we adopted for the rest of the cluster E()=8.70 mag.

Adopting the 1 Myr isochrone we derived a minimal total cluster mass, comprised of the mass of suspected cluster members of 70 solar masses. An integration of the extrapolated power-law IMF fit down to 0.08 yields a total mass of 1760 which should be considered as an upper limit.
5 [DBSB2003] 172
The IR star cluster candidate [DBSB2003] 172 was selected from Dutra et al. (dut03 (2003)). It is surrounded by the H II region GAL337.9-00.5 with a kinematical distance from the Sun of 3.0 Kpc and a galactocentric radius of 5.8 Kpc (Giveon et al. 2002).
The band image of our fields is shown in Fig. 15 and the versus colour-magnitude diagram of all 3564 stars in our photometry list is shown in Fig. 16. The unreddened Main Sequence (Schmidt-Kaler sch82 (1982)) is plotted with a solid line, and with dashed lines for different reddening values, corresponding to E()=2.0 and E()=4 mag. The reddening vectors for B0 V and B5 V stars are also shown, for AV=17.6 mag. The =12.39 mag is adopted from Giveon et al. (2002).
There is no overdensity of stars on our 300 sec images. The colour-magnitude diagram shows fore/background stars visible around =0.5 mag and reddened Main Sequence stars with =6.4 mag in the region between =1.5 and 2.5 mag. There are 23 stars with 2.5 mag. They are overplotted on Fig. 15 and closely follow the morphology of the gas.
Thus, [DBSB2003] 172 shows only a weak concentration of red stars, associated with the H II region and most likely this is an extended star forming region.
Mid-IR 3.6, 4.5, 5.8 and 8.0 m imaging of [DBSB2003] 172 is available from the Spitzer Space Telescope. A [3.6], [5.8] and [8.0] m true colour image is shown on Fig. 17. Again, there is no obvious centrally concentrated overdensity of the stars.
The mid-IR photometry of stars within a 5 arcmin radius around [DBSB2003] 172 is shown in Fig. 18. The [4.5] vs [3.6][4.5] colour-magnitude diagram is shown in the top left panel, the [4.5][5.8] versus [3.6][4.5],[5.8][8.0] versus [4.5][5.8] and [5.8][8.0] versus [3.6][4.5] colour-colours diagrams are shown in the other panels. Most of the stars cluster around [3.6][4.5]=0 and [5.8][8.0]=0 and are background/foreground stars or Class III sources with no intrinsic IR excess. Fifteen stars have 0.0[3.6][4.5]0.8 and 0.4[5.8][8.0]1.1 and therefore they are Class II pre-main sequence objects (Allen et al. all04 (2004)). There are also three objects, that can be attributed to Class I. All sources mentioned are located outside the field of view of our near-IR observations.
6 Summary
We report photometric and spectroscopic observations of three embedded cluster candidates located in the general direction of the Galactic Center. Two of them – RCW 87 and [BDSB2003] 164 – are genuine clusters, while [DBS2003] 172 is probably an extended star forming region.
Our deep and images indicate that RCW 87 is a dense stellar cluster with a radius of 2.5 arcmin. The K-band spectrum of the brightest cluster member identifies it as a K0.5 II supergiant, yelding E()=3.4, AV=10.9, and =17.42 mag (D=7.6 kpc). The cluster age is between 20 and 25 Myr and its brightest members have already evolved into red supergiants. The isochrone analysis indicated that the cluster is massive – the total mass of the detected cluster members is 10300 solar masses, in the range of the most massive known young clusters in the Milky Way. Further analysis of this object is necessary to confirm this interesting result. The mid-IR photometry from the Spitzer Space Telescope shows the presence of at least five Class I and II proto-stellar objects indicating that some triggered star formation in the H II region is still going on in the vicinity of this cluster.
The cluster candidate [BDSB2003] 164 is a small star cluster with only 74 probable members within a 0.3 arcmin radius. The brightest cluster star is identified as an O5 main sequence star, based on our IR spectrum. We calculated a distance modulus of =12.53 mag (R=3.2 kpc) and reddening of E()=8.7 mag. The mass of the detected cluster members is 70 solar masses and an upper mass limit of 1760 solar masses is estimated.
The deep , and images show no concentration of stars outlining a cluster for the [DBSB2003] 172 cluster candidate. The stars with the reddest colours follow closely the morphology of the gas. On the other hand, the mid-IR photometry shows active on-going star formation in the H II region.
Acknowledgements.
This publication makes use of data products from the Two Micron All Sky Survey, which is a joint project of the University of Massachusetts and the Infrared Processing and Analysis Center/California Institute of Technology, funded by the National Aeronautics and Space Administration and the National Science Foundation. This research has made use of the SIMBAD database, operated at CDS, Strasbourg, France. This work is based [in part] on observations made with the Spitzer Space Telescope, which is operated by the Jet Propulsion Laboratory, California Institute of Technology under a contract with NASA.” The authors gratefully acknowledge the comments by the anonymous referee. D.M. and D.G. are supported by FONDAP Center for Astrophysics grant number 15010003.References
- (1) Allen, L., Calvet, N., D’Alessio, P., Hartmann, L., Megeath, S. et al. 2004, AlS, 154, 363
- (2) Adams, F.C., Lada, C.J., & Shu, F.H. 1987, ApJ, 312, 788
- (3) Benjamin, R., Churchwell, E., Babler, L., Bania, T. M., Clemens, P. et al. 2003, PASP, 115, 953
- (4) Bica, E., Dutra, C.M. & Barbuy, B., 2003a, A&A, 397, 117
- (5) Bica, E., Dutra, C.M., Soares,J. & Barbuy, B. 2003b, A&A, 404, 223
- (6) Bessell, M.S., Castelli, F. & Plez, B. 1998, A&A, 333, 231
- (7) Bonatto, Ch., Bica, e., Girardi, L., 2004, A&A, 415, 571
- (8) Borissova, J., Pessev, P., Ivanov, V.D., Saviane, I., Kurtev, R., Ivanov, G.R. 2003, A&A, 411, 83
- (9) Borissova, J., Ivanov, V.D., Minniti, D., Geisler, D., Stephens, A. W. 2005, A&A, 435, 95
- (10) Caswell, J.L. & Haynes, R.F. 1987, A&A, 171, 261
- (11) Chan, S., Henning, T., Schreyer, K, 1996, A&AS, 115, 285
- (12) Giveon U., Sternberg A., Lutz D., Feuchtgruber H., Pauldrach A.W.A., 2002, AJ, 566, 880
- (13) Fitzpatrick, E., 1999, PASP, 111, 63
- (14) Dutra, C.M., Bica, E., Soares, J. & Barbuy, B. 2003, A&A, 400, 533
- (15) Epchtein, N. 1997, in ASSL Vol. 210, The Impact of Large Scale Near-IR Sky Surveys, ed. F. Garzon et al. (Dordrecht: Kluwer), 15
- (16) Ivanov, V.D., Borissova, J., Pessev, P., Ivanov, G.R., Kurtev, R. 2002, A&A, 394, 1
- (17) Ivanov, V. D., Borissova, J., Bresolin, F., Pessev, P. 2005, A&A, 435, 107
- (18) Ivanov, V. D., Rieke, M.J, Engelbracht, C.W. Alonso-Herrero, A., Rieke, G.H. & Luhman, K.L. 2004, ApJ, 151, 387
- (19) Kenyon, S. J., & Hartmann, L. 1995, ApJS, 101, 117
- (20) Koornneef, J., 1983, A&A, 128, 84
- (21) Kuchar, T.A.,Clark, F.O., 1997, ApJ, 488, 224
- (22) Maiolino, R., Rieke, G.H. & Rieke, M.J. 1996, AJ, 111, 537
- (23) E. Peeters, E., Martin-Hernandez, N, Damour, F., Cox, E., Roelfsema,P.R. et al., 2002, A&A 381, 571
- (24) Pickles, A.J., 1998, PASP, 110, 863
- (25) Rodgers, A.W., Campbell, C.T., Whiteoak, J.B., 1960, MNRAS, 121,103
- (26) Simpson, J.P., Rubin, R.H., 1990, AJ, 354, 165
- (27) Schmidt-Kaler, T., 1982, in Landolt-Borstein, New Series, Group VI, vol. 2, ed. K. Schaifers & H.H. Voigt (Berlin: Springer-Verlag),1
- (28) Skrutskie, M.F., et al. 1997, in ASSL Vol. 210, The Impact of Large Scale Near-IR Sky Surveys, ed. F. Garzon et al. (Dordrecht: Kluwer), 25
- (29) Stetson, P. B. 1993, User’s Manual for daophot ii
- (30) Wilking, B. A., & Lada, C. J. 1983, ApJ, 274, 698