Recognizing the First Radiation Sources Through Their 21–cm Signature
Abstract
At the beginning of the reionization epoch, radiation sources produce fluctuations in the redshifted 21-cm background. We show that different types of sources (such as miniquasars, Pop II and III stars, supernovae, etc.) produce distinct signatures in the 21-cm signal radial profiles and statistical fluctuations, through which they can be identified. Further, we show that the 21-cm signal from X-ray emitting sources is much easier to observe than was expected, due to a previously neglected pumping mechanism.
Subject headings:
cosmology: theory – early universe – galaxies: formation1. Introduction
As shown by WMAP observations Spergel et al. (2006), within a half billion years after the Big Bang the Universe must have given birth to numerous radiation sources, that by reionized most of the gas in the intergalactic medium (IGM). However, the nature of these sources remains a puzzle. Miniquasars, Pop II and III stars, supernovae, and many others have been suggested as the main engines of reionization e.g. Choudhury & Ferrara (2006). Unfortunately, direct observations may not be able to distinguish between the different types. For most, the low-energy part of the spectrum has the same thermal shape, , while the upper part, eV is absorbed or scattered by the neutral IGM. However, as we show in this paper, it is still possible to measure the shape of the upper part of the spectrum, from the source imprint on the 21-cm signal of the surrounding neutral IGM.
When at redshift the hydrogen spin temperature, , is different from the temperature of the cosmic microwave background (CMB), , the CMB brightness temperature presently observed at the wavelength cm changes by
| (1) |
where is the local overdensity and is the ionized hydrogen fraction. The spin temperature is determined by Field (1958)
| (2) |
where is the kinetic temperature, is a constant proportional to the collisional excitation rate (see Zygelman (2005) and Liszt (2001) for the contribution of neutral atoms and electrons to the collisional pumping) and is given by
| (3) |
where is the oscillator strength of the Ly transition, is the spontaneous emission coefficient of the hyperfine transition, is the radiation intensity at the far red wing of the Ly resonance (where the intensity of UV photons is unaffected by scatterings) and is a correction factor, which for the unperturbed IGM is given by Chuzhoy & Shapiro (2005)
| (4) |
Several authors have previously explored the ways can be decoupled from by the first radiation sources. Nusser (2005) has pointed out that, since charged particles have a much higher cross-section for collisionally de-exciting the hyperfine transition, can be decoupled from in moderately overdense partially ionized regions (which may be produced by an X-ray source or following the recombination of a fully ionized HII region). In this way a miniquasar with luminosity can decouple the gas within a few hundred comoving kiloparsec Kuhlen et al. (2005). Cen (2005) considered a massive starburst in the first galaxies that produce a strong UV background. In his model is decoupled from by the photons slightly on the blue side of the Ly resonance that redshift into the resonance within some distance (typically up to a few comoving Mpc) from the source. However, in this paper we show that in all of the above systems the spin temperature is dominated by locally emitted Ly photons that can be produced in three different ways (collisional excitation, recombination, or cascade). Including these photons in the calculation not only boosts the intensity of the signal (by orders of magnitude for the X-ray sources), but makes a qualitative change in its radial profile.
In §2, 3 and 4 we recalculate the 21 cm signal from the systems discussed above (X-ray and UV sources, and recombining HII regions). In §5 and §6 we consider the signal produced by galactic winds and short-lived radiation sources, respectively. In §7 we summarize our results.
2. X-ray sources
After traveling an average comoving distance of through the neutral gas, an X-ray photon gets absorbed by an atom. A high energy electron produced by the absorption scatters with other atoms, electrons, and protons, thereby depositing its energy into heat, secondary ionizations, and atomic excitations. Shull & Van Steenberg (1985) showed that the division of energy depends on the ionized fraction , with of the total going to heat, to ionizations and to excitations of hydrogen atoms.
On the basis of these results we find that when the initial ionized fraction is low (as it is for the primordial gas after ) and temperature is below K, the X-rays increase and by
| (5) |
where is the average energy deposited per atom.
The heating rate and intensity of Ly photons produced by deexcitations of hydrogen atoms, at a distance from the X-ray source, is given by
| (6) | |||||
| (7) |
where is the source luminosity at frequency and is the hydrogen atom number density.
Assuming that the spectrum of high-redshift X-ray sources is similar to ”ultraluminous” X-ray sources in nearby galaxies, for keV e.g. Miller et al. (2003), we can transform eqs. 6 and 7 into
| (8) | |||||
| (9) |
where is given in Myrs.
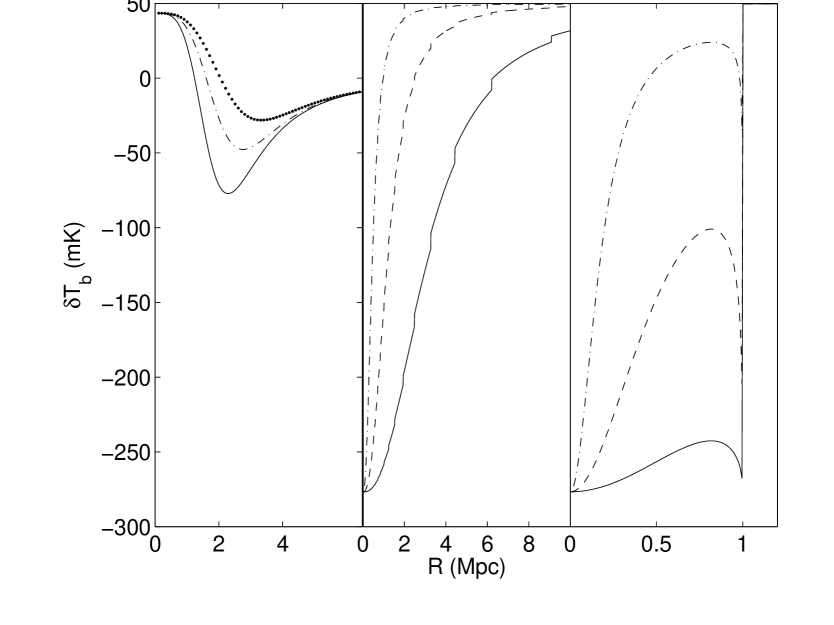
Figure 1a shows the evolution of 21-cm brightness temperature. Close to the source, where the gas is heated above , is positive. Farther out the gas becomes colder, so that becomes negative. Still farther out, the pumping radiation becomes too weak to decouple from , and approaches a small limiting value that is given by collisional coupling only.
3. UV sources
The decoupling of the spin temperature may also be done by radiation sources that emit a significant fraction of their energy in the range between Ly and Ly-limit frequencies. Unlike ionizing photons, photons in this range can travel freely through neutral hydrogen, until they are redshifted into one of the atomic resonances. With the exception of photons that are very close to the Ly-limit, which may skip one or more resonances, most of these photons are first scattered when the closest resonance is reached. Thus, only photons emitted between Ly and Ly frequencies reach the Ly resonance, which they leave only after scatterings. By contrast, photons emitted above the Ly frequency typically scatter only a few times before being destroyed by cascading to lower levels. A fraction of resonant photons destroyed by cascade (0 for Ly, 0.26 for Ly and for higher resonances) produce Ly photons as one of the cascade products Hirata (2006); Pritchard & Furlanetto (2006). Since the frequency range between the Ly and Ly-limit is times smaller than that between Ly and Ly, Ly photons produced directly through redshifting are generally more numerous than those produced by cascade. However, the latter photons are typically produced within a much shorter distance from the source (on average the photon between and resonance travels a distance of before reaching a resonance), which makes them a dominant pumping mechanism within a few Mpc from the source. Including these photons in the calculation not only boosts the pumping radiation intensity, but also changes its radial profile. Whereas normally the radiation intensity is proportional to , the cascades change this dependence to approximately . In addition, they also result in the discontinuous jumps in pumping radiation intensity and 21 cm brightness signal at . Figure 1b shows the radial profile of 21-cm brightness temperature of the unheated IGM around UV sources. In principle, the resonant scatterings affect the gas temperature, which therefore becomes time- and position-dependent Chuzhoy & Shapiro (2005). However, unlike the X-ray photons, the UV resonance photons generally gain or lose only a very small fraction of their energy in exchange with the gas, so in Figure 1b we neglect this energy transfer.
4. Recombining HII regions
The low-mass galaxies that are first to form in the standard CDM model are expected to be very vulnerable to feedback. During brief and intensive periods of star formation, such galaxies may be completely disrupted by SN explosions or photoevaporation. Furthermore, reionization may also delay gas accretion and star formation in the neigbouring halos. Consequently, the H II regions produced by the first galaxies may be given a pause, allowing them to cool and recombine.

Unless the gas is extremely overdense, its thermal evolution as it recombines is determined mainly by inverse Compton cooling and radiative recombination. Right after ionization the temperature of the gas in the IGM depends on the shape of the ionizing spectrum. If the shape changes appreciably during the life-time of the ionizing source or if the source life-time is smaller or comparable to the gas cooling or recombination times, this would be reflected in the radial profile of the gas temperature and ionized fraction. Also, a strong jump in both temperature and ionized fraction can be produced across a He II ionization front. Even after the radiation source is dead, the difference in the ionized fraction inside and outside a former He III region would persist for quite a long time.
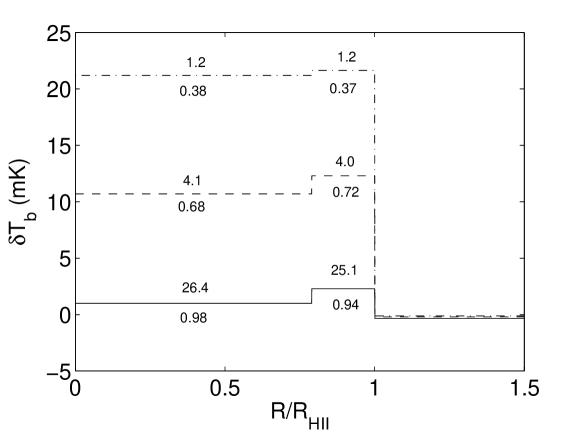
Figure 2 shows the evolution of the 21–cm signal from the recombining H II region, produced at by a short-lived source whose spectrum is similar to a black body with a surface temperature of K. Initially the gas brightness grows almost linearly with the hydrogen neutral fraction. Subsequently, when the ionized fraction falls below , the intensity of Ly photons (which dominate over collisional coupling for above ) produced by recombinations is insufficient to fully decouple from , and, unless additional Ly photons are provided by exterior radiation sources, the signal may drop.
5. Galactic winds
Even though large numbers of Ly photons may be produced by the overdense gas in galaxies via recombination or excitation of hydrogen atoms, these photons do not typically affect the 21 cm emission in the neighbouring IGM, as they redshift out of resonance close to their origin. This limitation, however, may be bypassed if the peculiar velocity of the gas is very large. Ly photons emitted by a medium moving with peculiar velocity may reenter the resonance within from the point of origin. Large peculiar velocities involving a large mass of gas may indeed be generated by one or more supernovae explosions e.g. Ostriker & Cowie (1981); Kitayama & Yoshida (2005); Wilman et al. (2005).
A wind expanding with velocity that exceeds 100 km/s shockheats and compresses the surrounding gas into a thin shell. The cooling in the outer parts of the shell, where the temperature is above K, is dominated by inverse Compton scatterings and bremsstrahlung. In the inner parts, where the temperature drops below K, most of the energy is radiated away in Ly photons. By considering a thin shell expanding with velocity at a radius , we find the distribution of the photons that are at resonance in the local gas frame to be
| (10) |
Figure 1c shows the 21 cm signal produced by a galactic wind for different radiation intensities.
Apart from supernovae, thin shells expanding with large peculiar velocities can be produced by large voids forming from steep initial density perturbations. The distribution of Ly photons produced by such shells can still be described by equation 10. However, in this case the ratio (which for shells driven by supernovae can be very large) is typically between and Chuzhoy & Nusser (2002).
6. Short-lived radiation sources
In the examples given in the previous sections, we have neglected the possible time-dependence of the luminosity of radiation sources. However, if the luminosity changes over a relatively short time-scale, this will be reflected in the 21-cm signal. Since the speed of light is finite, regions that are observed simultaneously are pumped by photons emitted at different times. Therefore, by measuring the 21–cm signal from different regions around the source, it is possible to reconstruct the evolution of the source spectrum and intensity. Figure 3 illustrates the evolution of the 21-cm profile after a starburst that lasts a few million years.
7. Summary
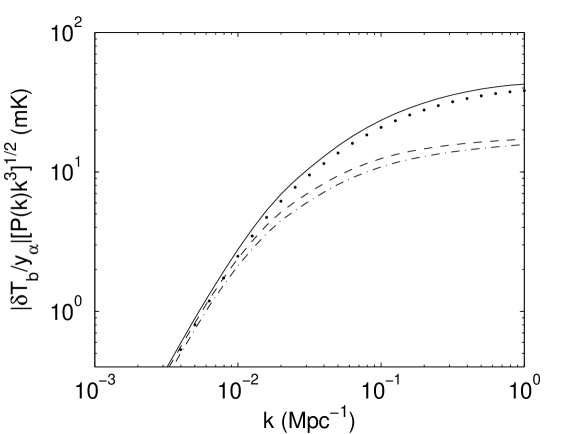
We have shown that different radiation sources produce distinctly different 21-cm profiles, which can be sensitive not only to the source spectrum, but also to its history (§2 and 6). Furthermore, differences can also be identified in the combined signal from multiple radiation sources of different types. Figure 4 shows the power spectrum of the 21-cm signal produced by either the X-ray or the UV sources contributed by a biased distribution of halos (the power spectrum calculation is based on the formalism developed by Barkana & Loeb (2005a)). Predictably, the X-ray sources, which typically influence smaller regions, produce greater fluctuations on small scales than do Pop III UV sources. This difference between X-ray and UV can be even larger if Pop III is replaced with Pop II stars, which produce lower proportion of higher n resonance photons (Barkana & Loeb 2005b; Pritchard & Furlanetto 2006).
Assuming that at the typical distance between the first radiation sources is a few Mpc, their individual detection requires an angular resolution of about one arcminute (or baseline of 15 km) and frequency resolution of kHz. For a beamwidth and bandwidth just small enough to resolve such objects, a detection of an X-ray source with erg/s (which equals the luminosity of one or more black holes of total mass shining with Eddington luminosity) requires a sensitivity of m2K, where is the integration time. Thus it appears that SKA, whose planned sensitivity is a few times m2K-1 at the relevant frequencies, would be able to detect such X-ray sources individually. The detection of the fluctuating 21-cm background produced by the superposition of the first sources is even more promising. For example, the curves in Figure 4 can be easily distinguished at scales Mpc-1 by LOFAR, SKA, or PAST for 4 weeks of integration time (see Zaldarriaga, Furlanetto, & Hernquist 2004 for details on power spectrum error estimation).
References
- (1) Barkana, R., Loeb, A. 2005a, ApJ, 624, L65
- (2) Barkana R., Loeb A., 2005b, ApJ, 626, 1
- Cen (2006) Cen, R. 2006, astro-ph/0601010
- e.g. Choudhury & Ferrara (2006) Choudhury, T.R. & Ferrara, A. 2006, astro-ph/0603149
- Chuzhoy & Nusser (2002) Chuzhoy, L. & Nusser, A. 2002, MNRAS, 335, 410
- Chuzhoy & Shapiro (2005) Chuzhoy, L. & Shapiro, P. R. 2005, astro-ph/0512206
- Chuzhoy & Shapiro (2005) Chuzhoy, L. & Shapiro, P. R. 2006, astro-ph/0604483
- Field (1958) Field, G. B. 1958, Proc. IRE, 46, 240
- Pritchard & Furlanetto (2006) Pritchard, J. R., & Furlanetto, S. R. 2006, MNRAS, 367, 1057
- Hirata (2006) Hirata, C.M. 2006, MNRAS, 367, 259
- Kitayama & Yoshida (2005) Kitayama, T. & Yoshida, N. 2005, 630, 675
- Kuhlen et al. (2005) Kuhlen, M., Madau, P. & Montgomery, R. 2006, 637, 1L
- Liszt (2001) Liszt, H. 2001, A&A, 371, 698
- e.g. Miller et al. (2003) Miller, J. M., Fabbiano, G., Miller, M. C., & Fabian, A. C. 2003, ApJ, 585, L37
- Nusser (2005) Nusser, A. 2005, MNRAS, 359, 183
- e.g. Ostriker & Cowie (1981) Ostriker, J. P. & Cowie, L. L. 1981, ApJ, 243, 127
- Shull & van Steenberg (1985) Shull, J. M. & van Steenberg, M. E. 1985, ApJ, 298, 268
- Spergel et al. (2006) Spergel, D.N. et al. 2006, astro-ph/0603449
- Wilman et al. (2005) Wilman, R. J., Gerssen, J., Bower, R. G., Morris, S. L., Bacon, R., de Zeeuw, P. T., & Davies, R. L. 2005, Nature, 436, 227
- Zaldarriaga, Furlanetto,& Hernquist (2004) Zaldarriaga, M., Furlanetto, S. R., & Hernquist, L. 2004, ApJ, 608, 622
- Zygelman (2005) Zygelman, B. 2005, ApJ, 622, 1356