X-ray observations of three young, early-type galaxies
Abstract
Massive halos of hot plasma exist around some, but not all elliptical galaxies. There is evidence that this is related to the age of the galaxy. In this paper new X-ray observations are presented for three early-type galaxies that show evidence of youth, in order to investigate their X-ray components and properties. NGC 5363 and NGC 2865 were found to have X-ray emission dominated by purely discrete stellar sources. Limits are set on the mass distribution in one of the galaxies observed with XMM-Newton, NGC 4382, which contains significant hot gas. We detect the X-ray emission in NGC 4382 out to 4re. The mass-to-light ratio is consistent with a stellar origin in the inner regions but rises steadily to values indicative of some dark matter by 4re. These results are set in context with other data drawn from the literature, for galaxies with ages estimated from dynamical or spectroscopic indicators. Ages obtained from optical spectroscopy represent central luminosity weighted stellar ages. We examine the X-ray evolution with age, normalised by B and K band luminosities. Low values of Log(LX/LB) and Log(LX/LK) are found for all galaxies with ages between 1 and 4 Gyrs. Luminous X-ray emission only appears in older galaxies. This suggests that the interstellar medium is removed and then it takes several gigayears for hot gas halos to build up, following a merger. A possible mechanism for gas expulsion might be associated with feedback from an active nucleus triggered during a merger.
keywords:
X-rays: galaxies –galaxies: evolution – galaxies: ISM – galaxies: individual: NGC 4382, NGC 5363, NGC 28651 Introduction
The existence of hot gas halos around many elliptical galaxies presents something of an enigma. How were they created and why do they not exist in all cases? Supernovae are supposed to provide the energy to heat up an existing gas reservoir, which could originate from stellar mass loss or from externally accreted gas. This heating process would require a large amount of energy to heat the quantities of gas, detected in X-rays, to the required temperatures (few 106 K). Once heated, the gas may form a hot halo around the galaxy, or escape the potential well of the galaxy in a wind, or take part in cooling flows, particularly rapid near the denser central regions of the galaxy (Pellegrini & Ciotti 1998; Fabian et al. 2002; Daisuke, Yun & Mihos 2004). Another possibility for the gas origin is from the cold interstellar medium (ISM) in spiral galaxies if the hot gas halos formed when they merged. However, previous work showed that there is an unexpected dearth of gas, either cold or hot, in young, early-type galaxies (E and S0 galaxies). Results from the Einstein and ROSAT satellites indicated that dynamically young, early-type galaxies are X-ray poor compared to other early-type galaxies (Fabbiano & Schweizer 1995; Sansom, Hibbard & Schweizer 2000; O’Sullivan, Forbes & Ponman 2001a, hereafter OFP01a). Hibbard & Sansom (2003) studied 5 of these dynamically young, early-type galaxies in neutral hydrogen (HI), with the VLA and found very low upper limits to the mass of cold gas present in these systems (). Chang et al. (2001) found a similar result for E+A galaxies, thought to be recent merger products, with only one out of 5 galaxies detected in HI. Georgakakis et al. (2001) showed that the HI content of young merger remnants decreases in the first 1 to 2 Gyrs following a merger, after which there is little detectable change in HI content towards evolved ellipticals. More recently Xilouris et al. (2004a) studied the dust content along a sequence of merging systems with dynamically estimated ages. They found that the warm-to-cold dust mass ratio increased along this sequence indicative of changing star formation and dust content in ongoing mergers.
OFP01a looked at X-ray emission in early-type galaxies versus their luminosity weighted age estimated from optical spectroscopy (Terlevich & Forbes 2002, hereafter TF02). From optical spectroscopy the luminosity weighted age is likely to indicate the age of the last major gaseous merger/accretion, since the luminosity weighting is dominated by the latest star formation. OFP01a showed that ellipticals with younger luminosity weighted ages were generally weaker X-ray sources, when normalised by their optical luminosity. Note that optical luminosity fades only slowly for stellar populations older than about a Gyr, as we illustrate later in this paper.
These previous studies made use of simplistic characterisations of the overall X-ray properties of early-type galaxies, since the signal-to-noise or spectral sampling of the X-ray observations was generally low. With the advent of more sensitive X-ray missions, such as ASCA, XMM-Newton and Chandra, the increased signal-to-noise and broader spectral range allows us to investigate the X-ray properties of early-type galaxies in more detail. ASCA observations revealed that elliptical galaxies generally require two spectral components to describe their X-ray emission (Matsushita et al. 1994; White, Sarazin & Kulkarni 2002). These originate from diffuse gas (described by a soft thermal component at kT 0.2 to 1 keV) and from a population of low-mass X-ray binary (LMXB) stars (with higher energy emission that can be described by a power-law with flux frequency-1.8). In this paper we focus on three early-type galaxies (NGC 4382, NGC 5363 and NGC 2865) which are thought to be young. The aim is to measure the levels of different contributions to the X-ray emission. In particular, we focus on determining the contributions from hot gas.
In this paper we employ galaxy ’ages’. Briefly, such ages are derived from a longslit, optical spectrum of the galaxy centre. The Lick system (e.g. Trager 2004 and references therein) defines 25 absorption lines that can be measured from the spectrum and corrected onto the same basis as the original work (e.g. Worthey 1994). Comparison of the resulting indices to single age, single metallicity stellar populations can break the age-metallicity degeneracy to give independent, luminosity-weighted age and metallicity estimates. In our case we use the multi-line fitting method of Proctor & Sansom (2002).
It should be recognised that the resulting ages are applicable only to the central regions, typically 1/8 to 1/2 of the galaxy effective radius (re). In general galaxy centres will contain a complex mix of stellar population ages. Any young stellar population present will be brighter than an old population. Thus the derived luminosity-weighted age for the galaxy centre will infact be an upper limit to the mean age of the central stars. The youngest stars were formed in a starburst event that may have been triggered by gas accretion onto the galaxy centre by an interaction or merger. Forbes, Ponman & Brown (1998) showed that the spectroscopic age was similar to the time since a merger for a small sample of morphologically disturbed galaxies. Thus such ages provide an indication of the time since the last interaction or merger, but not necessarily about when the bulk of the galaxy’s stars formed. This will depend on the (unknown) fraction of mass involved in the young stellar population.
This paper is set out in the following way. Section 2 describes the targets and their observations. Sections 3 presents their X-ray properties derived from spectral fitting of XMM-Newton and Chandra data. Sections 4 describes analysis of the X-ray surface brightness profile and limits on the mass distribution in NGC 4382, from combined XMM-Newton and archival Chandra data. Section 5 sets these results into broader context with X-ray data from other early-type galaxies that also have age estimates. Conclusions are given in Section 6.
Throughout this paper, we normalise optical -band luminosities to the -band luminosity of the sun, LB⊙=5.21032 ergs s-1, and assume H0=75 km s-1 Mpc-1. Abundances are measured relative to the ratios of Anders & Grevesse (1989). While these have now been superseded by more recent measurements, their use provides continuity with previous studies.
2 Targets and observations
We aimed for a sample of early-type galaxies with evidence of young ages in order to study their X-ray emission components in detail. Targets were selected from the X-ray catalogue of early-type galaxies of O’Sullivan, Forbes & Ponman (2001b, hereafter OFP01b). The generally faint nature of the X-ray fluxes from early-type galaxies means that sensitive instrumentation is required to measure the various contributions to the X-ray flux, from spectral fitting. A broad spectral range and good spectral resolution are also required. The most sensitive X-ray observatory currently available is XMM-Newton. Therefore we selected four nearby cases thought to be young, early-type galaxies and were awarded time for two of them on XMM-Newton, NGC 4382 and NGC 5363. We also made use of an archival Chandra observation of NGC 4382 and an additional young galaxy, NGC 2865, observed with Chandra is also reported in this paper. These three galaxies are described below and their optical properties are summarised in Table 1.
2.1 NGC 4382
The X-ray luminosity of NGC 4382 was known from previous observations. EINSTEIN observations showed it to be a moderate luminosity X-ray source with (Log(LX)=40.33 erg s-1 for = 75 km s-1 Mpc-1, Fabbiano, Kim & Trinchieri 1992). It was then observed as an X-ray faint, early-type galaxy, with ROSAT (Fabbiano, Kim & Trinchieri 1994). More recently it was observed with Chandra by Sivakoff, Sarazin & Irwin (2003), who resolved 58 point sources within the galaxy, attributed mostly to LMXBs. They also detected some diffuse gas at kT and uncertain abundance. NGC 4382 is a lenticular galaxy that follows a de Vaucouleurs (r1/4 law) optical surface brightness profile (Baggett, Baggett & Anderson 1998). No neutral hydrogen gas is detected in this galaxy (Hibbard & Sansom 2003). It is interacting with NGC 4394, both in the Virgo cluster. It has a large quantity of morphological fine structure, which points towards a dynamically young age (Schweizer & Seitzer 1992). The luminosity weighted age of its stellar population was also estimated to be young (1.6 0.3 Gyr) from optical spectral absorption lines, as listed in the Age Catalogue of Terlevich & Forbes (TF02), see http://astronomy.swin.edu.au/dforbes. Its deviation from the fundamental plane also suggests it is very young (Forbes, Ponman & Brown 1998).
2.2 NGC 5363
Results from EINSTEIN observations of NGC 5363 reveal a moderate X-ray luminosity of Log(LX)=40.14 erg s-1 (OFP01b). This galaxy has been classified in various ways, including irregular and peculiar. However morphological classification based on recent, mid-infrared maps gives an E/S0pec class (Pahre et al. 2004) and the galaxy follows an r1/4 profile (Xilouris et al 2004b). NGC 5363 is a non-interacting pair with NGC 5364, which is 14.5 arcmins away. NGC 5363 was thought to be a young system, from its strong H absorption line. From optical spectroscopy Denicoló et al. (2005) estimate the age in the central regions to be 3.8 Gyr. They used only four spectral line-strengths to estimate the age (H versus the composite index [MgFe]). Later in this paper we attempt a new age estimate using more data (see Section 5.1). NGC 5363 has a dust lane along its minor axis, which shows up in mid-infrared observations (Xilouris et al. 2004b). From observations with the Infrared Space Observatory (ISO) it contains a dust mass of M⊙ (Temi et al. 2004). If the gas-to-dust mass ratio is similar to that in our Galaxy, this implies a total gas mass of at least M⊙ in the ISM. The gas-to-dust mass ratio in early-type galaxies may be more than this (3000, with large scatter, from the ISM catalogue of Bettoni, Galletta & Garcia-Burillo 2003). With this gas-to-dust ratio the total gas mass in NGC 5363 could be M⊙. We discuss qualitatively whether this is detected in the X-ray observations in Section 3.1 and Section 6.
2.3 NGC 2865
There was an upper limit on the X-ray flux from NGC 2865, of erg s-1 cm-2, from ROSAT all sky survey data (OFP01b), implying a luminosity limit of Log(LX) erg s-1. NGC 2865 is an isolated elliptical galaxy that follows an r1/4 law in surface brightness, plus is surrounded by shells (e.g. Reda et al. 2004). It also has a kinematically distinct core (Hau et al. 1999). It is quite blue, has strong H absorption of 3.12Å and an estimated age since the last major burst of star formation of between 0.4 and 1.7 Gyr (Hau et al. 1999), from fitting optical spectroscopy with star formation histories. Despite its apparent youth NGC 2865 is classified as an elliptical (T-type -5) in de Vaucouleurs et al. (1991, hereafter RC3).
| Galaxy | Type | T-type | Dist | z | D25 | re | BT | Age |
| (Mpc) | (“) | (“) | (mag.) | (Gyr) | ||||
| NED | RC3 | PS96 | NED | RC3 | RC3 | RC3 | (See text) | |
| NGC 4382 | S0pec | -1.0 | 15.9 | 0.00243 | 425 | 54.6 | 10.00 | 1.6 |
| NGC 5363 | E/S0peca | -3.5a | 15.8b | 0.00380 | 244 | 36.1 | 11.05 | 3.8 |
| NGC 2865 | E3-4 | -5.0 | 36.5 | 0.00876 | 147 | 12.5 | 12.57 | 1.0 |
| aPahre et al. (2004) | ||||||||
| b Tully (1988) | ||||||||
2.4 XMM-Newton observations
NGC 4283 was observed on 2004 July 7 (ObsIDs 0201670101) with observation time of 36057 sec and NGC 5363 was observed on 2004 July 27 (ObsID 0201670201) with observation time of 40278 sec. The observations were taken in full frame mode with the medium optical blocking filter to reduce unwanted background. Data for all three EPIC cameras was analysed simultaneously for each galaxy. The spectral range covered by EPIC is 0.15 to 15 keV. See Jansen et al. (2001) for details of the XMM-Newton mission and hardware.
The raw observation data files (ODFs) were retrieved from the XMM-Newton Science Archive. Calibration files were selected from the master calibration database, with the observation date of the target and an analysis date of 2005 April 20. The script cifbuild on the XMM-Newton website was used to select the appropriate calibration files for downloading. XMM-Newton Science Analysis System (SAS) software was used to calibrate and analyse the event datasets and to create products including spectra, images and time series. SAS version 6.1 (release xmmsas_20041122_1834-6.1.0) was installed on a linux pc system, together with the FTOOLS and XSPEC version 12 software packages. Environment variables were set up to locate the calibration and ODF files, with a summary file in the working directory for each target. Event lists were generated using emproc and epproc.
A time series of events from each camera was generated using the graphical interface xmmselect to the events selector routine eveselect in the SAS software. The time series revealed that about half the observation time was affected by X-ray background flares. These times were eliminated. Further cleaning of the data was done using the three sigma clipping routine of Ben Maughan (http://www.sr.bham.ac.uk/xmm2/scripts.html), on data in the energy range 2 - 15 keV. This energy range was chosen because the flaring was apparent at high and intermediate energies. X-ray events were accepted for patterns 0-12 for the two EPIC MOS cameras and 0-4 for the EPIC PN camera, and the events lists were further filtered using FLAG=0.
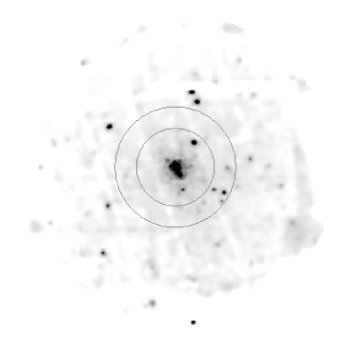
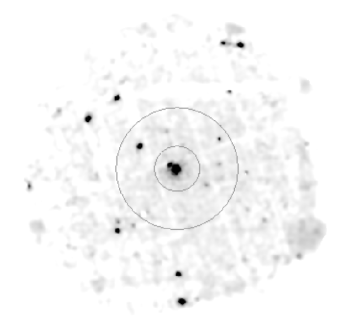
Inspection of the X-ray images (see Fig. 1) revealed that the optical isophotal diameter D25 (see Table 1) encompassed most of the X-ray counts from each galaxy. Therefore an annulus just outside this region was chosen to determine the background spectrum, extending out to a diameter of 11 arcminutes. Regions centred on a few bright point sources were removed from the background annulus in each case, before creating spectra. Analysis of out-of-field events revealed that the background was still dominated by particle events, therefore no vignetting correction was made for the background. The routine emchain was used to sort out-of-field events in the target data and also in long exposure, closed event files produced by Phillipe Marty, obtained from the web at http://www.sr.bham.ac.uk/xmm3. The script CompareoutofFOV, also available from the above Birmingham University web site, was used to calculate the scaling between the particle levels in the target data and closed data in the out-of-field region.
Source region and background region spectra were created from the cleaned photon events. A summary of the useful exposures and source counts obtained is given in Table 2. The percentages show that the source counts within D25 diameter are about the same as the estimated background counts in that region, for each galaxy.
| Galaxy | EPIC | Useful | Source counts | Source counts |
|---|---|---|---|---|
| camera | exp.(s) | in D25 diameter | in 4re diameter | |
| NGC 4382 | MOS1 | 17830 | 2002 (50.7%) | 1382 (72.8%) |
| NGC 4382 | MOS2 | 17850 | 2001 (51.1%) | 1302 (72.2%) |
| NGC 4382 | PN | 12400 | 4992 (53.2%) | 3447 (73.2%) |
| NGC 5363 | MOS1 | 22960 | 1360 (49.8%) | 789 (86.8%) |
| NGC 5363 | MOS2 | 22960 | 1346 (50.2%) | 730 (86.5%) |
| NGC 5363 | PN | 10620 | 2145 (45.8%) | 1351 (84.7%) |
Response files were created for source regions and area scaling was calculated using the SAS subroutines arfgen, rmfgen and backscale. The FTOOLS subroutine grppha was used to group the source spectra into a minimum of 20 counts per bin. Data below 0.3 keV are strongly affected by the soft photon background and by imperfections in the calibration, and there are few source counts above about 7 keV. Also, several background fluorescence lines occur above about 7 keV. Therefore data within 0.3 to 7 keV was analysed for source spectral properties. One or two weak background fluorescence emission lines remain around 1.5 keV, but these did not significantly affect the spectral fits.
2.5 Chandra Observations
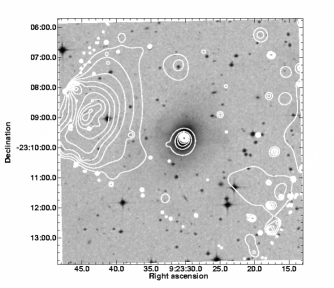
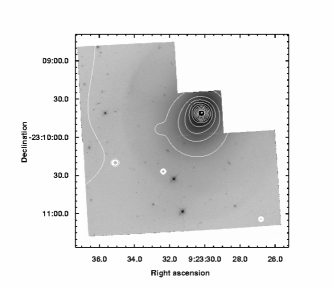
NGC 2865 was observed with the ACIS-S detector on the Chandra observatory for a total of 29.9 ksec using the nominal aimpoint for the spectroscopy array. The observation date was 2001 May 17 (ObsID 2020). A digitised sky survey (DSS) image is shown with X-ray contours overlaid in Fig. 2. A close-up of the X-ray contours over an HST image is also shown in Fig. 2. NGC 2865 is clearly detected, with point source emission near the centre, surrounded by more diffuse emission associated with NGC 2865.
NGC 4382 was observed for 40 ksec on 2001 Jan 29 (ObsID 2016) with Chandra ASCI-S, in faint mode. The raw data was reprocessed with ciao v3.1, and filtered to exclude bad pixels and events with ASCA grades 1, 5 and 7. Filtering for periods of high background and to remove point sources was carried out as described in O’Sullivan & Ponman (2004a). Our purpose in analysing the dataset was to produce a high resolution surface brightness image, and a background image was extracted from the blank-sky data described by Markevitch111http://asc.harvard.edu/cal/. The background image was scaled to match the data by comparison of the counts in PHA channels 2500-3000.
3 Derived X-ray properties
3.1 XMM-Newton spectra
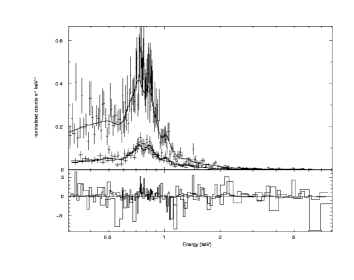
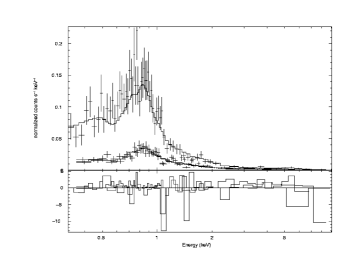
Spectral fitting was carried out using XSPEC, including thermal (MEKAL) and power-law components in the models. These were multiplied by an absorption model (wabs). Absorption was assumed to be at least that due to our Galaxy. The Galactic HI absorption along the line-of-sight to each target galaxy was estimated using the script available at http://heasarc.gsfc.nasa.gov/cgi-bin/Tools/w3nh/w3nh.pl, based on data reviewed in Dicky & Lockman (1990). Attempts to fit the absorption column produced uncertain results, consistent with zero absorption. Since we know that there is absorption through our Galaxy, we generally fix this in the absorption component. The results of one and two component fits are given in Tables 3 and 4 for NGC 4382 and NGC 5363 respectively. Best fit 2-component spectral models are shown in Fig. 3.
| Within 4re diameter | |||||||
|---|---|---|---|---|---|---|---|
| nH | kT1 | Ab1 | Flux1 | PL | dof | Total Flux | |
| cm-2 | keV | Solar | 0.3-7keV | index | 0.3-7keV | ||
| Single component model | |||||||
| 0.0251=Gal | 0.3790.007 | 1.0 | 3.37 | 280 | |||
| 0.000.028 | 0.4570.012 | 1.0 | 3.49 | 279 | |||
| 0.0251=Gal | 0.5190.012 | 0.0820.006 | 2.04 | 279 | |||
| Two component model | |||||||
| 0.0251=Gal | 0.3890.013 | 1.0 | 2.07 | 2.100.07 | 1.21 | 278 | 5.03 |
| 0.0251=Gal | 0.4090.015 | 0.1510.029 | 3.05 | 1.470.15 | 1.15 | 277 | 5.29 |
| Two interesting parameters: | 0.15 to 3 | 1.4 to 2.2 | (, i.e. 1 range) | ||||
| Three component model | |||||||
| 0.0251=Gal | 0.4060.016 | 1.0 | 1.740.10 | 1.16 | 276 | ||
| 1.0 | |||||||
| Within D25 diameter | |||||||
| nH | kT1 | Ab1 | Flux1 | PL | dof | Total Flux | |
| cm-2 | keV | Solar | 0.3-7keV | index | 0.3-7keV | ||
| Single component model | |||||||
| 0.0251=Gal | 0.3680.007 | 1.0 | 2.26 | 488 | |||
| 0.000.04 | 0.3820.014 | 1.0 | 2.23 | 487 | |||
| 0.0251=Gal | 0.4890.012 | 0.0750.005 | 1.53 | 487 | |||
| Two component model | |||||||
| 0.0251=Gal | 0.3890.014 | 1.0 | 3.03 | 2.220.07 | 1.19 | 486 | 7.77 |
| 0.0251=Gal | 0.4110.016 | 0.1090.015 | 5.18 | 1.180.17 | 1.14 | 485 | 8.66 |
| Three component model | |||||||
| 0.0251=Gal | 0.3980.015 | 1.0 | 1.680.12 | 1.16 | 484 | ||
| 1.0 | |||||||
| Within 4re diameter | |||||||
| nH | kT1 | Ab1 | Flux1 | PL | dof | Total Flux | |
| cm-2 | keV | Solar | 0.3-7keV | index | 0.3-7keV | ||
| Single component model | |||||||
| 0.0208=Gal | 0.9690.021 | 1.0 | 7.45 | 137 | |||
| 0.0000.037 | 0.9820.021 | 1.0 | 7.35 | 136 | |||
| 0.0208=Gal | 1.0530.041 | 0.0440.009 | 3.54 | 136 | |||
| Two component model | |||||||
| 0.0208=Gal | 0.6030.024 | 1.0 | 0.51 | 1.690.05 | 1.30 | 135 | 2.55 |
| 0.0208=Gal | 0.6090.025 | 0.1710.059 | 0.84 | 1.430.13 | 1.28 | 134 | 2.57 |
| Three component model | |||||||
| 0.0208=Gal | 0.6600.043 | 1.0 | 1.520.07 | 1.23 | 133 | ||
| 0.2440.081 | 1.0 | ||||||
| Within D25 diameter | |||||||
| nH | kT1 | Ab1 | Flux1 | PL | dof | Total Flux | |
| cm-2 | keV | Solar | 0.3-7keV | index | 0.3-7keV | ||
| Single component model | |||||||
| 0.0208=Gal | 0.9950.019 | 1.0 | 3.88 | 330 | |||
| 0.0000.016 | 5.760.434 | 1.0 | 2.05 | 329 | |||
| 0.0208=Gal | 1.750.011 | 0.0000.039 | 1.70 | 329 | |||
| Two component model | |||||||
| 0.0208=Gal | 0.6100.031 | 1.0 | 0.69 | 1.790.05 | 1.18 | 328 | 4.37 |
| 0.0208=Gal | 0.6290.028 | 0.0650.015 | 1.85 | 1.060.15 | 1.12 | 327 | 4.78 |
| Three component model | |||||||
| 0.0208=Gal | 0.6700.034 | 1.0 | 1.420.08 | 1.08 | 326 | ||
| 0.1980.025 | 1.0 | ||||||
To check our simple background subtraction technique we also tried the double background subtraction method (described by Arnaud et al. 2002). The background spectrum thus generated looked very similar to our simple background spectrum, but with more noise at high energies. The 17% vignetting of photon events expected in the background annulus is a much smaller fraction of the total background, since the background was still dominated by particles even after cleaning and clipping. Trials with this double subtraction led to very similar thermal component parameters, but noisy power-law parameters. Therefore, given the uncertainties in the background we retain our analysis with the simpler background estimate. This samples the X-ray background from the same time as the source was observed, minimising temporal changes.
Tables 3 and 4 show the following results for the spectral fits:
-
1.
Single component models (wabsmekal or wabspowerlaw) are ruled out for both NGC 4382 and NGC 5363, from the high reduced chi-squareds and from visual inspection of the systematic residuals.
-
2.
Two component models (wabs(mekal+powerlaw)) can almost fit the data (reduced chi-squareds 1.1 to 1.3). Adding another mekal model does not lead to significantly better fits.
-
3.
Residuals in the two component fits appear at specific energies (between 1 and 2 keV, and at 5 keV - see Fig. 3). These are probably due to small residuals from fluorescence lines generated in the EPIC cameras, described in the XMM-Newton Users Handbook.
-
4.
The column density (nH) is fixed at the Galactic values, since attempts to fit this resulted in zero column density, which is physically unrealistic.
-
5.
The temperature of the mekal component is well constrained, especially in NGC 4382, even when assumptions are changed about the metallicity of the hot gas component.
-
6.
The index of the power-law and the abundance in the mekal model can mimic similar fits to the low energy data. Therefore these two parameters are not individually well constrained. This is illustrated by the results of stepping through these two parameters in the case of NGC 4382, for data within a diameter of 4re: adequate fits include abundance Ab1=0.15 (relative to solar) and power-law index PL=1.4, through to Ab1=3 (or greater) and PL=2.2. These results are shown for NGC 4382 under the heading of “Two interesting parameters:” in Table. 3. The range of acceptable fits is given, allowing for two interesting parameters and thus of above the minimum. The power-law index is separately constrained to be PL1.7 from visual inspection of the high energy data in the spectrum, which shows systematic deviations from the model for poor fits to the power-law component.
-
7.
The overall proportions of flux in the hot gas component, after correcting for Galactic absorption, are: 0.60 for NGC 4382 and 0.39 for NGC 5363. Therefore NGC 4382 contains proportionally more gas than NGC 5363, which is dominated by the power-law component describing stellar contributions (e.g. Matsushita et al. 1994). Therefore there is little evidence of large quantities of hot gas in NGC 5363.
So, in summary these data need at least two components and the MEKAL temperature is quite well constrained. To estimate the hot gas mass associated with the MEKAL component we need to measure radial temperature changes and deproject the observed X-ray brightness profile. Of the three galaxies analysed here this is only possible for NGC 4382, since that observation has enough counts to do so and it has a large proportion of its X-ray flux in the MEKAL component. Thus in Section 4 we aim to use the X-ray properties to estimate the gas and overall mass distribution in NGC 4382. Table 5 summarises the best 2-component fits for our target galaxies.
3.2 Chandra spectrum
Examining the lightcurve from chip 7 (the back illuminated CCD) we find only a small enhancement of the count rate so we analyse the entire observation here. The background was obtained from a circle just outside the D25 radius near the centre of the chip. We also used the blank sky backgrounds to fit the spectra and found no significant difference in the fits. All detectable point sources were excluded from both source and background spectra, using a region size appropriate for the off-axis angle of the source. Finally, the extracted spectra were rebinned so that each channel has a minimum of 25 counts. We also investigated the effects of using background spectra extracted from regions further from the galaxy centre, which reduces any possible contamination of the background from the galaxy, but increases the vignetting correction; no significant difference was found in the results.
Data was extracted from a diameter of 8re, excluding the central 2 arcsecs radius (95% of the encircled point source energy) so that the diffuse gas is not contaminated by the central point source. A pure MEKAL model with Galactic absorption can be rejected with a reduced chi-squared of 1.88 for 23 dof. The pure power-law model can be rejected with a reduced chi-squared of 1.45 for 24 dof. A model with wabs*(mekal + brems) yields a best fit temperature for the MEKAL component of 0.32 keV with 90% confidence, with the abundance only constrained to be above 0.14 solar. The reduced chi-squared is 0.86 for 22 dof. The higher energy component was fixed at 7.3 keV bremsstrulung emission, representing LMXBs (Irwin, Athey & Bregman 2003). The total absorbed flux is ergs cm-2 s-1 in the 0.3 to 7 keV range (unabsorbed flux is ergs cm-2 s-1). The absorption was fixed at the Galactic value (nH=6.5) and there are 687 source counts.
The spectrum for the central source in NGC 2865 was extracted using an aperture that encloses 95% of the encircled energy (2 arcsec radius) and the spectrum was binned so that each channel has a minimum of 20 counts. The background region is far enough from the galaxy so that no counts from the diffuse emission are included. Since the extraction region for the central source contains diffuse emission from the galaxy we fit the point source with a power-law plus a thermal plasma model. Since we only have 127 counts in this spectrum we fix the parameters of thermal plasma model to the value found above and only allow its normalisation to vary. The power-law components are then fitted resulting in a power-law index of 1.67 with = 0.21 for 3 dof. The absorbed flux from the power-law component is ergs cm-2 s-1 (unabsorbed flux is 10-14 ergs s-1 cm-2).
There is also a region of more extended diffuse X-ray emission to the left of, and separate from NGC 2865, which has no clear optical counterpart in the DSS image. It was first found as an unidentified X-ray source in the ROSAT All Sky Survey, Bright Source Catalogue (Voges et al. 1999) and is called 1RXS J092344.1-230858. The source is clearly extended and appears to have a double peaked core. The spectrum was extracted using an elliptical region centred at 09:23:43 -23:08:51.64 (J2000) with a major axis of 115 arcsec and 75 arcsec minor axis with PA. 145 deg. This is slightly offset from the peak of the extended diffuse emission (9:23:44.5, -23:08:59.5) to avoid the edge of the chip. The spectrum was fit with an absorbed thermal spectrum (wabs*apec) with wabs column fixed at nH= cm-2 and the abundance fixed to 0.3 solar. The temperature and the redshift were then fitted yielding kT= 6.4 with a redshift of 0.2335. The goodness of fit was 0.65 for 165 dof. The luminosity is ergs s-1 for the redshift given above. Given the luminosity and extended nature of the source this is most likely a galaxy cluster. This offset diffuse emission is not included in our assessment of the X-ray emission from NGC 2865.
Summing the central and diffuse emission from NGC 2865 gives an overall absorbed flux of erg s-1 cm-2 (unabsorbed flux of erg s-1), including the diffuse flux in the central region. NGC 2865 is quite a weak X-ray source in comparison to some other ellipticals, as will be shown in Section 5.
| Galaxy | nH | kT1 | Ab1 | PL index | |
| (1022 cm-2 | (keV) | (Solar) | |||
| NGC 4382 | 0.0251 | 0.411 | 0.109 | 1.18 | 1.14 |
| NGC 5363 | 0.0208 | 0.629 | 0.065 | 1.06 | 1.12 |
| NGC 2865 | 0.0650 | 0.320 | 7.3 keV brems | 0.86 |
4 Mass distribution in NGC 4382
Under the assumption of hydrostatic equilibrium, it is possible to estimate the distribution of mass and other properties (entropy, cooling time, etc.) based on the temperature and density of the gaseous halo. We therefore extracted spectra from four radial bins and fitted them to determine the temperature distribution, and fitted the radial surface brightness profile, from which gas density can be calculated. It is difficult to be certain whether the gas is in fact in hydrostatic equilibrium, but the X-ray image of NGC 4382 appears to be indicate a relatively smooth distribution, suggesting that its halo is undisturbed.
For the radial temperature profile, bins were chosen to have similar
numbers of source counts, slightly increasing in larger radial bins to
allow for the increased fraction of flux in the background. A bright point
source in the outermost radial range was removed for these thermal flux and
temperature determinations (see Fig. 1 top right in inner circle). The
results of spectral fitting in 4 radial bins are shown in Table 6. These
are for wabs(mekal+powerlaw) 2-component fits, with nH=
cm-2 (Galactic column) fixed and power-law index PL=1.7 fixed (from
inspection of the spectrum above 3 keV and previous fits). This value of
the power-law index describing the stellar contributions to the X-rays is
similar to that found from fits to ASCA data for elliptical galaxies
(PL=1.82 0.1, White et al. 2002) and from Chandra data for NGC 4382
specifically (1.52, Sivakoff et al. 2003). Temperatures and
abundances are fitted and 1-sigma errors are given.
| Radial | Source | % of | kT | Ab | (dof) | Total | MEKAL | MEKAL flux |
|---|---|---|---|---|---|---|---|---|
| range | counts | total | (keV) | (Solar units) | flux | flux | (unabsorbed) | |
| 0 - 0.5re | 1539.9 | 93 | 0.495 | 0.318 | 1.13 (73) | 1.24 | 0.464 | 0.53 |
| 0.5re - re | 1858.7 | 85 | 0.435 | 0.134 | 1.07 (94) | 1.62 | 0.764 | 0.90 |
| re - 2re | 2365.0 | 65 | 0.366 | 0.173 | 1.26 (149) | 1.79 | 1.13 | 1.33 |
| 2re - 0.5D25 | 2057.3 | 34 | 0.379 | 0.111 | 1.09 (258) | 1.61 | 1.17 | 1.39 |
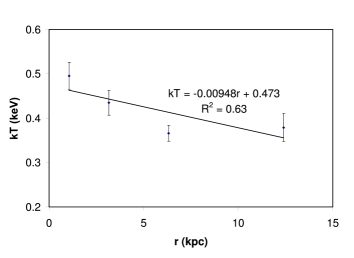
A radial temperature gradient was estimated from these results by fitting a straight line through the temperature points. This gave: keV (for radius in kpc). Fig. 4 shows a plot of the temperature profile and linear fit. A 2nd order polynomial fits better, but is probably unrealistic at large radii, since the slight increase in temperature in the outer bin (which is not statistically significant) leads to an upturn in the polynomial model, which in turn leads to an unphysical flattening of the mass profile.
The unabsorbed, thermal component flux of NGC 4382 within D25 diameter is estimated to be erg cm-2 s-1 (assuming PL=1.7). For a distance of 15.9 Mpc the total unabsorbed luminosity of the thermal component only is then erg s-1. The normalisation for the MEKAL component is: , with units as defined in the on-line XSPEC manual.
The X-ray surface brightness profile was estimated by simultaneous fitting of our XMM-Newton data and the archival Chandra data for NGC 4382. This provides the useful combination of high spatial resolution in the core from the Chandra data and high sensitivity from the XMM-Newton data, which allows the outer, low surface brightness regions to be defined more precisely. The Chandra profile was based on an exposure corrected 0.3-2 keV ACIS-S3 image with point sources and background subtracted. For XMM-Newton a 0.3-3 keV exposure corrected image was used, with point sources subtracted but not background. This background level was instead modelled out during fitting. Circular annuli were used in both cases. The maximum diameter is D25 and minimum diameter is 2 arcsec based on Chandra spatial resolution. PSF convolution was included in the XMM-Newton fit. Appropriate PSF images for each camera were extracted from the calibration database, the images were summed, and a radial profile taken. The fitting was carried out in ciao sherpa using this profile as the PSF model. PSF convolution was not included in the Chandra fit, as the Chandra on-axis PSF is very narrow. Prior experience with similar datasets has shown that PSF convolution has no significant effect on the fit.
Initial fitting showed that a single beta model provided a poor
approximation to the data (reduced 3.27 for 85 dof, see
Fig. 5). Adding a second beta model produces an improved fit (see Fig. 5),
with reduced of 1.65 (82 dof). Addition of a central point
source is not favoured by the fit, demonstrating that the central component
is extended. The remaining residuals appear to be largely noise related,
rather than indicating the need for an additional component, so we have not
attempted fits with more complex models. The best fit parameters for the
core radii () and values, with 1
errors, were:
= 28.41′′
= 0.445
= 1.99′′
= 0.602
The outer component has a slightly smaller core and flatter than the fit found by Sivakoff et al. (2003) for the Chandra data alone. Here the fit is better constrained, mainly because of the XMM-Newton data at large radii. The addition of a second component also helps define the core of the more extended component more accurately. The fitted surface brightness profile is shown in Fig. 5, incorporating two beta models and a constant background level.


Our technique for calculating the mass profile based on these results is described in O’Sullivan & Ponman (2004b) and O’Sullivan et al. (2005). Profiles of total mass, gas mass, gas entropy and cooling time are all estimated from the temperature and density profiles. The error on each parameter is estimated through a monte-carlo process in which the measured errors on temperature and surface brightness profiles, and other parameters such as total luminosity, are used to vary the input parameters. The mass-to-light ratio (M/L) is calculated by assuming the optical surface brightness distribution is circular, follows a de Vaucouleurs profile, and is normalised to match the B-band luminosity.
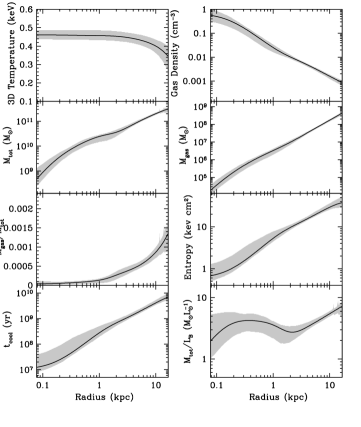
Fig. 6 shows the reconstructed properties as a function of radius assuming a linear temperature profile. We can compare NGC 4382 with NGC 4555, an elliptical with an extensive hot gas halo, which is very isolated and therefore likely to be relaxed and undisturbed. (O’Sullivan & Ponman 2004b). The gaseous halo of NGC 4382 is both cooler and less dense than that of NGC 4555, and we find the gas mass within 10 kpc to be a factor of 4 lower than that of NGC 4555 (1.8108 M⊙ compared to 7.7108 M⊙). The total mass of NGC 4382 within the same radius (2 M⊙) is also smaller by a similar factor, leading to almost identical values of gas fraction, entropy and cooling time in the two systems, at a given radius. However, the mass-to-light ratio of NGC 4382 is rather lower than that of NGC 4555, particularly within 10 kpc (5.4 M⊙/L⊙ compared to 14.7). One might expect M/L 3 to 5 from stars alone (e.g. Sparke & Gallagher 2000), and the M/L ratio in the inner part of the galaxy is comparable to this, indicating that stars dominate the mass within a kpc radius. However, from Fig. 6 there appears to be additional gravitating mass further out from the centre of NGC 4382 since the M/L ratio increases constantly beyond kpc radius, reaching a maximum values of M/L7.5 at 4re. We therefore expect that were we to be able to extend the mass profile to larger radii, we would find a total NGC 4382 M/L ratio more typical of elliptical galaxies, though perhaps lower than that of NGC 4555.
Recently, orbital modelling of planetary nebulae in some moderate luminosity, early-type galaxies (NGC 821, NGC 3379, NGC 4494, Romanowsky et al. 2003) has suggested that they have very low M/L ratios out to 5Re. This may indicate that these ellipticals have either little dark matter, or that their dark matter halos take a radically different form to that predicted by the standard CDM structure formation models. However, the mass estimated for these galaxies is dependent on the choice of orbital models, and these have been challenged (Dekel et al. 2005). Simulations of merging spirals suggest that the orbits in the outer part of the resulting post-merger elliptical are much more radial than was previously expected. If such orbits are assumed when estimating the mass of the Romanowsky ellipticals, a larger M/L ratio is found, consistent with a normal dark matter halo. Modelling of the X-ray halo provides an alternative method of measuring mass, and therefore in principle could be used to resolve this issue. However, the three Romanowsky ellipticals are all X-ray faint. In the case of NGC 821, its X-ray luminosity is so low that no useful limit can be placed on its gas content (Fabbiano et al. 2004). Low gas content could be related to a number of factors; lack of a dark matter halo could make it difficult for a galaxy to retain a gaseous halo, but ram-pressure or tidal stripping, AGN activity or starburst driven winds could also remove much of the gas. Wind activity following a merger-induced starburst is the likely cause of the lack of hot gas in post-merger galaxies. NGC 4382 has a comparably low X-ray luminosity, but its optical luminosity (MB=-21.01 mag) is nearly twice as bright as the M mag galaxies in Romanowsky et al. NGC 4382 also has a younger luminosity weighted age. The three intermediate luminosity ellipticals studied by Romanowsky et al. were not very young (with ages of 7.2, 9.3 and 6.7 Gyr for NGC 821, 3379 and 4494 respectively) from TF02. From these results it does not seem that optical spectroscopic youth is related to a lack of massive, dark-matter halo. However, more systems and deeper observations are needed to check this, and a number of projects are underway to investigate this issue.
5 X-ray emission versus age
In this section the data for the three galaxies is set in context with published data, for galaxies with estimated ages. We discuss the benefits and drawbacks of different age estimators. The motivation for looking at age dependencies is to see how the gas evolves in early-type galaxies. Ellipticals may be produced from mergers of spiral galaxies (e.g. Bournaud, Jog & Combes, 2005). The observational evidence to support this idea is summarised by Schweizer (1998). Tidal features occur around elliptical galaxies that show other evidence of youth in their optical spectra, colours and disturbed morphology of their outer isophotes. Using ROSAT data Fabbiano & Schweizer (1995) found that two such dynamically young ellipticals were X-ray faint compared with other ellipticals. Later Mackie & Fabbiano (1997, 32 galaxies) and Sansom, Hibbard & Schweizer (2000, 38 galaxies) showed that young early-type galaxies are X-ray faint generally. They used the age indicator of Schweizer & Seitzer (1992), based on morphological fine structure. Disturbed morphology is not an accurate indicator of age, since it depends on the details of the merger event that the progenitor galaxies went through. OFP01a investigated normalised X-ray luminosity (Log(LX/LB) versus spectroscopically determined age drawn from the Age Catalogue of TF02, for a sample of 42 early-type galaxies. They confirmed the trend with age. This trend has large scatter, the cause of which is not clearly understood. There are many ideas about why there should be such a large scatter in Log(LX/LB), including tidal interactions, ram-pressure stripping, different states of ISM dynamics (inflows, outflows or winds) that would strongly affect the X-ray luminosity (e.g. D’Ercole, Recchi & Ciotti 2000). Here this trend is revisited, also incorporating data for ongoing mergers plus some data from more recent X-ray missions, including the three galaxies studied in this paper. By including pre- and post-merger systems in this analysis, the evolution of the X-ray emission can be better set into context with the behaviour of the progenitor galaxies.
5.1 Data and sources
The compilations of data from OFP01b and TF02 are used, giving data for 83 early-type galaxies with known X-ray luminosities (or upper limits) and spectroscopic age estimates respectively. The X-ray luminosity is a bolometric luminosity, extrapolated from fits mainly to ROSAT data and assuming a 1keV MEKAL model with solar abundance. Thus these X-ray luminosities assume the galaxies to be dominated by a thermal component. They are corrected for Galactic absorption. The spectroscopic age estimate is a luminosity weighted average age of the stars in a galaxy. Spectroscopic age indicators have the advantage of being able to probe back somewhat further in time than dynamical or morphological age indicators (several Gyr as opposed to 1 Gyr), however, they have the drawback of only being sensitive to the age of the stars, therefore a recent merger of stellar systems in which no new star formation took place would not be detected this way. Ages estimated from spectroscopic absorption line strengths are difficult to use on system younger than about 1Gyr, since the contamination from warm gas emission is often too great. TF02 systematically estimated ages for a large number of galaxies, using only four spectral line-strengths. Proctor & Sansom (2002) showed that accuracy of age estimates could be improved by using many spectral features at once. However, there are few such observations. Therefore we include here the large number of galaxies from the above compilations.
In addition to E and S0 galaxies, data for ongoing mergers with measured X-ray luminosities and estimated ages were compiled (Table 7). The ages of these galaxies were estimated from dynamical and morphological indicators. These age indicators are useful for young systems, but they fade over timescales of Gyrs (e.g. Sansom, Reid & Boisson 1988; Schweizer 1998; Brown et al. 2000). Read & Ponman (1998, hereafter RP98) measure X-ray luminosities in 8 ongoing mergers. They give age estimates for these systems relative to zero at the time of nuclear coalescence, characterised by the galaxy Arp220. Therefore galaxies at earlier stages of merging than this have negative ages in Table 7. They measure X-ray properties from ROSAT observations.
Fricke & Papaderos (1999, hereafter FP99) discuss the X-ray emission from 22 interacting systems based on ROSAT data, including some systems from RP98. They set them onto a qualitative merging sequence. In Table 7 we have assigned approximate ages based on this sequence and its relation to the age estimates of RP98. These age estimates are only approximate, but span about the right range in pre- and post-merger ages, when guided by the systems such as Arp270, NGC 4038/9, Arp220 and NGC7252 which have been modelled dynamically (Mihos, Bothun & Richstone 1993; Hibbard & Mihos 1995; Mihos & Hernquist 1996; Mihos, Dubinsky & Hernquist 1998). A colon indicates these age estimates from ordering in FP99, rather than absolute age estimates. As a check on ages, in Table 7 we also indicate any cases with dynamical age estimates from Xilouris et al. (2004a). We find that the estimates generally agree well, typically within 0.1 Gyr. NGC 7252 is estimated to be somewhat younger by Xilouris et al. than in RP98, but given the inherent errors involved, the difference is probably not significant.
We have renormalised the Log(LX/LB) values from FP99 by adding a constant to their plotted values. This is to try to match our assumption about the blue luminosity of the Sun, as used for all the other data points plotted in Fig. 7. This correction is explained next. It is uncertain since it is not clear what values were used initially by the authors whose results we are using. In table 1 of RP98, they give large values for Log(LB) in units of ergs s-1, for which they appear to have assumed that the blue luminosity of the Sun is the same as the total luminosity of the Sun. This incorrect assumption appears to partly translate to the Log(LX/LB) values given in FP99. We have attempted to correct for this, to get all Log(LX/LB) values onto a correct dimensionless scale. To illustrate this correction, we take for in Mpc and . Then, assuming that the B band luminosity of the Sun is erg s-1 (OFP01b), we can extract optical luminosities in erg s-1 for the galaxies. Doing this, and comparing with the B band luminosities and Log(LX/LB) ratios given in RP98, and FP99, we estimate that a correction of +0.61 is required to the Log(LX/LB) values plotted in FP99, to get them onto a correct scale. In Table 7 we have applied this correction.
Keel & Wu (1995) estimated dynamical ages for 35 ongoing merger candidates. They put them into an evolutionary sequence and estimated dynamical stages in terms of crossing times, using morphology and kinematics. A literature search reveals that their sample is not well studied in X-rays, therefore we cannot incorporate any more cases from Keel & Wu into this present study. However for 8 systems in common their ordering is the same as in Table 7, providing independent support for the age ordering given in Table 7.
| Galaxy | Age | Ref. | |
| (Gyr) | |||
| NGC 2342 | -0.85: | FP99 | -2.29 |
| NGC 2341 | -0.8: | FP99 | -2.09 |
| NGC 2993 | -0.75: | FP99 | -1.86 |
| Arp 102a | -0.7: | FP99 | -1.89 |
| Arp 284 | -0.65: | FP99 | -1.84 |
| Arp 270 | -0.6 | RP98 | -2.69 |
| Arp 242 | -0.5 | RP98 | -2.34 |
| Arp 299 | -0.47: | FP99 | -2.29 |
| Mk 1027 | -0.43: | FP99 | -2.09 |
| NGC 4038/9 | -0.4/-0.25 | RP98/Xea04 | -2.19 |
| Arp 278 | -0.3: | FP99 | -2.41 |
| NGC 520 | -0.2/-0.19 | RP98/Xea04 | -2.99 |
| Arp 215 | -0.171: | FP99 | -2.29 |
| NGC 3310 | -0.143: | FP99 | -2.19 |
| Mk 789 | -0.114: | FP99 | -2.09 |
| Mk 266 | -0.086: | FP99 | -1.69 |
| NGC 6240 | -0.057:/-0.03 | FP99/Xea04 | -1.29 |
| Mk 231 | -0.029: | FP99 | -1.84 |
| Arp 220 | 0.0/0.0 | RP98/Xea04 | -2.19 |
| NGC 2623 | 0.1/0.16 | RP98/Xea04 | -2.24 |
| NGC 7252 | 1.0/0.24 | RP98/Xea04 | -2.94 |
| AM1146-270 | 1.5 | RP98 | -2.69 |
| A colon indicates approximate ages from ordering in FP99 | |||
| Galaxy | D | Age | Ref. | BT | X-ray flux | X-ray band | Ref. | |
|---|---|---|---|---|---|---|---|---|
| (Mpc) | (Gyr) | (Ages) | (mag.) | (erg s-1 cm-2) | (keV) | (X-rays) | ||
| NGC 4382 | 15.9 | 1.6 | TF02 | 10.00 | -2.89 | 0.3-7.0 | This work | |
| -2.80 | 0.3-10.0 | SSI03 | ||||||
| NGC 5363 | 15.8a | 6.7 | This work | 11.05 | -2.73 | 0.3-7.0 | This work | |
| NGC 2865 | 36.5 | 1.0/1.5 | Hea99/TF02 | 12.57 | -2.80 | 0.5-10.0 | This work | |
| NGC 4365 | 15.9 | 9.7 | PS02 | 10.52 | -2.67 | 0.3-10.0 | SSI03 | |
| NGC 3585 | 16.07c | 3.1 | TF02 | 10.88 | -3.32 | 0.2-8.0 | OP04a | |
| NGC 4494 | 21.28c | 7.5/6.7 | This/Dea05 | 10.71 | -3.18 | 0.2-8.0 | OP04a | |
| NGC 5322 | 27.80 | 4.2/2.4 | PS02/Dea05 | 11.14 | -2.92 | 0.2-8.0 | OP04a | |
| NGC 3921 | 72.8 | 0.7 | S96 | 13.06 | -2.04 | 0.5-10.0 | Nea04 | |
| NGC 7252 | 52.5 | 1.0/0.8 | RP98/HM95 | 12.72 | -2.64 | 0.5-10.0 | Nea04 | |
| NGC 1600 | 59.98 | 6.9 | TF02 | 11.93 | -1.97 | 0.3-10.0 | SSC04 | |
| NGC 1700 | 50.58 | 2.3 | TF02 | 12.20 | -2.53 | 0.3-2.7 | SM02 | |
| NGC 4636 | 15.9 | 8.2 | PS02 | 10.43 | -1.21 | 0.5-4.0 | Mea98 | |
| NGC 5102 | 3.1 | 3.0 | Kea05 | 10.35 | -3.98 | Bolometric | OFP01b | |
| NGC 4473 | 16.14 | 9.4 | CRC03 | 11.16 | -2.61 | Bolometric | OFP01b | |
| NGC 4621 | 15.92 | 17.3 | CRC03 | 10.57 | -3.06 | Bolometric | OFP01b | |
| NGC 3256 | 35.4 | Jea04 | 12.15 | -1.97 | 0.3-10.0 | Jea04 |
TF02 = Terlevich & Forbes (2002)
Hea99 = Hau et al. (1999)
PS02 = Proctor & Sansom (2002)
Dea05 = Denicoló et al. (2005)
S96 = Schweizer (1996)
HM95 = Hibbard & Mihos (1995)
Kea05 = Kraft et al. (2005) (for age and distance)
CRC03 = Caldwell, Rose & Concannon (2003)
Jea04 = Jenkins et al. (2004)
SSI03 = Sivakoff, Sarazin & Irwin (2003)
OP04a = O’Sullivan & Ponman (2004a)
Nea04 = Nolan et al. (2004) (nuclear regions plus hot diffuse gas)
SSC04 = Sivakoff, Sarazin & Carlin (2004) (unresolved sources plus gas)
SM02 = Statler & McNamara (2002)
Mea98 = Matsushita et al. (1998)
a = Distance from Tully (1988)
c = Distances incorrectly reversed in OP04a
The data for early-type galaxies from OFP01b is supplemented here with more recent X-ray data for some galaxies, and for some galaxies with more accurately measured ages. These results from more recent observations for some systems are indicated in Table 8. No attempt has been made to correct for the different X-ray wavebands since such corrections are very dependent on the accuracy of fitted parameters, especially when extrapolating to broader wavebands. Instead we have tried to include results quoted from broad wavebands, where possible.
Of the three early-type galaxies analysed in this paper, NGC 4382 is well established as having a young, luminosity weighted age (1.6 Gyr 0.3) from a fit to four optical spectral line-strengths (H and the combination index [MgFe]) by TF02. This galaxy has strong H and higher order Balmer lines in absorption, indicative of a young stellar population. Similarly NGC 2865 has strong H and a young age (Hau et al. 1999). NGC 5363 was originally thought to be another very young early-type galaxy, from the strength of its H absorption. Denicoló et al. (2005) estimated its age from fits utilising 4 indices and found 3.8 Gyr. To try to reduce the uncertainty on this age estimate (and age estimates for other galaxies in their sample) we fitted many more optical line-strengths, from the data of Denicoló et al. For NGC 5363 we found 6.7 0.5 Gyrs. Therefore this galaxy, although relatively young, is not as young as originally thought. This gives a typical illustration of the inherent difficulties in determining spectroscopic ages of galaxies (e.g. Trager 2004). In the current compilation of data (Table 8, Fig. 7 and Fig. 8) we use this latter age estimate. Total unabsorbed X-ray fluxes are given in Table 8.
There are 23 other galaxies in the Denicoló et al. sample that have X-ray measurements. We fitted these, using the line-strength indices measured by Denicoló et al. to determine accurate luminosity weighted ages. Between to 17 optical indices were fitted with single-age, single-metallicity stellar population models of Thomas, Maraston & Korn 2004. The statistic was minimised to derive luminosity weighted ages, metallicities and -element abundance ratios. The rational for using as many spectral line-strengths as possible is that, while all indices show some degeneracy with respect to age and metallicity, each index contains some information regarding each parameter.
For fitting the Denicoló et al. sample, indices redward of Fe5046 were generally excluded. These indices are often problematic for a variety of observational reasons (e.g. inter-stellar absorption in NaD, flux calibration issues for TiO indices) and, in this case, showed large residuals to the best fits. The poorly modelled G4300 was also excluded for similar reasons. For the remaining indices an (approximately) 3-sigma clipping process was employed. This resulted in, typically, 1 or 2 indices per galaxy being removed from the fitting procedure (an average of 1.6 indices per galaxy). Of these, more than 50% were associated with known problems (e.g. emission-line filling of the H index, low sensitivity and poor sky-subtraction in indices redward of 5500 Å and the flux-calibration sensitivity of the Mg1 and Mg2 indices). In any case, the derived log(age) and metallicities were highly robust with respect to the clipping procedure, generally changing by no more than 0.1 dex from the values obtained when all available indices are included (i.e. with no clipping). See Proctor et al. 2004 for details of the clipping procedure. The resultant fits therefore typically included between 10 and 17 indices (note Denicoló did not measure all indices, in all galaxies) and showed reduced- values of order 1.5. Errors were derived from 100 Monte Carlo realisations of the best fit model data. These newly derived, luminosity weighted ages are plotted in Figs. 7 and 8.
Other early-type galaxies have been observed with recent X-ray missions. Sivakoff, Sarazin & Irwin (2003) observed two X-ray faint ellipticals (NGC 4382 and NGC 4365) with Chandra. Total fluxes were obtained from their Tables 3 and 4, within 6re diameter, assuming a power-law for the hard component. Published results also include O’Sullivan & Ponman (2004a), who analysed XMM-Newton and Chandra data for three X-ray faint, early-type galaxies (NGC 3585, 4494, 5322). Two merger-remnant galaxies, NGC 3921 and NGC 7252, were observed by Nolan et al. (2004), with XMM-Newton. They give luminosities for nuclear regions, extended hot gas, and other X-ray point sources. In Table 8 we have combined their nuclear and extended hot gas components to determine an overall flux from each of these two galaxies. Sivakoff, Sarazin & Carlin (2004) observed NGC 1600 with Chandra. We have summed their hot gas plus unresolved source components to get the overall X-ray flux from this galaxy, as given in Table 8. Statler & McNamara (2002) obtained Chandra observations of the extended disk-like, X-ray structure in the elliptical galaxy NGC 1700. The total flux from their work is given in Table 8. Deep exposure observation of NGC 4636 were taken with the ASCA satellite by Matsushita et al. (1998). NGC 4636 is an X-ray luminous elliptical galaxy with very extended X-ray emission. They fit two components to the Chandra surface brightness profile for NGC 4636, out to a radius of 60 arcminutes and give the total luminosity in the broader component as 8.1 erg s-1. They say that this exceeds their compact component by a factor of 5. In Table 8 we have summed the flux from these two beta components, for NGC 4636. New estimates of spectroscopic ages are available for the lenticular galaxy NGC 5102 (Kraft et al. 2005) and two galaxies from the sample of Caldwell, Rose & Concannon (2003) (NGC 4473 and NGC 4621). Jenkins et al. (2004) obtained XMM-Newton observations of the starburst merger galaxy NGC 3256, which is thought to be the product of two gas-rich galaxies of roughly equal size, from the morphology and ongoing star formation. It is at a similar evolutionary stage to that of Arp 220. The X-ray flux and age estimate for NGC 3256 is included in Table 8, from Jenkins et al. The data in Table 8 are included in Fig. 7 and Fig. 8.
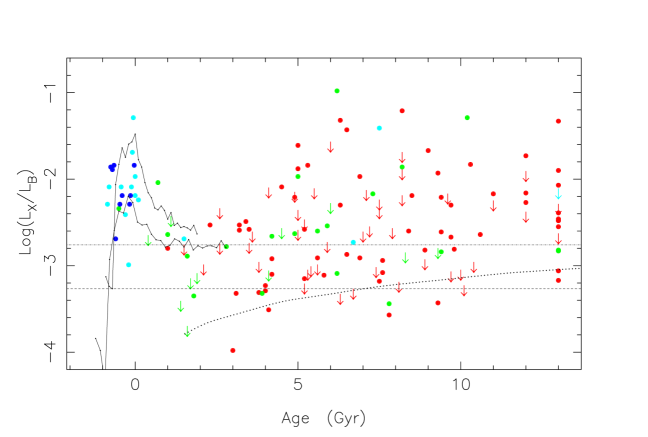
Predictions of X-ray luminosity changes through the evolution of a major merger of two spiral galaxies have been made by Cox et al. (2005). We use their simulation of X-ray luminosity over 3 Gyrs (data provided by T.Cox, private communication) to estimate total Log(LX/LB) versus age. Zero age corresponds to 1.1 Gyrs in their simulation, since this is the time of nuclear coalescence. We have taken LB to be constant with age and equal to the average value for the galaxies plotted in Fig. 7 at Gyr (LB=8.8309 erg s-1). A constant discrete source contribution is added to the X-ray emission, estimated at L erg s-1, from Log(LX(dscr)/LB)=29.45 (erg s-1 LB⊙) given in OFP01b. This discrete source contribution was estimated from the lower envelope of LX versus LB emission in early-type galaxies, assuming unity slope (see OFP01b for details). Although the optical luminosity is unlikely to remain constant over the 3 Gyrs pre- and post-merger, we detected no strong systematic change in LB with age, for our plotted galaxies, as there is a large spread in LB at all ages in this sample. The discrete X-ray source contribution is also likely to vary somewhat over this time, but we currently have little information about this. We know that high-mass X-ray binaries (HMXBs) should give a boost to LX around the time of the merger, but the evolution of the LMXB population is not known. A more systematic spectral analysis of the X-ray data would be required to investigate this issue, incorporating two components for many galaxies. The colour coding in Fig. 7 indicates the different Hubble types. A dearth of luminous X-ray sources is evident for both elliptical and S0 classifications, in the post-merger age range of 1 to 4 Gyrs.
The model curve plotted in Fig. 7 (upper solid line) fits reasonably well to the ongoing merger data, and predicts slightly more hot gas than we detect in the data at post-merger ages. Another of the simulations from Cox et al. is also shown in Fig. 7, covering 4.3 Gyrs, with a peak in X-rays at about 1.5 Gyrs into the simulation. In this example we were also able to account for changes in the blue luminosity with time (data provided by T. Cox, private communication). This is the lower of the two model curves (solid lines) plotted in Fig. 7. Accounting for temporal changes in the blue luminosity reduces the peak below the observed data and predicts a very low Log(LX/LB) in the earliest stages of the merger. Cox et al. 2005 find low (LX/LB) for their model post-merger when compared to elliptical galaxies of similar LB. In either example model the post-merger values are comparable with the highest observed detections around those times ( Gyrs after coalescence). Therefore the models appear to slightly over predict the hot gas components present in post-merger galaxies.
Thus the observations can constrain the reality of models. The range of possible model behaviours needs further investigation, plus extension to older systems, to test the expected X-ray evolution of galaxies resulting from mergers.
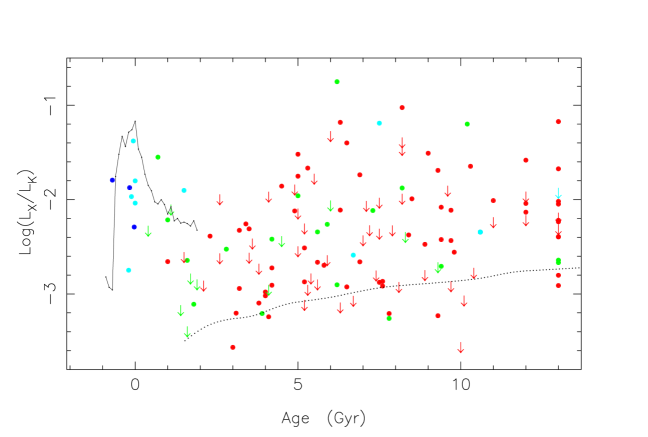
The B band luminosity is very sensitive to young stars. The K band is more representative of the underlying stellar mass in a galaxy. Therefore in Fig. 8 we have plotted the X-ray luminosity normalised by the K band luminosity. We used total K band magnitudes from the 2MASS survey, where available. For the 2MASS K band we assume (V-K)⊙=1.45 (Toft, Soucail & Hjorth 2003), MV⊙=+4.82, and a zero point flux calibration of K=0 for a flux of FK=1.122 J s-1 cm-2 (Cohen et al. 2003). This gives an apparent K-band magnitude of K⊙=-28.20 and a luminosity of LK⊙=6.03 erg s-1. Predicted X-ray evolution is shown (Cox et al. 2005), assuming a constant L erg s-1 estimated from the galaxy data at Gyr. This prediction also includes an estimate of the discrete source contribution to the X-rays. Fig. 8 shows a similar trend as seen in Fig. 7, confirming the relatively low X-ray flux levels in post-merger systems. Note that Figs. 7 and 8 exclude the exceptionally X-ray bright cD galaxy, IC 5358, which has a spectroscopic age of 16 Gyr and Log(LX/LB)=0.0.
5.2 Interpretation of trends with age
The horizontal lines in Fig. 7 give an indication of the level expected from stellar contributions only and its uncertainty. Within this uncertainty Fig. 7 indicates very little hot gas in E and S0 galaxies younger than about 4 Gyrs. Massive hot gas halos only appear to occur in older early-type galaxies. In Figs. 7 and 8 we have plotted a fading starburst, using the code described in Sansom & Proctor (1998). The level of optical fading even from a short, intense burst, is insufficient to account for this result. The evolution of the X-ray luminosity of the X-ray binary population is not well understood. HMXBs will dominate in the few hundred Myr after the merger, and probably help to produce the peak in X-ray luminosity seen around Age=0, but their contribution will rapidly decline with the population of high mass stars. In the long term, LMXBs will dominate, but the evolution of the integrated luminosity of the population over many Gyr is not well understood. A factor 6 increase would be required to explain the general trend we see, and this seems unlikely. Note that ages greater than about 10 Gyrs are very uncertain and some may be biased by emission line filling. Any galaxies with estimated ages greater than 13 Gyrs are therefore plotted at 13 Gyrs in Fig. 7 and Fig. 8 to avoid stretching the age scale unrealistically. Most of the galaxies in OFP01b had ages uncertain by %.
The presence of an accreting central black hole may provide a good explanation of the gas-poor state of post-merger galaxies, since it can act to drive a strong wind, as shown in the model of Cox et la. 2005. If the wind is sufficient to expel the gas then the halo building stage will be delayed until enough new ISM gas is built up from stellar mass loss. Return of gas from post-merger tidal features (modelled by Hibbard & Mihos 1995) cannot account for the hot gas halos since post-merger galaxies are both X-ray poor (see Figs. 7 and 8) and show little evidence for cold gas (Sansom et al. 2000). Therefore hot gas halos may instead be built up from stellar mass loss in the post-merger phase. This may lead to a more metal enriched ISM than in the case of returning, pre-existing gas, since the mass loss would be from more metal enriched stars.
Future requirements to test this picture will include examining hot gas properties and stellar X-ray components separately, versus age. This can only be done when accurate and consistent X-ray spectral fits have been made for enough cases, from data covering a broad waveband to avoid uncertain extrapolations. Data mining XMM-Newton and Chandra archives will allow this to be done. To date, most published papers on large galaxy samples, observed using these satellites, do not give sufficient information to do this (e.g. White et al. 2002; Diehl & Statler 2005). Some such data are starting to appear (e.g. Fukazawa et al. 2006), but more is needed to map properties with age. The effects of environment have not been considered here, but this should also be important to do for a more homogeneous data set in future.
6 Conclusions
Three early-type galaxies, with young stellar populations, were observed with XMM-Newton or Chandra. Two (NGC 5363 and NGC 2865) are dominated by stellar contributions to the X-ray emission and the other (NGC 4382) has roughly equal flux contributions from stellar and hot gas components. Thus we do detect low levels of hot gas in these spectroscopically young, early-type galaxies, confirming previously published results. A revised, older age was found from re-analysis of optical spectra for NGC 5363, using more spectral indices.
An attempt was made to recover the mass distribution in NGC 4382, which indicates an extended mass distribution, not bounded by the optical or X-ray light, however the gaseous halo is only detected out to kpc ( 4re) radius. In NGC 4382 there is a gas mass of M⊙ within this radius. In contrast, NGC 5363 is at a similar distance, but has about a factor of three less flux in the thermal component, so is likely to possess correspondingly less hot gas. Therefore there is no strong evidence for the quantities of gas expected from the observed dust mass, assuming gas-to-dust mass ratios typically measured for early-type galaxies. For NGC 4382 the mass-to-light ratio in the galaxy core is consistent with stars being the dominant form of mass, but the mass profile rises with radius, suggesting an increasing dark matter contribution. Therefore this spectroscopically youthful system appears to possess a dark matter halo.
Data from the literature, together with new data presented in this paper, were compiled for merging and early-type galaxies with measured, normalised X-ray emission (Log(LX/LB)) and estimated ages. This compilation of data confirms that there is a drop in X-ray emission for relatively young, early-type galaxies and illustrates that this drop extends up to Gyr in age. This is confirmed in the Log(LX/LK) versus age plane. The most likely explanation is that wind activity, fuelled by star formation and possible AGN activity, causes a lack of hot gas in post merger galaxies. Future work will investigate the origin of this behaviour, through separate X-ray spectral components, for a large, uniformly analysed sample.
Acknowledgments
We thank A.Read for advice on XMM-Newton analysis and B. Maughan for use of his sigma-clipping software. We thank T. Ponman for help obtaining the NGC 2865 data and T. Cox for sending us results of his simulations prior to publication. AES would like to thank the University of Central Lancashire for awarding a research sabbatical to complete this work. EOS acknowledges support from NASA grant NNG04GM97G. The authors made use of the NASA Extragalactic Data base. Thanks go to an anonymous referee for significant improvements in this paper.
References
- Anders & Grevesse (1989) Anders E., Grevesse N., 1989, Geo. Cosm. Acta, 53, 197
- Arnaud et al. (2002) Arnaud M., et al., 2002, A&A, 390, 27
- Baggett, Baggett & Anderson (1998) Baggett W.E., Baggett S.M., Anderson K.S.J., 1998, AJ, 116, 1626
- Bettoni, Galletta & Garcia-Burillo (2003) Bettoni D., Galletta G., Garcia-Burillo S., 2003, A&A, 405, 5
- Brown et al. (2000) Brown R.J.N., Forbes D.A., Kissler-Patig M., Brodie J.P., 2000, MNRAS, 317, 406
- Bournaud, Jog & Combes (2005) Bournaud F., Jog C.J., Combes F., 2005, A&A, 437, 69
- Caldwell, Rose & Concannon (2003) Caldwell N., Rose J.A., Concannon K.D., 2003, AJ, 125, 2891
- Chang et al. (2001) Chang T.C., van Gorkom J., Zabludoff A.I., Zaritsky D., Mihos J.C., 2001, AJ, 121, 1965
- Cohen et al. (2003) Cohen M., Wheaton W.A., Megeath S.T., 2003, AJ, 126, 1090
- Cox et al. (2005) Cox T.J. et al. 2005, submitted to ApJL, (astro-ph/0504156)
- Dekel et al. (2005) Dekel A., Stoehr F., Mamon G.A., Cox T.J., Primack J. R., 2005, Nature, 437, 707
- Daisuke, Yun & Mihos (2004) Daisuke I., Yun M.S., Mihos J.C., 2004, ApJ, 616, 199
- Denicoló et al. (2005) Denicoló G., Terlevich R., Terlevich E., Forbes D.A., Terlevich A., 2005, MNRAS, 358, 813
- D’Ercole, Recchi & Ciotti (2000) D’Ercole A., Recchi S., Ciotti L., 2000, ApJ, 533, 799
- Dickey & Lockman (1990) Dickey J.M. & Lockman F.J., 1990, ARA&A, 28, p215
- Diehl & Statler (2005) Diehl S., Statler T.S., 2005, to appear in ApJL, astro-ph/0509599
- Fabbiano et al. (2004) Fabbiano G., Baldi A., Pellegrini S., Siemiginowska A., Elvis M., Zezas A. & McDowell J., 2004, ApJ, 616, 730
- Fabbiano, Kim, Trinchieri (1992) Fabbiano G., Kim D.-W. & Trinchieri G., 1992, ApJS, 80, 531
- Fabbiano, Kim, Trinchieri (1994) Fabbiano G., Kim D.-W. & Trinchieri G., 1994, ApJ, 429, 94
- Fabbiano & Schweizer (1995) Fabbiano G., Schweizer F., 1995, ApJ, 447, 572
- Fabian et al. (2002) Fabian A.C., Allen S.W., Crawford C.S., Johnstone R.M., Morris R.G., Sanders J.S., Schmidt R.W., 2002, MNRAS, 332, L50
- Forbes, Ponman & Brown (1998) Forbes D.A., Ponman T.J. & Brown R.J.N., 1998, ApJ, 508, 43
- Fricke & Papaderos (1999) Fricke K.J., Papaderos P., 1999, In ’Highlights in X-ray Astronomy’, Garching, B. Aschenbach & M.J. Freyberg (eds.), p189 (FP99)
- Fukazawa et al. (2005) Fukazawa Y., Betoya-Nonesa J.G., Pu J., Ohto A., Kawano N., 2006, ApJ, 636, 698
- Georgakakis et al. (2001) Georgakakis A., Hopkins A.M., Caulton A., Wiklind T., Terlevich A.I., Forbes D.A., 2001, MNRAS, 326, 1431
- Hibbard & Mihos (1995) Hibbard J.E. & Mihos J.C., 1995, AJ, 110, 140
- Hibbard & Sansom (2003) Hibbard J.E. & Sansom A.E., 2003, AJ, 125, 667
- Hau, Carter & Balcells (1999) Hau G.K.T., Carter D., Balcells M., 1999, MNRAS, 306, 437
- Irwin, Athey & Bregman (2003) Irwin J.A., Athey A.E.., Bregman J.N., 2003, ApJ, 587, 356
- Jansen et al. (2001) Jansen F., et al., 2001, A&A, 365, L1
- Jenkins et al. (2004) Jenkins L.P., Roberts T.P., Ward M.J., Zezas A., 2004, MNRAS, 352, 1335
- Keel & Wu (1995) Keel W.C., Wu W., 1995, AJ, 110, 129
- Kim & Fabbiano (2004) Kim D.-W., Fabbiano G., 2004, ApJ, 611, 846
- Kraft et al. (2005) Kraft R.P., Nolan L.A., Ponman T.J., Jones C., Raychaudhury S., 2005, ApJ, 625, 785
- Mackie & Fabbiano (1997) Mackie G., Fabbiano G., 1997, in ’ASP Conf. Ser. 116: The Nature of Elliptical Galaxies; 2nd Stromlo Symposium’, Arnaboldi M., Da Costa G.S., Saha P. (eds), p401
- Matsushita et al. (1994) Matsushita K. et al., 1994, ApJ, 436, 41
- Matsushita et al. (1998) Matsushita K, Makishima K., Ikebe Y., Rokutanda E., Yamasaki N., Ohashi T., 1998, ApJ, 499, L13
- Mihos, Dubinsky & Hernquist (1998) Mihos J.C., Dubinsky J., Hernquist L., 1998, ApJ, 494, 183
- Mihos, Bothun & Richstone (1993) Mihos J.C., Bothun G.D., Richstone D.O., 1993, ApJ, 418, 82
- Mihos & Hernquist (1996) Mihos J.C., Hernquist 1996, ApJ, 464, 641
- Nolan et al. (2004) Nolan L.A., Ponman T.J., Read A.M., Schweizer F., 2004, MNRAS, 353, 221
- O’Sullivan et al. (2001a) O’Sullivan E., Forbes D.A., Ponman T.J.,2001a, MNRAS, 324, 420 (OFP01a)
- O’Sullivan et al. (2001b) O’Sullivan E., Forbes D.A., Ponman T.J.,2001b, MNRAS, 328, 461 (OFP01b)
- O’Sullivan & Ponman (2004a) O’Sullivan E., Ponman T.J., 2004a, MNRAS, 349, 535
- O’Sullivan & Ponman (2004b) O’Sullivan E., Ponman T.J., 2004b, MNRAS, 354, 935
- O’Sullivan et al. (2005) O’Sullivan E., Vrtilek J.M., Kempner J.C., David L.P., Houck J.C., 2005, MNRAS, 357, 1134
- Pellegrini & Ciotti (1998) Pellegrini S., Ciotti L., 1998, A&A, 333, 433
- Pahre et al. (2004) Pahre M.A., Ashby M.L.N., Fazio G.G., Willner S.P., 2004, ApJS, 154, 235
- Proctor & Sansom (2002) Proctor R.N., Sansom A.E., 2002, MNRAS, 333, 517
- Proctor et al. (2004) Proctor R.N., Forbes D.A., Hau G.K.T., Beasley M.A., De Silva G.M., Contreras R., Terlevich A.I., 2004, MNRAS, 349, 1381
- Prugniel & Simien (1996) Prugniel P., Simien.F, 1996, A&A, 309, 749
- Read & Ponman (1998) Read A.M., Ponman T.J., 1998, MNRAS, 297, 143 (RP98)
- Reda et al. (2004) Reda F.M., Forbes D.A., Beasley M.A., O’Sullivan E.J., Goudfrooij P., 2004, MNRAS, 354, 851
- Romanowsky et al. (2003) Romanowsky A.J., et al. 2003, Science, 301, 1696
- Sansom, Reid & Boisson (1988) Sansom A.E., Reid I.N., Boisson C., 1988, MNRAS, 234, 247
- Sansom & Proctor (1998) Sansom A.E., Proctor R.N., 1998, MNRAS, 297, 953
- Sansom et al. (2000) Sansom A.E., Hibbard J.E., Schweizer F., 2000, AJ, 120, 1946
- Schweizer (1996) Schweizer F., 1996, AJ, 111, 109
- Schweizer (1998) Schweizer F., 1998, in ’Galaxies: Interactions and Induced Star Formation.’, Saas-Fee Advanced Course 26. R.C. Kennicutt et al. (eds.) Springer-Verlag, p105
- Schweizer & Seitzer (1992) Schweizer F., Seitzer P., 1992, AJ, 104, 1039
- Sivakoff, Sarazin & Irwin (2003) Sivakoff G.R., Sarazin C.L. & Irwin J.A., 2003, ApJ, 599, 218
- Sivakoff, Sarazin & Carlin (2004) Sivakoff G.R., Sarazin C.L. & Carlin J.L., 2004, ApJ, 617, 262
- Sparke & Gallagher (2000) Sparke L.S., Gallagher J.S., 2000, ’Galaxies in the Universe’, Cambridge University Press, p264
- Statler & McNamara (2002) Statler T.S., McNamara B.R., 2002, 581, 1032
- Temi et al. (2004) Temi P., Brighenti F., Mathews W.G., Bregman J.D., 2004, ApJS, 151, 237
- Terlevich & Forbes (2002) Terlevich A.I., Forbes D.A., 2002, MNRAS, 330, 547 (TF02)
- Thomas, Maraston & Korn (2004) Thomas D., Maraston C., Korn A., 2004, MNRAS, 351, L19
- Toft, Soucail & Hjorth (2003) Toft S., Soucail G., Hjorth J., 2003, MNRAS, 344, 337
- Trager (2004) Trager S.C., 2004, in ’Origin and Evolution of the Elements’, A. McWilliam & M. Rauch eds., Cambridge University Press, p391
- Tully (1988) Tully R.B., 1988, ’Nearby Galaxies Catalogue’, Cambridge University Press
- de Vaucouleurs et al. (1991) de Vaucouleurs G., de Vaucouleurs A., Corwin H.G., Buta R.J., Paturel G., Fouque’ P., 1991, “Third Reference Catalogue of Bright Galaxies.”, Springer-Verlag.
- Voges et al. (1999) Voges W. et al., 1999, A&A, 349, 389
- White, Sarazin & Kulkarni (2002) White R.E., Sarazin C.L. & Kulkarni S.R., 2002, ApJ, 571, L23
- Worthey (1994) Worthey G., 1994, ApJS, 95, 107
- Xilouris et al. (2004a) Xilouris E.M., Georgakakis A.E., Misiriotis A., Charmandaris V., 2004a, MNRAS, 355, 57
- Xilouris et al. (2004b) Xilouris E.M., Madden S.C., Galliano F., Vigroux L., Sauvage M., 2004b, A&A, 416, 41