A search for H2O in the strongly lensed QSO MG 0751+2716 at = 3.2
Abstract
We present a search for 183 GHz H2O(313220) emission in the infrared–luminous quasar MG 0751+2716 with the NRAO Very Large Array (VLA). At , this water emission feature is redshifted to 43.6 GHz. As opposed to the faint rotational transitions of HCN (the standard high–density tracer at high–), H2O(313220) is observed with high maser amplification factors in Galactic star–forming regions. It therefore holds the potential to trace high–density star–forming regions in the distant universe. If indeed all star–forming regions in massively star–forming galaxies at have similar physical properties as e.g. the Orion or W49N molecular cloud cores, the flux ratio between the maser–amplified H2O(313220) and the thermally excited 12CO(=10) transitions may be as high as factor of 20 (but has to be corrected by their relative filling factor). MG 0751+2716 is a strong 12CO(=43) emitter, and therefore one of the most suitable targets to search for H2O(313220) at cosmological redshifts. Our search resulted in an upper limit in line luminosity of K km s-1 pc2. Assuming a brightness temperature of K for the maser emission and CO properties from the literature, this translates to a H2O(313220)/12CO(=43) area filling factor of less than 1%. However, this limit is not valid if the H2O(313220) maser emission is quenched, i.e. if the line is only thermally excited. We conclude that, if our results were to hold for other high– sources, H2O does not appear to be a more luminous alternative to HCN to detect high–density gas in star–forming environments at high redshift.
Subject headings:
galaxies: active, starburst, formation, high redshift — cosmology: observations — masers1. Introduction
Over the past years, massive amounts of dust and gas have been detected in distant quasars, allowing to study the properties of molecular gas in the early epoch of galaxy formation. Molecular gas in high–redshift galaxies is commonly traced by CO emission and was found in 30 galaxies at to date, out to the highest redshift quasar, SDSS J1148+5251 at (Walter et al. 2003, 2004; Bertoldi et al. 2003). The observed molecular gas masses in excess of 1010 M⊙ provide the requisite material for star formation (SF, e.g. Solomon & Vanden Bout 2005).
The presence of abundant molecular gas, the fuel for SF, has led to the hypothesis that the tremendous far–infrared (FIR) luminosities ( L⊙) of these high–redshift objects are not only powered by active galactic nuclei (AGN) but also by major starbursts (SBs), suggesting that this population represents the formation of large spheroidal galaxies beyond redshift 2 (Blain et al. 2002). However, the relative contribution to the FIR luminosity from dust heated by SF and AGN activity in high– sources remains subject to discussion (e.g. Andreani et al. 2003).
While the lower– transitions of CO are a good indicator for the total molecular gas content of a system (e.g. Carilli et al. 1999, 2002; Riechers et al. 2006), they can be excited at relatively low densities; the critical density lies at only cm-3. Hence, it is a relatively poor tracer of the denser gas directly involved in massive star formation. The standard tracer of the dense molecular gas phase is HCN, and the critical density to excite its lower– transitions is cm-3 (due to a higher dipole moment in comparison to CO). In this context, recent studies of the dense molecular gas phase in local () luminous and ultra–luminous infrared galaxies (LIRGs/ULIRGs) have shown a correlation between the HCN luminosity and the star–formation rate (SFR) as traced by the FIR luminosity. This correlation is much tighter than that between the CO and FIR luminosities (Solomon et al. 1992a; Gao & Solomon 2004a, 2004b). Thus, observations of HCN towards high– sources hold the potential to pin down the contribution of SF to the total FIR luminosity. Unfortunately, emission lines from HCN in LIRGs/ULIRGs are typically by a factor of 4 to 10 fainter than those of CO (even a factor of 25–40 in ordinary spiral galaxies, Gao & Solomon 2004b), which hinders systematic HCN surveys at cosmological distances using current telescopes. Until today, deep observations of HCN at resulted in four detections and four upper limits (Solomon et al. 2003; Vanden Bout et al. 2004; Carilli et al. 2005; Wagg et al. 2005).
Due to the faintness of emission connected with thermally excited rotational transitions of HCN, it is important to investigate whether another physical process can be found which produces emission lines with significantly higher luminosities. The 183 GHz emission line of para–H2O holds the potential to be such a tracer: in warm, dense SF regions ( cm-3), this line is collisionally pumped at relatively low kinetic temperatures (K, e.g. Cernicharo et al. 1994). In contrast to compact H2O maser sources at 22 GHz, the 183 GHz maser emission is spatially extended in high–mass (Orion, Cernicharo et al. 1994; W49N, González-Alfonso et al. 1995; Sgr B2, Cernicharo et al. 2006) and even low–mass (HH7–11, Cernicharo et al. 1996) star–forming regions. Due to maser amplification, the observed 183 GHz H2O(313220) line brightness temperatures in these regions exceed those observed in 12CO(=10) by up to a factor of 20 (e.g. for Orion, Cernicharo et al. 1994; Schulz et al. 1995).
However, the H2O(313220) line is strongly absorbed by the terrestrial atmosphere, rendering detection in nearby galaxies very difficult. The first successful extragalactic detection of H2O(313220) has been reported in NGC 3079 (Humphreys et al. 2005). Previous searches in low– (U)LIRGs have only resulted in upper limits (Combes et al. 1997). Recently, the H2O(313220) transition has also been detected towards Arp 220 (Cernicharo, Pardo & Weiss 2006, in prep., see Table 1). At high redshift, only the transition of para–H2O at 752.033 GHz (rest frame) has tentatively been detected in the QSO IRAS F10214+4724 (Encrenaz et al. 1993; Casoli et al. 1994).
In this paper, we report on a search for maser emission from the 183 GHz water line in the strongly lensed, radio–loud QSO MG 0751+2716 using the VLA111The Very Large Array is a facility of the National Radio Astronomy Observatory, operated by Associated Universities, Inc., under a cooperative agreement with the National Science Foundation.. Due to its strong magnification, MG 0751+2716 is the brightest CO source at high redshift that can be observed in the H2O(313220) transition with the VLA. Its and (see Table 1) are comparable to local starburst galaxies like Arp 220. This suggests that this source is undergoing massive star–formation, which contributes significantly to its far–IR luminosity (e.g. Fig. 8 in Solomon & Vanden Bout 2005). We use a standard concordance cosmology throughout, with km s-1 Mpc-1, , and (Spergel et al. 2003).
2. Observations
We observed the H2O(313220) transition (GHz) towards MG 0751+2716 using the VLA in D configuration on 2004 June 19 and 27. At the target of 3.200, this transition is redshifted to 43.6453 GHz (6.87 mm). The total on–sky integration time amounts to 16 hr. Observations were performed in fast–switching mode using the nearby source 0745+241 for secondary amplitude and phase calibration. Observations were carried out under good weather conditions with 26 antennas. The phase stability in all runs was good (typically 25∘ rms for the longest baselines). For primary flux calibration, 3C286 was observed during each run.
Two 50 MHz (corresponding to 344 km s-1 at 43.6 GHz) intermediate frequencies (IFs) were observed simultaneously in the so–called ’quasi–continuum’ mode. One IF was centered on the line frequency at 43.6351 GHz (closest possible tuning frequency, offset by 70 km s-1 from the 12CO(=43) line center of Barvainis et al. 2002), and the second IF was centered at two frequencies symmetrically offset by 150 MHz (1030 km s-1, i.e. at 43.4851 GHz and 43.7851 GHz) from the line frequency to monitor the 7 mm continuum of MG 0751+2716 simultaneously. Despite the small offset from the line center, the frequency/velocity coverage is well–matched to a line with a FWHM similar to the 12CO(=43) line reported by Barvainis et al. (2002).
For data reduction and analysis, the 222www.aoc.nrao.edu/aips/ package was used. The two continuum channels were concatenated in the uv/visibility plane. The data were mapped using the CLEAN algorithm and ’natural’ weighting; this results in a synthesized beam of 1.8 ′′1.7 ′′ (13 kpc at ) at a major axis position angle of 78∘. The final rms in both the line channel and the combined continuum channel is 60 Jy beam-1.
3. Results
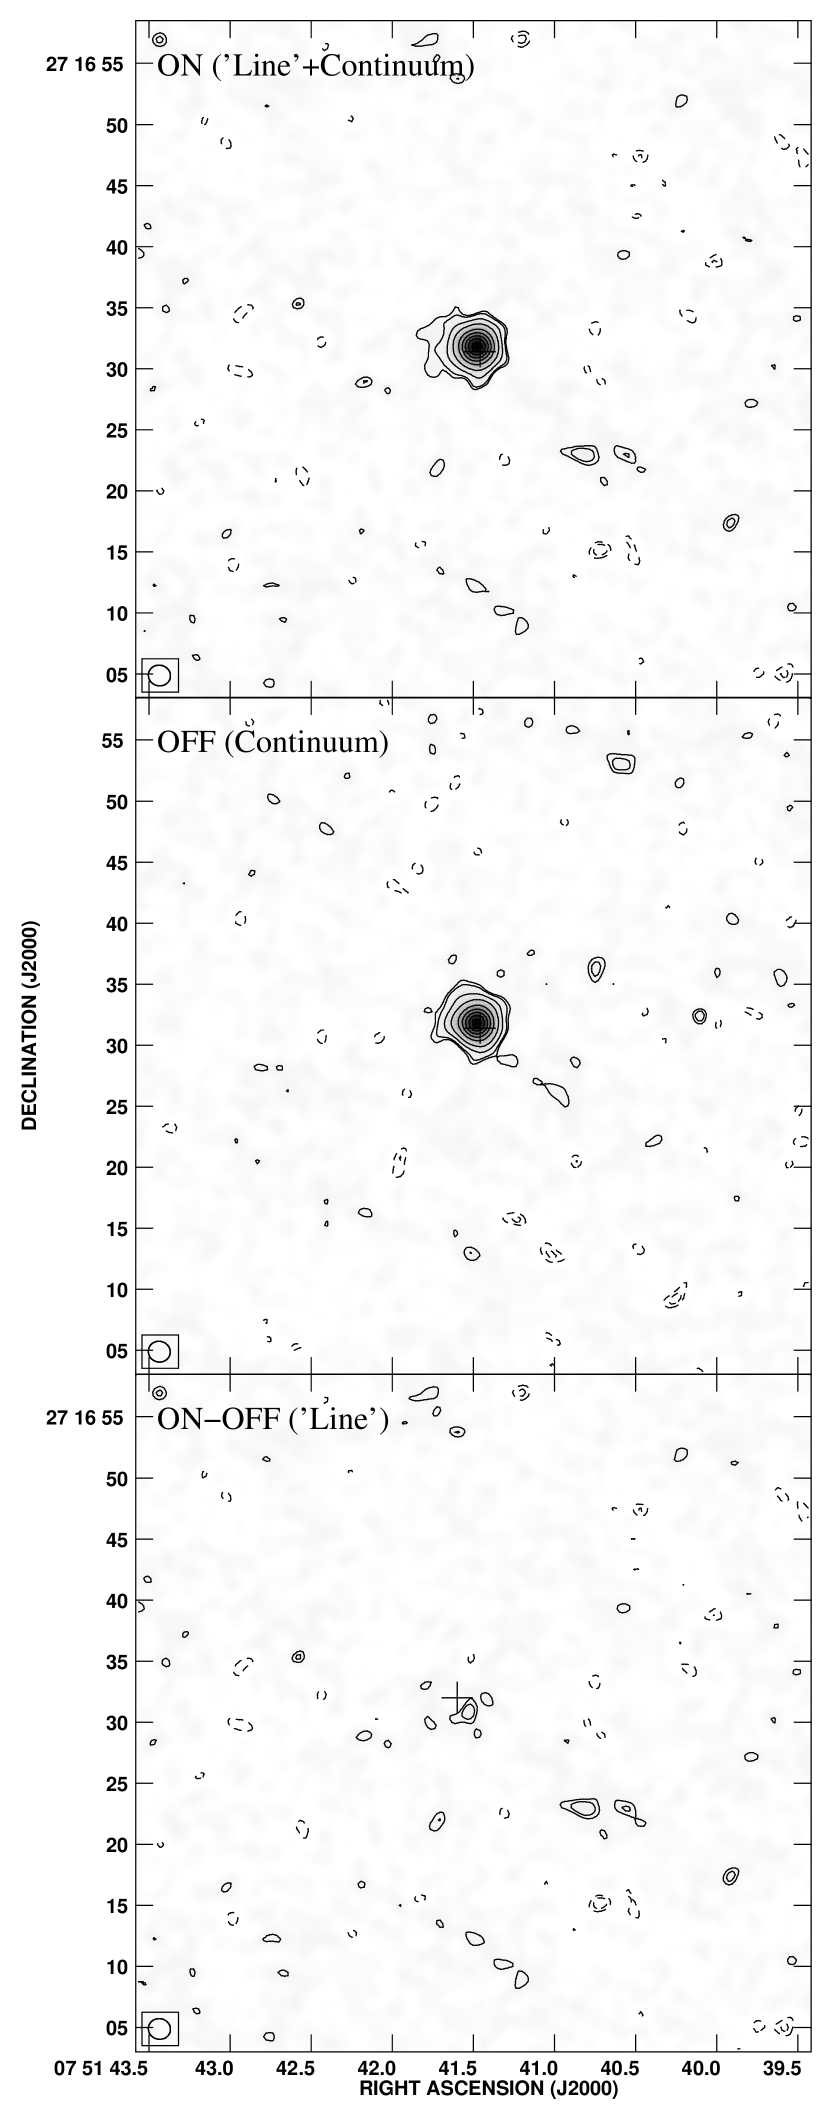
In the top panel of Fig. 1, the final map of the ’ON’ channel (line+continuum emission) is shown, while the middle panel shows the map of the two combined continuum (’OFF’) channels, representing the continuum–only flux. The source is clearly detected in both maps. To derive the total flux density of the source, a 2–dimensional Gaussian was fitted to the detected source structure. Our best fit for MG 0751+2716 gives a Gaussian diameter of 2.3 ′′2.3 ′′ (source convolved with the synthesized beam); i.e. the emission appears only marginally resolved in our observations, as our beam is too large to recover the lens image substructure seen at higher resolution (Carilli et al. 2005). The integrated flux density in the ’ON’ channel is 10.3 0.2 mJy (peak: 6.12 0.06 mJy beam-1), and the continuum flux in the combined ’OFF’ channels is 10.3 0.2 mJy (peak: 5.88 0.06 mJy beam-1). From the VLA 42.2 GHz measurement of 13.2 mJy (Carilli et al. 2005) and using a spectral index of (Lehár et al. 1997), an extrapolated flux density of 12.7 mJy can be calculated, which is higher than derived from our observations. Therefore, continuum variability cannot be excluded.
In the bottom panel of Fig. 1, the continuum-subtracted ’line’ map is shown. This map was generated by subtracting a CLEAN component model of the continuum emission (combined ’OFF’ channel) from the visibility data of the ’ON’ channel, which was then imaged applying the CLEAN algorithm with the same parameters used to create the continuum model. No clear evidence for H2O(313220) line emission is found. Thus, we set a 3 upper limit of Jy on the peak flux of H2O(313220) emission. For MG 0751+2716, we thus derive an upper limit for the H2O(313220) line luminosity of K km s-1 pc2 (3 limit, corrected for gravitational magnification, , Barvainis et al. 2002, cf. Table A search for H2O in the strongly lensed QSO MG 0751+2716 at = 3.2).
4. Discussion
4.1. Intrinsic line brightness temperatures
Given that the 183 GHz water maser line most likely arises from extended regions associated with star formation (Cernicharo et al. 1994), we can use our upper limit together with the 12CO(=43) line luminosity (Barvainis et al. 2002) to estimate how much of the molecular gas in MG 0751+2716 may be associated with massive star forming regions. Radiative transfer models based on the H2O(313220) emission line show that it is inverted in warm and dense environments ( K, cm-3) which are typically found in star–forming regions, and that the resulting line brightness temperature critically depends on the underlying physical conditions. It is known to range from thermalized emission up to line temperatures of 10000 K (Cernicharo et al. 1994; Combes et al. 1997). As an example, observations of the 183 GHz water maser towards Orion IRc2 show that emission arises from narrow (few km s-1) line features with up to K as well as a broad ( km s-1) emission plateau with K peak line brightness temperature (Cernicharo et al. 1994, 1999). As an order of magnitude estimate, we assume in the following that the H2O(313220) line in MG 0751+2716 arises from a similar environment as Orion with an intrinsic brightness temperature of K. Only the 12CO(=43) line is observed so far in MG 0751+2716, therefore the brightness temperature of the CO emission is not well–constrained. However, the dust continuum temperature of K in MG 0751+2716 (Barvainis & Ivison 2002) is consistent with those observed in most other high– QSOs (e.g. Beelen et al. 2006). In addition, the CO brightness temperature in well–studied high– objects such as IRAS F10214+4724 agrees within a factor of with the dust temperature (e.g. Downes et al. 1995). By analogy, we here assume K.
4.2. Area filling factor
The combined ratios of the brightness temperatures and line luminosities of H2O and CO ( K, K, K km s-1 pc2, K km s-1 pc2) can be used to estimate the relative area filling factor (FF) of both molecules. By this means, our observed upper limit on the 183 GHz H2O line luminosity together with the 12CO(=43) line luminosity translates into an upper limit on the H2O/CO area filling factor of .
To better understand the relevance of this filling factor limit derived from our observations, we now give an independent estimate for the filling factor based on the FIR luminosity and geometrical arguments. For this purpose, we assume in the following that all 183 GHz H2O emission in MG 0751+2716 is created in hot, star–forming cores like the one found in the central region of Orion. Assuming L⊙ for the central 1 of the Orion Nebula (Werner et al. 1976, corresponding to an area of 0.013 pc2 at a distance of 450 pc), we find that 107 of these cores are needed to account for the far–IR luminosity in MG 0751+2716 (Table 1). Assuming a size of 0.013 pc2 each, 107 of such cores would fill a disk with an equivalent radius of 200 pc. Taking the observed 12CO(=43) line FWHM and luminosity into account, and assuming K, for MG 0751+2716, we can calculate that the dust and CO are distributed over a region with an equivalent radius of 450 pc. Comparing the derived disk sizes, we thus find an expected H2O/CO area filling factor of 20%. This estimate is much higher than what is actually observed.
4.3. Comparison with other (U)LIRGs and NGC 3079
Our results for MG 0751+2716 are in line with observations of the radio–quiet QSOs Mkn 1014 (PG 0157+001, ) and VII Zw 244 (PG 0838+770, , see Table 1), the only two other infrared–luminous galaxies for which upper limits on the 183 GHz H2O line have been reported (Combes et al. 1997) to date. Using the same assumptions on the intrinsic line brightness temperatures as for MG 0751+2716, the non–detections in these galaxies imply filling factors of the water line relative to 12CO(=10) of and for Mkn 1014 and VII Zw 244 respectively. As CO emission appears to be close to thermalized up to the 12CO(=43) transition in high– QSOs (Weiss et al. 2005), these limits are directly comparable to MG 0751+2716.
In Arp 220 (), the H2O(313220) line was detected with a line luminosity of K km s-1 pc2 (Cernicharo, Pardo & Weiss 2006, in prep.). With the CO luminosity given in Solomon et al. (1992a), this translates to a H2O/CO filling factor of 0.4%. Arp 220 has a far–IR luminosity similar to that of MG 0751+2716, which might suggest a similar H2O/CO filling factor. This suggests that the H2O(313220) line might be detectable in MG 0751+2716 if the sensitivity was increased only by a factor of few.
For the recent first extragalactic H2O(313220) detection in the LINER NGC 3079 (Humphreys et al. 2005), the H2O/CO luminosity ratio (using same brightness temperatures as before) translates into a H2O/CO area filling factor of only . However, it is difficult to assess the relevance of the NGC 3079 results for MG 0751+2716, as the former is not a ULIRG. For lower–luminosity galaxies, it has been found that the HCN/CO luminosity ratio is significantly lower (2.5–4% rather than 10–25%, Gao & Solomon 2004b); by analogy, also lower H2O/CO luminosity ratios may be expected in galaxies with FIR luminosities that are significantly lower than in a ULIRG.
4.4. Possible interpretations of the non–detection
Our observations suggest that the H2O/CO area filling factor in MG 0751+2716 is significantly lower than expected from simple estimates based on the distribution and temperature of the dust and CO.
However, other reasons for the weakness of the water emission should also be considered: as discussed in Combes et al. (1997), the physical conditions to efficiently pump the 183 GHz line to the assumed 500 K may not be present. There are strong differences in the conditions for H2O line emission among Galactic star–forming regions. E.g., the H2O(313220) maser emission in Sgr B2(N/M) is much weaker than that in Orion IRc2. The extent of the maser emitting regions in both sources is of order 1 pc, but the observed brightness temperature in Sgr B2 is by 1–2 orders of magnitude lower, reaching only few tens of Kelvin (Cernicharo et al. 1994, 2006). This is much lower than the 500 K we assumed for a typical H2O emitting region. The 183 GHz H2O lines are thus only by a factor of 3 amplified relative to CO in this source. For high densities and/or column densities, which are known to be present in the compact molecular distributions of luminous IR galaxies, the maser emission of the 183 GHz line may even be quenched. This would lead to thermalized emission without maser amplification (Cernicharo et al. 1994; Combes et al. 1997). For thermalized emission in an optically thick environment, the H2O(313220) line is not expected to be stronger than those of other high density gas tracers such as HCN. In Arp 220, the HCN luminosity is K km s-1 pc2, i.e. by a factor of 3 brighter than H2O(313220) (Cernicharo, Pardo & Weiss 2006, in prep.; Graciá-Carpio et al. 2006). The H2O and HCN luminosities in Arp 220 would thus even be consistent with and an area filling factor that is smaller for H2O than for HCN. This suggests that only a small fraction of the dense gas is giving rise to H2O emission. Carilli et al. (2005) set a 3 limit of K km s-1 pc2 on the HCN(=21) line luminosity in MG 0751+2716, which is twice as high as our limit for .
It also remains a possibility that the reason for our non–detection is due to limitations in our observing mode. Due to the small fraction of gas giving rise to the H2O(313220) emission compared to CO, its linewidth could be much smaller than that of the 12CO(=43) transition. This has recently been found in NGC 3079 (Humphreys et al. 2005), where the difference in linewidth is more than a factor of 10. As our observations had to be done using 50 MHz (344 km s-1) channels, the emission from a narrow line would be diluted over the full velocity range covered by that channel, rendering detection unlikely even at the achieved sensitivity. However, in Arp 220, which is likely more similar to MG 0751+2716, the H2O(313220) line has a width of 350 km s-1. Such a linewidth would match our observing mode very well. Finally, differential lensing may have an impact on the measured luminosity ratios (), in particular if the CO and H2O emission do not emerge from the same regions.
Given the aforementioned results, we find that water maser activity does not outshine emission from rotational transitions of CO or HCN in the QSO MG 0751+2716. If our results can be generalized, we conclude that H2O (despite the fact that it potentially traces hot, star–forming cores) does not appear to be a more luminous alternative to HCN to detect high–density gas in star–forming environments at high redshift.
References
- Alloin et al. (1992) Alloin, D., Barvainis, R., Gordon, M. A., & Antonucci, R. R. J. 1992, A&A, 265, 429
- Andreani et al. (2003) Andreani, P., Christiani, S., Grazian, A., LaFranca, F., & Goldschmidt, P. 2003, AJ. 125, 444
- Barvainis & Ivison (2002) Barvainis, R., & Ivison, R. 2002, ApJ, 571, 712
- Barvainis et al. (2002) Barvainis, R., Alloin, D., & Bremer, M. 2002, A&A, 385, 399
- Beelen et al. (2006) Beelen, A., Cox, P., Benford, D. J., et al. 2006, ApJ, in press (astro-ph/0603121)
- Bertoldi et al. (2003) Bertoldi, F., Cox, P., Neri, R., et al. 2003, A&A, 409, L47
- Blain et al. (2002) Blain, A., Smail, I., Ivison, R., Kneib, J.-P., & Frayer, D. 2002, Phys. Rep., 369, 111
- Carilli et al. (1999) Carilli, C. L., Menten, K. M., & Yun, M. S. 1999, ApJ, 521, L25
- Carilli et al. (2002) Carilli, C. L.,Kohno, K., Kawabe, R., Ohta, K., et al. 2002, AJ, 123, 1838
- Carilli et al. (2005) Carilli, C. L., Solomon, P. M., Vanden Bout, P. A., et al. 2005, ApJ, 618, 586
- Casoli et al. (1994) Casoli, F., Gerin, M., Encrenaz, P. J., & Combes, F. 1994, A&A, 287, 716
- Cernicharo et al. (1994) Cernicharo, J., González-Alfonso, E., Alcolea, J., et al. 1994, ApJ, 432, L59
- Cernicharo et al. (1996) Cernicharo, J., Bachiller, R., González-Alfonso, E., et al. 1996, A&A, 305, L5
- Cernicharo et al. (1999) Cernicharo, J., Pardo, J. R., González-Alfonso, E., et al. 1999, ApJ, 520, L131
- Cernicharo et al. (2006) Cernicharo, J., Goicoechea, J. R., Pardo, J. R., & Asensio-Ramos, A. 2006, ApJ, in press
- Combes et al. (1997) Combes, F., Nguyen-Q-Rieu, & Dinh-V-Trung 1997, A&A, 323, 357
- Downes et al. (1995) Downes, D., Solomon, P. M., & Radford, S. J. E. 1995, ApJ, 453, L65
- Encrenaz et al. (1993) Encrenaz, P. J., Combes, F., Casoli, F., et al. 1993, A&A, 273, L19
- Gao & Solomon (2004a) Gao, Y., & Solomon, P. M. 2004a, ApJS, 152, 63
- Gao & Solomon (2004b) Gao, Y., & Solomon, P. M. 2004b, ApJ, 606, 271
- González-Alfonso et al. (1995) González-Alfonso, E., Cernicharo, J., Bachiller, R., & Fuente, A. 1995, A&A, 293, L9
- Graciá–Carpio et al. (2006) Graciá-Carpio, J., García-Burillo, S., Planesas, P., & Colina, L. 2006, ApJ, 640, L135
- Humphreys et al. (2005) Humphreys, E. M. L., Greenhill, L. J., Reid, M. J., et al. 2005, ApJ, 634, L133
- Kennicutt (1998) Kennicutt, R. 1998, ARA&A, 36, 189
- Koda et al. (2002) Koda, J., Sofue, Y., Kohno, K., et al. 2002, ApJ, 573, 105
- Lehár et al. (1997) Lehár, J., Burke, B. F., Conner, S. R., et al. 1997, AJ, 114, 68
- Riechers et al. (2006) Riechers, D. A., Walter, F., Carilli, C. L., et al. 2006, ApJ, submitted
- Schulz et al. (1995) Schulz, A., Henkel, C., Beckmann, U., et al. 1995, A&A, 295, 183
- Solomon et al. (1992a) Solomon, P., Downes, D., & Radford, S. 1992a, ApJ, 387, L55
- Solomon et al. (1992b) Solomon, P. M., Radford, S. J. E., & Downes, D. 1992b, Nature, 356, 318
- Solomon et al. (1997) Solomon, P. M., Downes, D., Radford, S., & Barrett, J. W., 1997, ApJ, 478, 144
- Solomon et al. (2003) Solomon, P., Vanden Bout, P., Carilli, C., & Guelin, M. 2003, Nature 426, 636
- Solomon & Vanden Bout (2005) Solomon, P. M., & Vanden Bout, P. A. 2005, ARA&A, 43, 677
- Spergel et al. (2003) Spergel, D. N., Verde, L., Peiris, H. V., et al. 2003, ApJS, 148, 175
- Vanden Bout et al. (2004) Vanden Bout, P., Solomon, P., & Maddalena, R. 2004, ApJ, 614, L97
- Wagg et al. (2005) Wagg, J., Wilner, D. J., Neri, R., Downes, D., & Wiklind, T. 2005, ApJ, 634, L13
- Walter et al. (2003) Walter, F., Bertoldi, F., Carilli, C. L., et al. 2003, Nature, 424, 406
- Walter et al. (2004) Walter, F., Carilli, C., Bertoldi, F., et al. 2004, ApJ, 615, L17
- Weiss et al. (2005) Weiß, A., Downes, D., Walter, F., & Henkel, C. 2005, A&A, 440, L45
- Werner et al. (1976) Werner, M. W., Gatley, I., Harper, D. A., et al. 1976, ApJ, 204, 420
| aaDerived as described by Solomon et al. (1992b): , where X is the molecule, is the velocity–integrated line flux in Jy km s-1, is the luminosity distance in Mpc, and is the observed frequency in GHz. | aaDerived as described by Solomon et al. (1992b): , where X is the molecule, is the velocity–integrated line flux in Jy km s-1, is the luminosity distance in Mpc, and is the observed frequency in GHz. | FF | Ref. | ||||||
|---|---|---|---|---|---|---|---|---|---|
| [Mpc] | [GHz] | [mJy] | [109 K km s-1 pc2] | [109 K km s-1 pc2] | [10L⊙] | ||||
| MG 0751+2716bbThis QSO is lensed by a factor of (Barvainis et al. 2002). All given luminosities are corrected for lensing. | 3.200 | 27940 | 43.6453 | 0.18 | 10.0 | 1.2 | 1% | 1,2,3 | |
| Mkn 1014 | 0.1631 | 774 | 157.6048 | 26 | 7.8 | 2.2 | 5% | 4,5 | |
| VII Zw 244 | 0.1324 | 616 | 161.8775 | 26 | 3.9 | 0.14 | 2% | 4,5 | |
| NGC 3079 | 0.003723 | 16 | 182.6302 | 550 | 1.1 | 0.0041 | 0.021 | 0.05% | 6,7 |
| Arp 220 | 0.018126 | 78 | 180.0680 | 170 | 5.9 | 0.29 | 1.3 | 0.4% | 8,9,10 |