Detection of the radial velocity curve of the B5–A0 supergiant companion star of Cir X–1?
Abstract
In this Paper we report on phase resolved –band optical spectroscopic and photometric observations of Cir X–1 obtained with the Very Large Telescope. The spectra are dominated by Paschen absorption lines at nearly all orbital phases except near phase zero (coinciding with the X–ray dip) when the absorption lines are filled–in by broad Paschen emission lines. The radial velocity curve of the absorption lines corresponds to an eccentric orbit () whose period and time of periastron passage are consistent with the period and phase predicted by the most recent X–ray dip ephemeris. We found that the –band magnitude decreases from 17.6 to near phase 0.9–1.0, this brightening coincides in phase with the X–ray dip. Even though it is likely that the absorption line spectrum is associated with the companion star of Cir X–1, we cannot exclude the possibility that the spectrum originates in the accretion disc. However, if the spectrum belongs to the companion star, it must be a supergiant of spectral type B5–A0. If we assume that the compact object does not move through the companion star at periastron, the companion star mass is constrained to 10 M⊙ for a 1.4 M⊙ neutron star, whereas the inclination has to be . Alternatively, the measured absorption lines and their radial velocity curve can be associated with the accretion disc surrounding a 1.4 M⊙ neutron star and its motion around the centre of mass. An absorption line spectrum from an accretion disc is typically found when our line–of–sight passes through the accretion disc rim implying a high inclination. In this scenario the companion star mass is found to be 0.4 M⊙. However, from radio observations it was found that the angle between the line–of–sight and the jet axis is smaller than 5∘. This would mean that the jet ploughs through the accretion disc in this scenario, making this solution less probable.
keywords:
stars: individual (Cir X–1) — accretion: accretion discs — stars: binaries — stars: neutron — X-rays: binaries1 Introduction
X–ray binaries are binary systems harbouring a neutron star or black hole compact object that accretes matter from either a low– or a high–mass companion star (LMXB and HMXB, respectively). LMXBs are typically old systems whereas the early type companion star of HMXBs precludes systems older than a few times 107 yr. Recently, it has been realised that many X–ray binaries might have started–off as intermediate mass X–ray binaries (cf. Cyg X–2; Tauris & Savonije 1999; Podsiadlowski et al. 2002). One intriguing system that so far has defied classification is Cir X–1. It has a 16.6 day orbital period (Kaluzienski et al. 1976; see Clarkson et al. 2004 for the latest X–ray ephemeris). Owing to the detection of type I X–ray bursts, the compact object in Cir X–1 likely is a neutron star (Tennant et al. 1986b; Tennant et al. 1986a).
The X–ray and radio behaviour of the source is complex. The long–term X–ray lightcurve of the source has been discussed in detail by Saz Parkinson et al. (2003). One of the striking features of the X–ray lightcurve is the periodic appearance of dips. In radio, an arc minute scale radio nebula was found (Stewart et al. 1993). Furthermore, a relativistic outflow has been detected on scales of arc seconds that is aligned with the arc minute scale jet (Fender et al. 1998; Fender et al. 2004). The inclination of the jet with respect to the line–of–sight has to be less than 5∘ (Fender et al. 2004). The presence of relativistic outflows detectable as synchrotron emission in the radio band argues against a high magnetic field neutron star in Cir X–1 (cf. Fender & Hendry 2000). Furthermore, the detection of type I X–ray bursts from Cir X–1 suggests that the neutron star has a low magnetic field, since the thermonuclear instability giving rise to type I X–ray bursts is suppressed by dipole magnetic fields Gauss (Joss & Li 1980; Bildsten 1995). In accordance with this, type I X–ray bursts are not found in HMXBs. The low magnetic field of the neutron star in Cir X–1 suggests that it is old and hence the companion star is not an early type star.
So far, clear spectroscopic evidence on the nature of the companion star is lacking. It has been suggested that Cir X–1 has a supergiant companion (Murdin et al. 1980). However, it can be argued (cf. Johnston et al. 1999) that the source is too faint in the optical bands for the distance of 8–10 kpc that has been derived from the type I X–ray bursts (Jonker & Nelemans 2004). Nevertheless, Clark et al. (2003) found emission lines in the near–infrared spectrum that are consistent with a mid–B super giant. However, these authors concluded that these features must have arisen in the accretion disc and/or in outflows from the disc.
In this Manuscript we present phase resolved Very Large Telescope (VLT) photometric and spectroscopic observations obtained with the FOcal Reducer/low dispersion Spectrograph 2 (FORS2).
2 Observations, analysis and results
We have obtained VLT/FORS2 spectra of the peculiar X–ray binary Cir X–1 using the 1028z holographic grism with a slit width of 1′′. The observations were obtained in service mode on 21 different nights in the period ranging March 15–May 15, 2005 (MJD 53446–53507). In order to sample the 16.6 day long binary orbital period of Cir X–1 we obtained one spectrum per night with an exposure time of 1730 seconds. Exceptions were May 13 and April 4. On May 13 we obtained 9 spectra with an exposure time of 1675 seconds since that night Cir X–1 was close to periastron (according to the ephemeris of Clarkson et al. 2004). On April 4, three spectra were obtained since the seeing was higher than the specified conditions on 2 of the 3 occasions. To minimise the light coming from an unrelated nearby field star (star 2 in Moneti 1992), observations were obtained under good seeing conditions (seeing between 04 and 13 as measured from the point spread function full–width–at–half–maximum of the acquisition images). The dispersion was 0.86 Å per pixel. With the 1′′ slit width the resolution is about 120 km s-1 at 8800 Å.
The spectra have been reduced with iraf111iraf is distributed by the National Optical Astronomy Observatories. We used the overscan area of the Charge Coupled Device (CCD) for bias subtraction. The data were flatfield corrected and optimally extracted (Horne 1986). Wavelength calibration was done using lines from He, Ar & Ne lamp spectra that were obtained during daytime the day after the observations with the same instrument set–up, as is customary for VLT Service mode observations. The rms scatter of the wavelength calibration was in the range of 0.05–0.08 Å.
The extracted spectra were further reduced and analysed using the software package molly. We corrected the wavelength calibration for potential shifts caused by flexure by cross correlating the spectra over the wavelength ranges 9050–9160 Å and 9300–9500 Å with the first object spectrum. That part of the spectrum is dominated by features from the night sky which should have the same wavelength in each spectrum. Note that this does not account for uncertainties in the wavelength calibration caused by centroiding or star tracking inaccuracies. We did this for both the spectra of Cir X–1 and that of star 2 that was also in the slit. Next, the observation times were corrected to the Heliocentric Julian Date time frame (using UTC times) and we normalised and rebinned the spectra to a uniform velocity scale removing the Earth’s velocity. Cross–correlation of the spectra of star 2 with the first spectrum of that star over the range 8000–9000 Å shows that the remaining rms velocity differences are 2.5 km s-1.
In Fig. 1 we show the normalised spectra as a function of the orbital period. To fold the spectra we used our best–fit epoch of periastron (T, see below) and an orbital period of days as found by extrapolating the X–ray dip ephemeris of Clarkson et al. (2004). We binned the data in 15 phase bins. However, none of the spectra fall in the phase range 0.60–0.85, hence only 11 phase bins are shown. The most striking feature is the large change in the profile of the Paschen lines. At phase zero, large, broad (possibly double peaked) emission lines are present. Superposed is an absorption line spectrum that could originate in the companion star. This absorption line spectrum can be seen clearly at phases 0.2–0.6. Besides the Paschen absorption lines that are often seen in B and A stars, small absorption lines often seen in supergiants can be seen as well, e.g. near 8777 Å (Munari & Tomasella 1999; Clark et al. 2005; compare the Cir X–1 spectrum with that of the supergiant system XTE J1739–302 in Negueruela et al. 2006). This feature is most likely due to He I.
We investigated the behaviour of the equivalent width of the luminosity indicator Paschen–12 at 8750 Å as a function of the orbital phase. At phase 0.4–0.6 the equivalent width of the absorption line is largest. Assuming that the Paschen lines are formed in the companion star, the contamination of the accretion disc at phase 0.4–0.6 is thus minimal but not necessarily zero. Hence, the measured equivalent width of 2 Å at phase 0.4–0.6 is a lower limit. Using Danks & Dennefeld (1994), Allen & Strom (1995), Silva & Cornell (1992) and Munari & Tomasella (1999) we find that the spectra at phase 0.4–0.6 resemble most that of late B/early A stars. As can be seen in Fig. 2, the lines are very narrow and from this we conclude that the star must be a supergiant. However, we cannot exclude that the absorption line spectrum is from an accretion disc. Nevertheless, in order to test what spectral type would describe the observed spectrum best under the assumption that the absorption lines are stellar, we obtained template stellar spectra from Le Borgne et al. (2003). We optimally subtracted the spectra of 9 stars (see Table 1) with spectral type ranging from B1Ib–F5Ia from the Cir X–1 Å spectrum at phase 0.4–0.6. The optimal subtraction is performed on normalised spectra, minimising the residuals using the following recipe: , where A is the assumed accretion disc contribution and b is the fraction of light from the companion star. From the residuals of the optimal subtraction it was clear that the Ia supergiants matched the narrow absorption lines better than those of the Ib stars. Between the Ia supergiants we found that the spectra of those of spectral type mid–B provided the best fit. The multiplicative factor in the optimal subtraction was consistent with unity. However, systematic uncertainties prevent us from obtaining formal (reduced chi–squared, ) fits. Since the template star spectra and the Cir X–1 spectrum are not obtained with the same telescope–instrument combination the instrumental broadening of the line profile is different. Furthermore, the broadening due to the rotational velocity of the stars is different for the different stars.
Spectral type & Henry Draper Identification
| B1Ib | HD 091316 | B2Ia | HD 268623 |
| B5Ib | HD 164353 | B3Ia | HD 271163 |
| B7Iab | HD 268749 | B9Ia | HD 032034 |
| A0Ib | HD 087737 | A3Ia | HD 033579 |
| – | – | F5Ia | HD 269697 |


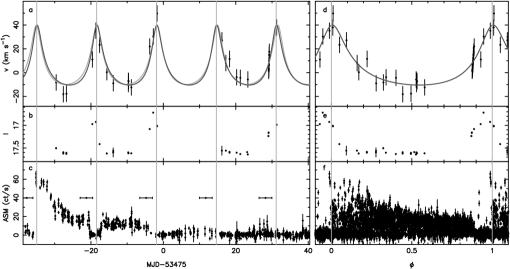
Next, we investigated the velocity of the absorption line spectrum as a function of the binary orbital phase. Since we did not obtain early type supergiant template star spectra we cross correlate the spectra of Cir X–1 with that of one of the spectra. In the cross correlation it is vital that the continuum level has been determined accurately. Furthermore, one has to avoid regions of the spectrum affected by skylines. In order to avoid problems with the continuum normalisation and skylines we have cross–correlated the region between 8700–8900 Å. In Fig. 3 we show the observed radial velocity curve. The solid line in Fig. 3 is the best–fit elliptical orbit (see Table 2 and 3). However, in the fit shown in Fig. 3 we have increased the errors by 6.5 km s-1 in order to obtain a of 1.0. As mentioned above the rms residual velocities measured by cross correlating the spectra of the nearby star with itself are 2.5 km s-1. We used this 2.5 km s-1 as a measure of the amplitude of systematic effects. This systematic error dominates the statistical error of the cross–correlation of the Cir X–1 spectra. However, even when we take this uncertainty into account, the formal for the 25 degrees of freedom. Possible other systematic effects that are not included are: (i) the effects of differences in X–ray heating on the absorption line spectrum. E.g. it can be seen comparing the top and bottom left panel of Fig. 3 that the first three velocity measurements are somewhat below the fit, these observations were performed when the X–ray flux was still relatively high (ii) from Fig. 1 it can be seen that near phase zero strong Paschen emission lines are present. These emission lines are redshifted with respect to their rest wavelengths and since the Paschen absorption lines at those orbital phases are red shifted by a different amount, the emission lines fill–in the absorption in an asymmetric way, possibly skewing the cross correlation velocities (iii) slit centroiding and tracking errors can have introduced errors in the wavelength calibration.
| MJD | Orbital phase | Orbital phase | Radial velocity |
|---|---|---|---|
| ( d) | ( d) | (km s-1)a | |
| 53445.3868 | 0.323 | 0.326 | -8.21.0 |
| 53447.3749 | 0.443 | 0.446 | -18.11.0 |
| 53448.2275 | 0.495 | 0.497 | -17.71.1 |
| 53455.3966 | 0.929 | 0.926 | 11.10.8 |
| 53456.3680 | 0.988 | 0.985 | 35.31.0 |
| 53457.4003 | 0.050 | 0.047 | 23.41.0 |
| 53459.3877 | 0.171 | 0.166 | 0.41.2 |
| 53461.1724 | 0.279 | 0.273 | -8.91.1 |
| 53465.3265 | 0.530 | 0.522 | -9.51.3 |
| 53465.3517 | 0.531 | 0.523 | -6.91.4 |
| 53465.3763 | 0.533 | 0.525 | -7.31.1 |
| 53466.1605 | 0.580 | 0.572 | -12.41.1 |
| 53471.2432 | 0.888 | 0.876 | 22.00.8 |
| 53472.2192 | 0.947 | 0.935 | 30.40.8 |
| 53473.2753 | 0.011 | 0.998 | 49.71.1 |
| 53491.1779 | 0.094 | 0.072 | 27.21.0 |
| 53492.2715 | 0.160 | 0.137 | 8.11.1 |
| 53493.2927 | 0.222 | 0.198 | 11.51.6 |
| 53495.2467 | 0.340 | 0.316 | -3.90.9 |
| 53496.2661 | 0.402 | 0.377 | -4.31.0 |
| 53498.3358 | 0.527 | 0.501 | -5.71.2 |
| 53504.0955 | 0.875 | 0.846 | 1.50.9 |
| 53504.1153 | 0.877 | 0.847 | 2.40.8 |
| 53504.1351 | 0.878 | 0.848 | 3.50.9 |
| 53504.1549 | 0.879 | 0.850 | 6.10.8 |
| 53504.1748 | 0.880 | 0.851 | 7.10.8 |
| 53504.1946 | 0.881 | 0.852 | 9.80.9 |
| 53504.2144 | 0.883 | 0.853 | 14.90.9 |
| 53504.2343 | 0.884 | 0.854 | 14.71.0 |
| 53504.2541 | 0.885 | 0.856 | 17.51.0 |
| 53506.3040 | 0.009 | 0.978 | 38.00.8 |
a The error has to be increased by 6.5 to obtain a reduced of 1 in
the fit (see text).
Since we cross correlated the spectra with a spectrum of Cir X–1 itself the systemic velocity that is derived from the elliptical orbit fit (3.71.3 km s-1) is not the true systemic velocity. In fact, as one would expect, within 3 it is consistent with 0. The systemic velocity is km s-1. We derived this by comparing the best–fit central wavelength of the Gaussian absorption lines with rest wavelengths of 8467.25, 8598.4, 8750.5 and 8862.8 Å. The Gaussians were fitted to the spectrum that was taken as our template spectrum in the cross–correlation (we have excluded the three Paschen lines that are possibly blended with absorption lines of the Ca II triplet). Hence, in order to convert the relative velocities in Fig. 3 and Table 2 to absolute velocities one has to add the systemic velocity.
| P (days) | 16.680.15 | 16.53 (fixed) |
|---|---|---|
| K (km s-1) | 252 | 252 |
| e | 0.450.07 | 0.470.06 |
| (deg) | 212 | -711 |
| T (+53,475.0 days; MJD) | -1.7 | -1.9 |
| a i (lightseconds) | 16.91.2 | 16.82.0 |
| f(m) (M⊙) | 0.0190.007 | 0.0190.007 |
We have used the 32 –band images that were obtained to acquire the source to construct a lightcurve. The images were corrected for bias using the values from the overscan regions and flatfielded using sky flats taken within one or two days from the science images. To determine instrumental magnitudes of Cir X–1 and stars in its relative crowded vicinity, we used the point–spread–function (psf) fitting routines from DAOPHOT II (Stetson 1987), running inside midas. The instrumental magnitudes were placed in a common photometric system by removing small magnitude differences between the different images, due to e.g. differences in the psf and the exposure times, by matching stars between these images and comparing their magnitudes. This common system was then calibrated using observations of standard star fields (PG 0942029 and L110; using the calibrated magnitudes by Stetson 2000), which were imaged during photometric nights (March 27, April 11 and 12, 2005). As Cir X–1 is only imaged in the –band, we have not determined colour terms. The uncertainty in the zeropoint is estimated to be about 0.2 mag. The derived evolution of the –band magnitude as a function of time and orbital phase is shown in the middle panels of Fig. 3. It is clear that the –band magnitude is constant except for a brief period that coincides with the X–ray dip and periastron passage.
3 Discussion
We have obtained VLT phase resolved optical –band spectra and images of the X–ray binary Cir X–1. The observed X–ray flux was low compared to that observed during other earlier spectroscopic observations (e.g. Johnston et al. 1999; Johnston et al. 2001; Clark et al. 2003). If this lower X–ray flux corresponds to a lower intrinsic X–ray luminosity the optical light from the accretion disc thought to be caused in large by reprocessing of the X–ray luminosity might be lower as well. Hence, the putative companion star might be more readily observable now compared with high X–ray flux episodes. The spectrum we observed varies strongly as a function of orbital phase. Strong emission lines appear near periastron passage, filling–in the absorption line spectrum observable at other orbital phases. Cross–correlation of the absorption features in the 8700–8900 Å range gives a radial velocity curve with an orbital eccentricity of , lightseconds and a mass function of 0.019 M⊙. The question is; is this the radial velocity curve of the companion star, is it associated with the compact object/neutron star, or are the absorption lines caused by a circumbinary disc?
The detected absorption line spectrum is consistent with a stellar spectrum if that star is a B5–A0 supergiant. This provides evidence for a supergiant companion star in Cir X–1. Similarly, Clark et al. (2003) found emission lines in the near–infrared spectrum of Cir X–1 that often occur in mid–B supergiants. Those results are consistent with our findings (but Clark et al. 2003 favoured a scenario where the emission features arise in the accretion disc/flow.) Previously, Murdin et al. (1980) proposed that the companion star of Cir X–1 is an early type supergiant. However, the then known counterpart was later resolved into three stars reducing the magnitude associated with the companion star (Moneti 1992) which led people to discard the supergiant model for Cir X–1. On the other hand, an interstellar extinction of A was used. This value was derived on the basis of the lowest NH measured in the seventies. That NH was determined from an X–ray spectrum obtained from Aerobee rocket data. No error was given on NH (Margon et al. 1971). More recent NH measurements from X–ray spectral fits with more sensitive satellites with a good soft response such as ROSAT, ASCA and Chandra give an NH in the range 1.6–2.2 cm-2 (Predehl & Schmitt 1995; Brandt et al. 1996; Schulz 1999; Schulz & Brandt 2002). However, Iaria et al. (2005) again found a significant lower value for NH modelling Beppo–SAX data. As we will show below there are three independant measurements that are consistent with the higher NH for Cir X–1. First of all, as mentioned by Brandt et al. (1996), a significantly lower value for NH would not be compatible with the strength of the dust scattering halo in Cir X–1 as found by Predehl & Schmitt (1995). Secondly, the distance that would be derived from the low NH value is 4 kpc (Iaria et al. 2005). This distance is too low to explain the type I X–ray bursts, those require a lower limit to the distance of d=7.8–10.5 kpc (Jonker & Nelemans 2004). Finally, the equivalent width of the diffuse interstellar band at 8620 Å that we find in the optical spectrum is correlated with (Munari 2000). This provides an A for Cir X–1 (taking R=3.1), consistent with the higher value derived from NH which using the conversion of NH to AV from Predehl & Schmitt (1995) gives . For these reasons and since the modelling of the X–ray spectrum is model dependent as mentioned in Iaria et al. (2005) we think that the higher value for NH and hence AV is more likely to be right.
From the distance to Cir X–1 from the type I X–ray bursts (d=7.8–10.5 kpc), A, and =17.6, one gets an absolute magnitude (taking into account that is nearly 0 for mid–B/early A type stars, and using the relative extinction from Schlegel et al. 1998 AAV). An absolute magnitude of -2.5 would be too low and even -4.9 is on the low side for standard B5–A0 supergiants (Balona & Crampton 1974). However, considering the preceding binary evolution involving significant mass transfer from the neutron star progenitor to the initially less massive companion star and the current X–ray heating especially at periastron the companion star of Cir X–1 is not likely to be a standard supergiant.
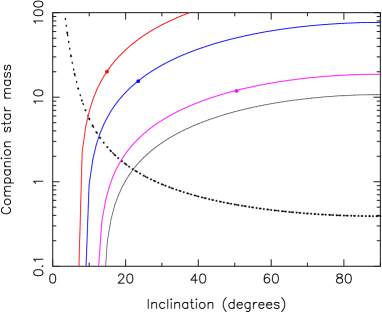
Let us investigate the consequences of the assumption that the absorption line spectrum and the radial velocity curve track the companion star of Cir X–1. Kepler’s third law, the measured a i and Porb define a relation between the inclination of the orbit with respect to the line–of–sight and the mass of the companion star (the solid lines in Fig. 4). From the spectral classification B5–A0I we find (Cox 2000). This gives (where is in the range of 10–15). To avoid the neutron star going through the companion star at periastron, we constrain the radius of the companion star to be smaller than or equal to the periastron distance , with and R⊙. From Fig. 4 this yields , , and for M, 5, 2 and 1.4 M⊙, respectively. The inclination is constrained to be , , and for a 10, 5, 2, and 1.4 M⊙ compact object, respectively. A normal B5–A0 supergiant has a mass of 10 M⊙ which would hence fit–in with a neutron star compact object of Cir X–1. On the other hand it is conceivable that if the companion star of Cir X–1 has indeed spectral type B5–A0I it is no ordinary star due to the preceding evolution (as mentioned above).
The observed type I X–ray bursts (Tennant et al. 1986b) are evidence of a neutron star nature of the compact object. Furthermore, as mentioned in the Introduction the neutron star has to have a magnetic field Gauss. Also the presence of a strong radio jet is not compatible with a high magnetic field neutron star. These findings seem to be at odds with a supergiant (thus young) companion star. We conclude that if the presence of a supergiant companion star in Cir X–1 is confirmed the neutron star magnetic field either decayed quickly to below Gauss or the neutron star was born with such a low field.
Assuming that a neutron star kick at birth did not give the binary system a large systemic velocity, one can calculate the radial velocity for Local Standards of Rest along the direction of Cir X–1 (see for instance Berger & Gies 2001) to find that the systemic radial velocity of km s-1 at the location of Cir X-1 gives a distance of either kpc or 11.8 kpc. A distance of 11.8 kpc is close to the distance derived from the observed type I X–ray bursts (Tennant et al. 1986a; 7.8–10.5 kpc Jonker & Nelemans 2004).
The optical I–band lightcurve (see Fig. 3e) shows a clear brightening near periastron. This is similar in shape to the lightcurves published by Moneti (1992) and Glass (1994), although one has to bear in mind that those lightcurves were obtained when the observed X–ray luminosity of the source was much higher and that the data was phase folded using different ephemerides. The increase in I–band light corresponds to the phase where Paschen emission lines start to become apparent in the spectrum. Hence, it is probable that the enhanced mass transfer rate near periastron is responsible for both effects. For instance, the emission lines could be formed in the accretion stream from the companion star to the compact object and the enhanced I–band emission could be both due to these emission lines as well as due to enhanced continuum emission related to the stream impact site.
In principle it cannot be ruled out that the absorption line spectrum originates in the accretion disc. E.g. the –band spectrum of the high inclination (accretion disc corona) source 2S 0921–630 shows Paschen absorption lines at orbital phases near 0.9 that could well be caused by the line of sight passing through the accretion disc rim (Jonker et al. 2005). Those Paschen absorption lines are not present in the K1III spectral type that has been derived for the companion star in 2S 0921–630 (although X–ray heating effects may result in different spectral types being observed at different orbital phases, cf. the observed spectral type in Cyg X–2 changes from A5–F2 Cowley et al. 1979). However, in radio observations of Cir X–1 superluminal motion has been observed which limits the inclination of the jet axis to the line of sight to (Fender et al. 2004; the limit has been derived assuming a distance of 6.5 kpc, if Cir X–1 is indeed further away as is indicated by the burst properties, then the limit on is more stringent still). If our line–of–sight also goes through the accretion disc rim (at all orbital phases) it implies that the jet–axis is nearly in the plane of the orbit. Hence, it implies that the jet ploughs through the accretion disc if it originates close to the compact object.
Nevertheless, if we assume that the we measured is associated with the binary motion of the accretion disc/neutron star we can derive a limit on the mass of the companion star assuming the neutron star mass is 1.4 M⊙. This limit is a function of the binary inclination and is given by the dotted line in Fig. 4. From the discussion above it would seem that the companion star mass is 0.4 M⊙ since the binary inclination must be high in this scenario. A star of such a mass cannot have evolved off the main–sequence in a Hubble time unless the star was more massive initially (at least 0.8 M⊙) and more than 0.4 M⊙ has been transfered already. However, it is unclear whether such an amount of mass can have been transfered while the orbital eccentricity is still 0.45.
Finally, in this paragraph we consider other possible formation scenarios for the absorption line spectrum. E.g. in the peculiar X–ray binary SS 433 evidence for a circumbinary disc has been found (Blundell et al. 2001), perhaps the absorption lines are formed in such a disc. However, Filippenko et al. (1988) have obtained I–band spectra of SS 433 and their spectra are markedly different from those that we observe from Cir X–1. In SS 433 the Paschen lines are double peaked and in emission whereas we find them to be in absorption except near periastron passage. On the other hand the inclinations at which we observe SS 433 and Cir X–1 are different. In this respect it is interesting to note that according to Tudose et al. (2006) we will be observing the system through the material that is swept up by the approaching radio jet. However, it is difficult to imagine that that material is dense enough and has a velocity low enough to cause the narrow absorption lines. Finally, in all these scenario’s the velocity changes of the absorption lines with orbital phase are difficult to explain.
A potential way to determine whether the measured radial velocity curve is associated with the companion star is to obtain a high resolution spectrum. Such a spectrum could reveal narrow spectral features and allow for a better spectral classification e.g. the observed absorption feature near 8685 Å consists of a blend of several narrow lines if the spectrum is from the companion star (Munari & Tomasella 1999) and if the companion star is an A–star the Ca II absorption triplet can be separated from the Paschen lines. Furthermore, the rotational broadening of the spectral lines could be measured. Finally, due to precession of the orbit (i.e. apsidal motion), the anomalous period as measured by the time between periastron passages is different from the period that would be measured by eclipse timing (i.e. the sidereal period). Hence, if the X–ray dips in Cir X–1 are due to (grazing) eclipses the sidereal period will over time differ from the anomalous period.
Acknowledgments
The authors are grateful to the referee, Dr. D. Gies, for his comments that helped improve the Paper. We would like to thank the Director of ESO for approving these DDT observations. The use of the spectral analysis software package molly written by prof. Tom Marsh is acknowledged. PGJ acknowledges support from NASA grants NNG05GN20G and NNG05GN27G. PGJ, GN and CGB acknowledge support from the Netherlands Organisation for Scientific Research.
References
- Allen & Strom (1995) Allen, L. E., Strom, K. M., 1995, AJ, 109, 1379
- Balona & Crampton (1974) Balona, L., Crampton, D., 1974, MNRAS, 166, 203
- Berger & Gies (2001) Berger, D. H., Gies, D. R., 2001, ApJ, 555, 364
- Bildsten (1995) Bildsten, L., 1995, ApJ, 438, 852
- Blundell et al. (2001) Blundell, K. M., Mioduszewski, A. J., Muxlow, T. W. B., Podsiadlowski, P., Rupen, M. P., 2001, ApJ, 562, L79
- Brandt et al. (1996) Brandt, W. N., Fabian, A. C., Dotani, T., Nagase, F., Inoue, H., Kotani, T., Segawa, Y., 1996, MNRAS, 283, 1071
- Clark et al. (2003) Clark, J. S., Charles, P. A., Clarkson, W. I., Coe, M. J., 2003, A&A, 400, 655
- Clark et al. (2005) Clark, J. S., Negueruela, I., Crowther, P. A., Goodwin, S. P., 2005, A&A, 434, 949
- Clarkson et al. (2004) Clarkson, W. I., Charles, P. A., Onyett, N., 2004, MNRAS, 348, 458
- Cowley et al. (1979) Cowley, A. P., Crampton, D., Hutchings, J. B., 1979, ApJ, 231, 539
- Cox (2000) Cox, A. N., 2000, Allen’s astrophysical quantities, Allen’s astrophysical quantities, 4th ed. Publisher: New York: AIP Press; Springer, 2000. Editedy by Arthur N. Cox. ISBN: 0387987460
- Danks & Dennefeld (1994) Danks, A. C., Dennefeld, M., 1994, PASP, 106, 382
- Fender et al. (1998) Fender, R., Spencer, R., Tzioumis, T., Wu, K., van der Klis, M., van Paradijs, J., Johnston, H., 1998, ApJ, 506, L121
- Fender et al. (2004) Fender, R., Wu, K., Johnston, H., Tzioumis, T., Jonker, P., Spencer, R., van der Klis, M., 2004, Nat, 427, 222
- Fender & Hendry (2000) Fender, R. P., Hendry, M. A., 2000, MNRAS, 317, 1
- Filippenko et al. (1988) Filippenko, A. V., Romani, R. W., Sargent, W. L. W., Blandford, R. D., 1988, AJ, 96, 242
- Glass (1994) Glass, I. S., 1994, MNRAS, 268, 742
- Horne (1986) Horne, K., 1986, PASP, 98, 609
- Iaria et al. (2005) Iaria, R., Spanò, M., Di Salvo, T., Robba, N. R., Burderi, L., Fender, R., van der Klis, M., Frontera, F., 2005, ApJ, 619, 503
- Johnston et al. (1999) Johnston, H. M., Fender, R., Wu, K., 1999, MNRAS, 308, 415
- Johnston et al. (2001) Johnston, H. M., Wu, K., Fender, R., Cullen, J. G., 2001, MNRAS, 328, 1193
- Jonker & Nelemans (2004) Jonker, P. G., Nelemans, G., 2004, MNRAS, 354, 355
- Jonker et al. (2005) Jonker, P. G., Steeghs, D., Nelemans, G., van der Klis, M., 2005, MNRAS, 356, 621
- Joss & Li (1980) Joss, P. C., Li, F. K., 1980, ApJ, 238, 287
- Kaluzienski et al. (1976) Kaluzienski, L. J., Holt, S. S., Boldt, E. A., Serlemitsos, P. J., 1976, ApJ, 208, L71
- Le Borgne et al. (2003) Le Borgne, J.-F., et al., 2003, A&A, 402, 433
- Margon et al. (1971) Margon, B., Lampton, M., Bowyer, S., Cruddace, R., 1971, ApJ, 169, L23
- Moneti (1992) Moneti, A., 1992, A&A, 260, L7
- Munari (2000) Munari, U., 2000, in Porceddu, I., Aiello, S., eds., Molecules in Space and in the Laboratory, p. 179
- Munari & Tomasella (1999) Munari, U., Tomasella, L., 1999, A&AS, 137, 521
- Murdin et al. (1980) Murdin, P., Jauncey, D. L., Lerche, I., Nicolson, G. D., Kaluzienski, L. J., Holt, S. S., Haynes, R. F., 1980, A&A, 87, 292
- Negueruela et al. (2006) Negueruela, I., Smith, D. M., Harrison, T. E., Torrejón, J. M., 2006, ApJ, 638, 982
- Podsiadlowski et al. (2002) Podsiadlowski, P., Rappaport, S., Pfahl, E. D., 2002, ApJ, 565, 1107
- Predehl & Schmitt (1995) Predehl, P., Schmitt, J. H. M. M., 1995, A&A, 293, 889
- Saz Parkinson et al. (2003) Saz Parkinson, P. M., et al., 2003, AAS/High Energy Astrophysics Division, 7, astroph0303402
- Schlegel et al. (1998) Schlegel, D. J., Finkbeiner, D. P., Davis, M., 1998, ApJ, 500, 525
- Schulz (1999) Schulz, N. S., 1999, ApJ, 511, 304
- Schulz & Brandt (2002) Schulz, N. S., Brandt, W. N., 2002, ApJ, 572, 971
- Silva & Cornell (1992) Silva, D. R., Cornell, M. E., 1992, ApJS, 81, 865
- Stetson (1987) Stetson, P. B., 1987, PASP, 99, 191
- Stetson (2000) Stetson, P. B., 2000, PASP, 112, 925
- Stewart et al. (1993) Stewart, R. T., Caswell, J. L., Haynes, R. F., Nelson, G. J., 1993, MNRAS, 261, 593
- Tauris & Savonije (1999) Tauris, T. M., Savonije, G. J., 1999, A&A, 350, 928
- Tennant et al. (1986a) Tennant, A. F., Fabian, A. C., Shafer, R. A., 1986a, MNRAS, 221, 27P
- Tennant et al. (1986b) Tennant, A. F., Fabian, A. C., Shafer, R. A., 1986b, MNRAS, 219, 871
- Tudose et al. (2006) Tudose, V., Fender, R. P., Kaiser, C. R., Tzioumis, A. K., van der Klis, M., Spencer, R., 2006, ArXiv Astrophysics e-prints