High resolution optical spectroscopy of an LBV-candidate inside the Cyg OB2 association
Abstract
For the first time, we obtained the high-resolution ( and 60000) optical spectra for the extremely luminous star No. 12, associated with the IR–source IRAS 20308+4104, a member of the Cyg OB2 association. We have identified about 200 spectral features in range 4552–7939 ÅÅ, including the interstellar NaI, KI lines and numerous DIBs, which are the strongest absorption lines in the spectrum, along with the HeI, CII, and SiII lines. A two-dimensional spectral classification indicates that the star’s spectral type is . Our analysis of the data shows the presence of a gradient in the stellar atmosphere, caused by the infall of matter onto the star. The strong H emission displays broad Thompson wings and time-variable core absorption, providing evidence that the stellar wind is inhomogeneous, and a slightly blue-shifted P Cyg type absorption profile. We concluded that the wind is variable in time.
keywords:
stars: high luminous – stars: LBV – individual: Cyg OB2–No.121 Introduction
Study of mass loss and chemical composition variations in the surface layers are important for our understanding of the evolution of massive stars. It is crucial to establish the evolutionary stage and the star’s luminosity. One widely used approach to stellar evolution study is to investigate stars inside clusters and groups: the evolutionary stage, age, and luminosity can be determined more reliably for group members, whereas these characteristics are rather uncertain for field stars. It is especially important to study group members that are rare, such as LBV–stars or Wolf–Rayet stars. From this point of view, the Cyg OB2 (or VI Cyg) association, with an age of several million years, is of special interest. The Cyg OB2 association contains a group of high luminosity stars with very high masses (about 100 ), and that is so large that the association may be considered as a young globular cluster [[1]]. According to Massey et al. [[2]], unevolved – and –stars have been identified in the association, as well as an LBV candidate–the variable star No. 12 from the list by Schulte [[3]]. Hereafter we will refer to this star as Cyg OB–No. 12. The star Cyg OB2–No. 12 is among the brightest OB stars in the IR, due to the presence of circumstellar matter lost by the star via its strong wind [[4]]. The star is identified with the IR source IRC+40430 = IRAS 20308+4104. For a association distance of , the star luminosity is [[5]] and its bolometric absolute magnitude is [[6]]. Massey and Thompson [[6]] classified the star as B5 Ie, and Souza and Lutz [[7]] as B8 Ia, whereas the authors [[8]] considered it as one of brightest A–supergiants in Galaxy. Later, Massey et al. [[2]] confirmed the LBV candidate status of Cyg OB2–No. 12 based on its membership in an association whose turnoff point is near that for the Milky Way’s most massive stars. The luminosity of Cyg OB2–No. 12 from its association membership indicates that the star is one of the four most luminous stars in our Galaxy (see, for instance, the diagram for S Dor stars in [9] and in the review of de Jager [[5]]). However, the star’s visible flux is strongly attenuated due to the large distance to the association and the presence of strong extinction: the observed magnitudes are , . It was recognized long ago that, apart from being distinguished by its high luminosity, Cyg OB2–No. 12 also displayed very high reddening [[10, 11]]. Based on their photometric study of a stellar sample in Cyg OB2, Torres-Dodgen et al. [[12]] estimated the distance and its distance kpc, and confirmed that the high interstellar reddening for the association members (with a mean value ) was satisfied by a normal law. The exception is Cyg OB2–No. 12, whose visual extinction exceeds (!). Obviously, spectroscopic studies of stars experiencing such a high degree of reddening are possible only thanks to the relatively small distance to the association and the high absolute luminosities of many of its members.
Lozinskaya et al. [[13]] also emphasized that the group of massive stars inside the Cyg OB2 association probably possessed the Galaxy’s strongest stellar winds, which are capable of significantly affecting the ambient interstellar gas over some two to three million years. Cyg OB2–No. 12 is one of the few late B stars known to radiate thermal radio emission [[4]]. The variability of its radio flux is surprising [[14]]. White and Becker [[15]] estimated the mass loss rate to be /yr, that is too high for a normal supergiant, but consistent with the extreme luminosity of Cyg OB2–No. 12. According to the criterion suggested by Humphreys and Davidson [[8]], a mass loss rate that high indicates that Cyg OB2–No. 12 is an LBV star. Through his modeling of the IR spectral energy distribution, Leitherer et al. [[16]] estimated the star’s effective temperature to be =13600 K and the envelope’s electron temperature to be =5000 K. The combination of a hot atmosphere and a cool, dense envelope found for Cyg OB2–No. 12 is not unique: such structures are known for S Dor stars [[17]]. The light from Cyg OB2–No. 12 is polarized [[18]]. The broadband polarimetry of Schulz and Lenzen [[17]] at 0.3–1.1 displayed linear polarization exceeding 10%, providing evidence for a nonspherical distribution of the circumstellar material, and hence for a nonspherically symmetrical stellar wind. The accumulated observations show that Cyg OB2–No. 12 is a crucial object for studies of late evolutionary stages for massive stars, creating the need for high-resolution optical spectroscopy that would make it possible to classify the spectrum, and thereby refine estimates of the star’s fundamental parameters and the characteristics of its stellar wind.
2 Observations and data reducing
Our spectroscopic observations of Cyg OB2–No. 12 were acquired with the 6 m telescope of the Special Astrophysical Observatory (Russian Academy of Sciences) using echelle spectrographs. Our first set of observations, obtained on June 12, 2001 using the PFES spectrometer [[19]] with a 1040x1170-pixel CCD at the primary focus, yielded a spectrum in the interval 4542–7939 ÅÅ with a resolution of (20 km/s). A second observing run was made on April 12, 2003 at the Nasmyth focus using the NES spectrograph [[20]] equipped with an image slicer [[21]]. We obtained a spectrum in the range 5273–6764 ÅÅ with a resolution of (5 km/s) using a 2048x2048 CCD. We used the PFES spectrometer to acquire spectra of bright, luminous B stars for use in spectral classification (see Section 3.1 for details). We removed cosmic-ray traces via a median averaging of two consecutive exposures. The wavelength calibration was performed using the spectrum of a ThAr hollow-cathode lamp. We recorded the spectrum of the hot, rapidly rotating star HR 4687, which has broad lines, each night to subtract the telluric spectrum. The preliminary reduction of the CCD images of our echelle spectra (removal of cosmic rays, background subtraction, wavelength calibration, and extraction of the spectral orders) was performed using the MIDAS (98NOV version) ECHELLE package. The final reduction (continuum normalization, measurements of radial velocities and equivalent widths for various spectral features) was done using the DECH20 program package [[22]].
3 Results
3.1 Main peculiarities of the Cyg OB2–No. 12 spectrum
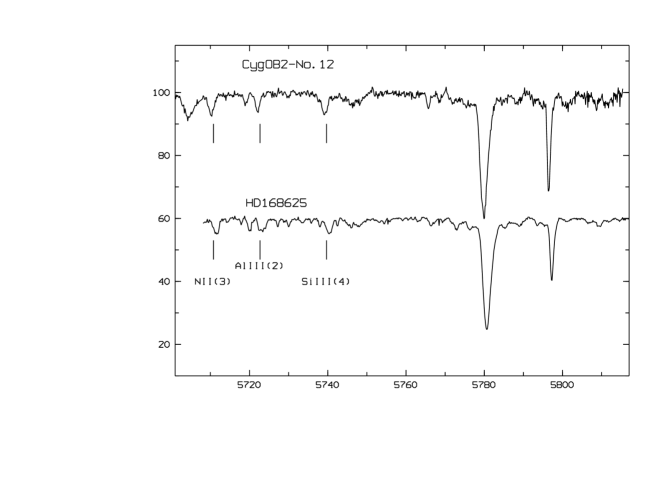
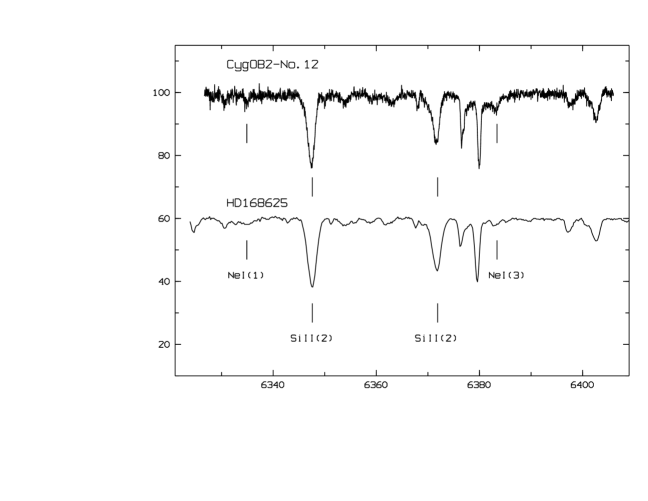
The main features of Cyg OB2–No. 12 are evident even in low-resolution spectra [[10]]: it is an early-type, very luminous star with very strong H emission and very strong diffuse interstellar bands (DIBs). The Na D1,2 doublet lines display no obvious peculiarities. Wendker and Altenhoff [[4]] note that the H profile is probably variable. Our high-resolution spectra permits us for the first time to make detailed line identifications, classify the spectrum, and measure radial velocities. Table 1 presents identifications of the spectral features in the spectra obtained on June 12, 2001 and April 12, 2003, along with their equivalent widths , residual intensities , and heliocentric radial velocities . Figs. 1 and 2 display fragments of the spectra of Cyg OB2–No. 12 and of the hypergiant HD 168625 (B6 Ia+, ). The spectrum of HD 168625 was taken on June 19, 2001 with the PFES spectrometer. These spectra are very similar, demonstrating that the stars have similar temperatures and luminosities. In addition, DIBs are equally well represented in these spectra and have similar intensities. The strongest of them, the 5780 and 5797 Å bands, dominate in Fig. 1, but even the weak DIBs at 5766, 5773 Å, etc. have comparable intensities to the stellar NII, AlIII, and SiIII absorption. The DIBs at 6376 and 6379 Å in Fig. 2 are almost as deep as the SiII (2) absorption. The majority of spectral features are shallow absorption lines with depths of 0.02-0.03 of the continuum level, whose depths, equivalent widths, and radial velocities are uncertain (marked with colons in Table 1). The signal-to-noise ratio in the blue was not high, and we used nonstandard criteria for our quantitative spectral classifications. The sets of classification criteria and the wavelength intervals used for 2001 and 2003 overlap only partially. The classification techniques are described in more detail in [[23]]. Here we note only that the HeI, CII, NII, AlIII, SiII, SII, and FeII lines were used. The calibration relations were based on the supergiant standard stars Ori (O9.5Ia), HD 13854 (B1.2Iab), HD 14134 (B2.2Ia), HD 206165=9 Cep (B2.5Ib), HD 198478=55 Cyg (B3.4Ia), HD 164353=67 Oph (B3.6Ib, ), HD 58350= CMa (B3.9Ia), HD 13267=5 Per (B5Ia), HD 15497 (B6Ia, ), HD 183143 (B7.7Ib, ), HD 34085= Ori (B8.2Ia, ), and HD 21291 (B9.3Ib, ). A comparison of the depths and equivalent widths in our two spectra shows that, although the depths were slightly smaller in 2001 than in 2003 (due to the lower resolution), the equivalent widths did not differ systematically. It is thus natural that the spectral types derived for Cyg OB2–No. 12 for the 2001 and 2003 data were the same within the errors: B5.00.5 and B4.80.5, respectively. The luminosity class for both Cyg OB2–No. 12 and HD 168625 is Ia+. Evidence for the star’s high luminosity is also provided by the high intensity of the OI 7773 Å IR–triplet, whose equivalent width is =1.14 Å, corresponding to an absolute magnitude of .
3.2 The H line profile
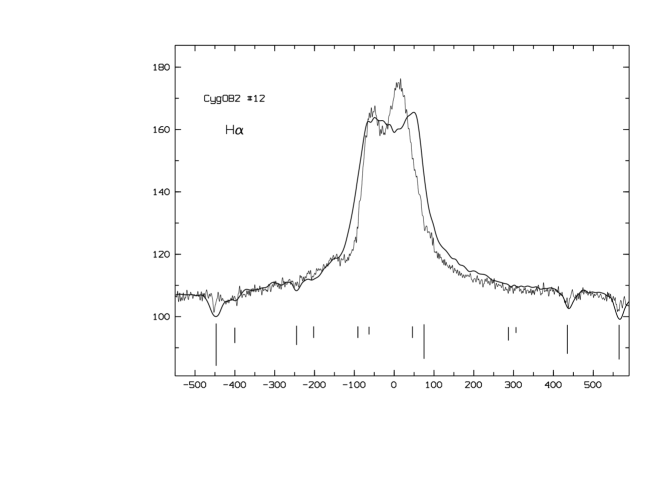
Based on two spectra with 3 Å resolution taken three days apart, Souza and Lutz [[7]] concluded that the radial velocity derived from the H emission line was variable. An absorption line at 6532 Å was detected in one of the spectra, whose posi- tion corresponds to an expansion velocity of about km/s. The spectrum with 7 Å resolution presented in [[18]] shows a similar absorption feature (6526 Å). Our high-resolution spectra enabled us to study the fine structure of the H emission (Fig. 3). The profile has broad wings extending to at least 1000 km/s is slightly asymmetric, with a weak absorption visible in its left wing, suggestive of a P Cygni type profile; and displays absorption features with variable shape in the core. These absorption features correspond to transitions in the H line rather than to the telluric spectrum, whose contribution was carefully removed from the spectrum. We are inclined to interpret the emission wings of the H profile as being due to Thompson scattering on the envelope’s free electrons [[24, 25, 26]]. Stark emission wings are formed in denser media, such as the deexcitation region behind the shock front in the atmosphere of W Vir [[27]]. Following Wolf et al. [[28]], let us estimate the efficiency of Thompson scattering for a hot envelope in which the hydrogen is completely ionized. In accordance with [[15]], let us assume a mass-loss rate of yr and a radius for the envelope equal to twice the stellar radius ( [[14]]). It is more difficult to estimate the escape velocity based on the two absorption features observed in the H wing [[7, 18]]. The value of 1400 km/s used in [[15]] seems too high. Note that the shell forming the narrow absorption feature must be spatially separated from the shell forming the P Cygni profile. It is not clear why the presence of this shell is not manifest in the spectrum taken three days later [[7]]. The distance covered at such a speed over three days is about cm, which is a factor of four higher than the envelope’s radius estimated in an adiabatic cooling wind model, based on observations of free–free emission transitions at 6 cm [[15]]. This would imply that the optical spectral features are formed further from the star than the radio emission. This discrepancy can be removed if we reject the assumption about spherical symmetry for the envelope. In fact, if the wind extends differently in different directions, its temperature in a spherical approximation will be lower than the real temperature, as is observed (5000 1500 K [[15]]). For the above high escape velocity and large radius, the optical depth to Thompson scattering in the spherically symmetric approximation [[28]] is insignificant, about 0.01. If the escape velocity is lower by an order of magnitude, as is suggested in [[14]] (see also below our estimate of the highest wind velocity), and the wind is not spherically symmetric, the Thompson scattering optical depth increases by more than an order of magnitude. We conclude that the absorption features we have detected at the peak and in the blue wing of the H line are variable, even after we have taken into account the different spectral resolutions of our observations.
3.3 Interstellar bands
The strength of the interstellar (and circumstellar) extinction of the light from Cyg OB2–No. 12 has made the star a popular target for studies of interstellar spectral features. In particular, the strong absorption towards Cyg OB2–No. 12 is of considerable interest from the point of view to investigate the discrete distribution of the absorbing material (cf., for example, Scappini et al. [[29]] and references therein). For the first time Souza and Lutz [[30]] detected IR–bands of the molecule, and molecular features in the spectrum of Cyg OB2–No. 12 were subsequently analyzed in a number of studies. In their high-spectral resolution study, Gredel and Münch [[31]] detected a four-components structure in the IR (1,0) band of the molecule’s Phillips system, which displayed a range of velocities from to +13.2 km/s, whereas Chaffee and White [[32]] observed two components in the KI line with velocities from to km/s. Based on echelle spectra, Gredel et al. [[33]] analyzed the physical conditions for the formation of the and molecules in detail, and also detected an interstellar RbI line. We also note that the star’s spectrum is densely populated by interstellar features, as can clearly be seen in Figs. 1 and 2. As follows from Figs. 1 and 2 and Table 1, the intensities of the main DIBs and of the NaI lines are higher than those of the strongest photospheric absorption lines (HeI, CII, SiII) in the spectrum of Cyg OB2–No. 12. We discuss the structure of the NaID lines below, in connection with the systemic velocity of Cyg OB2–No. 12.
3.4 The radial velocities pattern
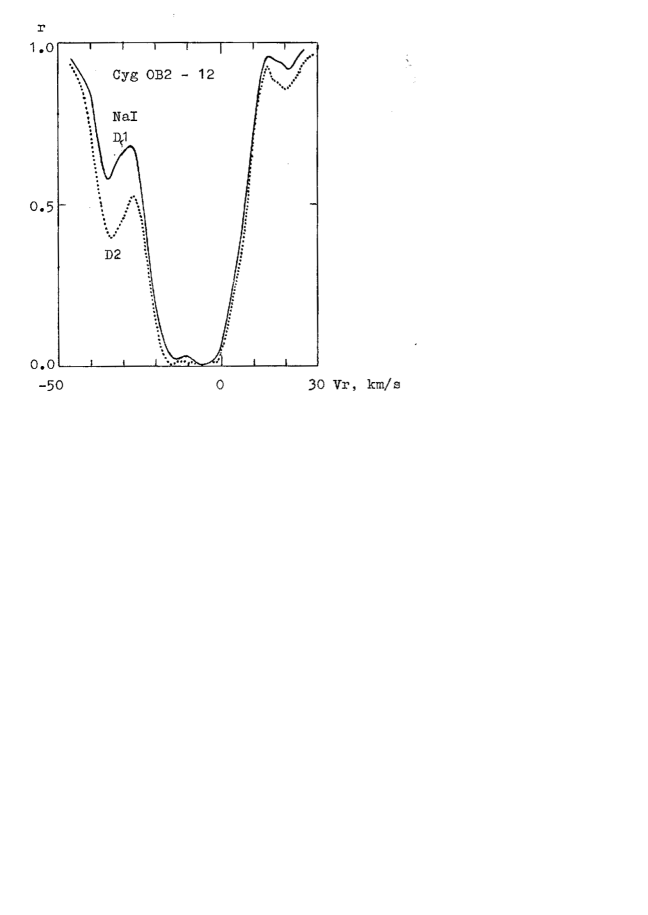
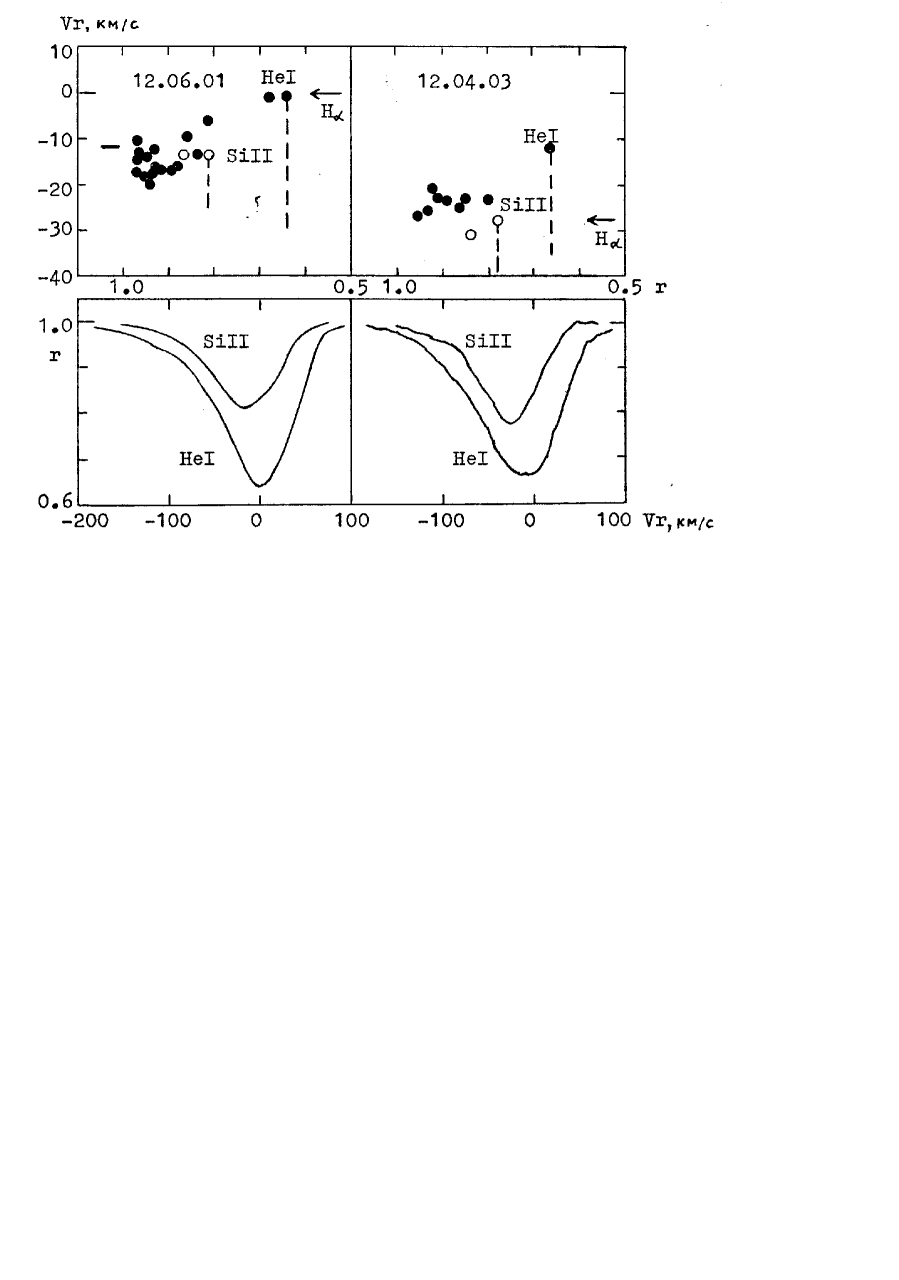
Table 2 presents radial velocities for individual lines and averages for groups combining lines with similar residual intensities. Possible systematic errors for the velocities in Tables 1 and 2 estimated from the telluric and interstellar lines are within 2 and 1 km/s for the June 12, 2001 and April 12, 2003 spectra, respectively. It is also necessary to take into account the differing spectral resolutions when comparing (NaI) for the 2001 and 2003 spectra. Fig. 4 shows that, in the April 2003 spectrum, the main component with and km/s is clearly separated from a component with km/s that is half as strong. The June 2001 PFES spectrum does not separate these components, but the asymmetry of the profile is appreciable, with the blue wing being less steep. The random measurement errors for individual lines can be judged from the scatter of the circles in the upper panels of Fig. 5, with the following caveats. The velocities were measured from absorption cores, i.e., from the lowest parts of the profiles, with exclusion of the very deepest portions having much lower intensity gradients. Of the two lines whose profiles are displayed in the bottom panels of Fig. 5, the core in the June 2001 spectrum is sharper for the HeI absorption line, so that its position can be measured more accurately, whereas the SiII absorption line is sharper in the April 2003 spectrum. The SiII (2) lines (open circles in Fig. 5) are obviously blue shifted relative to other absorption lines with the same depths, but the other lines may also possess small mutual shifts, increasing the scatter of the data points in the diagrams. In addition, many of the lines are asymmetric (as is also clearly visible in Fig. 5), and a small shift in has a considerable influence on the resulting value of .
3.4.1 The systemic velocity
Unfortunately, there are no data on the radial velocities of any stars of the association besides Cyg OB2–No. 12 itself and the spectroscopic binary Cyg OB2–No. 5, whose velocity is very uncertain [[34]]. However, a rough estimate of the systemic velocity, , for Cyg OB2–No. 12 is possible based on the differential rotation of the Galaxy. In our case, this estimate is facilitated by the fact that the dependence of the velocity on distance is weak in the direction toward Cyg OB2 (along the Cygnus arm), and almost disappears in the region of the Cyg OB2 association [[35]]. Under this circumstance we used a wider range of acceptable distances for stars, HII regions, and cool gaseous clouds whose radial velocities are to be used to estimate . The relation between the heliocentric radial velocity, , and Galactic longitude, , for stars between 1 and 2 kpc selected from the catalogs [[36, 37, 38]] gives the mean value km/s for the longitude of Cyg OB2 (). The peak of the interstellar H emission profile at is also at km/s [[13, 39]], and the highest intensity of the radio emission is at km/s [[40]]. A similar value for the Cyg OB2 association (about km/s) results from the detailed analysis of the motions of stars and interstellar matter in the Cygnus arm carried out by Sitnik et al. [[41]].
Let us supplement the above estimates with those obtained specifically for Cyg OB2–No. 12. According to McCall et al. [[42]], the emission has two intensity peaks, with and km/s, and the interstellar absorption profiles of KI, , , etc. have up to five components with values from to 12 km/s. The profiles of the interstellar NaI doublet in our high resolution spectrum (Fig. 4) have two main components: the strongest is saturated and has km/s, while the shallower one is blueshifted and has km/s. A similar division into components with the same intensity ratio and velocities ( and km/s) is observed in the NaI D2 line for the nearby hypergiant P Cygni [[43]]. The blue shifted component is probably circumstellar, and is associated with the stellar wind. Judging from its velocity, the main absorption feature is formed immediately in front of the star, in the gas complex that Sitnik et al. [[41]] call BB. There are dips at the bottom of this absorption feature, whose velocities ( and km/s) coincide with those for the components of the KI line according to Chaffee and White [[32]] and McCall et al. [[42]]. Finally, we should include our velocity estimates for stationary envelope emission lines (the first rows of Table 2). The weak FeII 7513 Å emission line, which is unfortunately the only one, gives km/s; the upper, symmetric part of the H profile, which experiences minimal distortion from the absorption components, gives , . . . km/s.
As expected, all these estimates are close to each other. We adopt km/s as the systemic velocity for Cyg OB2–No. 12.
3.4.2 Temporal and line-to-line variations of
Fig. 5 and the data in Table 1 show that the radial velocities measured from the absorption cores vary in time and change with the line intensity. In both our spectra, the weakest lines () yield values lower than (by 5 and 14 km/s, respectively, in 2001 and in 2003), testifying to variable rates of expansion of the layers where these lines are formed. Stronger lines show positive shifts relative to weaker ones, with the exception of the SiII lines, marked in Fig. 5 as open circles. The slope of the filled-circle chain in the left panel of Fig. 5, corresponding to June 12, 2001, is quite evident, whereas it is poorly represented in the upper right panel of Fig. 5 due to the limited spectral range and some deficiencies of the April 12, 2003 data. The core of the deepest available absorption line, HeI 5876 Å, shows the highest , which exceeded by 10 km/s on June 12, 2001; according to McCall et al. [[44]], this shift reached values as large as 22 km/s.
3.4.3 Manifestations of the wind
The stellar wind from Cyg OB2–No. 12 is manifest itself most clearly in the H profile. Fig. 3 shows that the profile shape varies with time, but its principal features are preserved: strong emission, with a dip at the short-wavelength slope, a sheared peak, and extended Thompson wings. The blueshifted absorption is barely visible in the June 2001 spectrum and is more pronounced in the April 2003 spectrum, but can be traced at least to km/s in both cases; i.e., to the same limit that is reached by the blue wings of the absorption lines presented in Fig. 5. The wind’s velocity limit is about 150 km/s. The intensity inversions in the upper part of the H profile are especially interesting. They indicate that the wind from Cyg OB2–No. 12 is not uniform: in addition to the high velocity material noted above, it contains a fair amount of material that is nearly stationary relative to the star, or is even falling onto the stellar surface. The coexistence of lines with direct and inverse P Cygni profiles in the same spectrum, and even combinations of such features in the profile of the same line, has been noted for some LBVs at their maximum brightness [[45, 46]]. Such a behavior leads us to reject the spherically symmetric wind model. It is possible that the slow part of the wind also contributes to the absorption profiles; spectroscopic monitoring is needed to check this hypothesis. So far, this possibility is supported by the coincident velocities for the central dips of the H line and the wellformed cores of strong absorption lines (HeI 5876 Å in 2001 and SiII 6347 Å in 2003), as well as by the fact that the shift of all the absorption lines in the 2003 spectrum towards short wavelengths relative to their positions in 2001 was accompanied by a similar shift of the central dip in H. At any rate, both the hydrogen lines and the strongest absorption lines in the visual spectrum Cyg OB2–No. 12 (for the available part of the spectrum, these are the HeI and SiII lines) are partially formed in the wind.
4 Conclusions
Our detailed spectroscopy of the extremely luminous star Cyg OB2–No. 12 in the stellar association Cyg OB2 at 4552–7939 ÅÅ has enabled us to identify about 200 spectral features, including numerous interstellar features (NaI, KI, and DIBs). Using spectral classification criteria developed for red wavelengths, we have determined the star’s spectral type () and luminosity class (). The intensity of the IR oxygen triplet, OI 7773 Å, leads to an absolute magnitude for the star . Our analysis of the radial-velocity pattern indicates the presence of a radial velocity gradient in the atmosphere due to the infall of matter onto the star. We have detected fine structure of the profile of the strong H emission: broad emission wings (to km/s), absorption at the peak that varies with time, and weak P Cygni absorption features corre sponding to expansion velocities up to 150 km/s. The intensity inversion at the H peak provides evidence that the stellar wind is not uniform: in addition to that part of the wind that moves away from the star, there is also material that is at rest relative to the star, or is even falling onto the stellar surface. The radial velocities measured from the absorptionline cores vary with time and with the line intensity. The weakest lines () in our two spectra give values lower than (by 5 and 14 km/s, respectively, in 2001 and 2003), testifying to a variable rate of expansion of the layers in which they are formed. Our discovery of evidence that the wind is variable shows the necessity of spectroscopic monitoring of this star.
5 Acknowledgements
We are grateful to M.V. Yushkin for his assistance in the observations at the 6 m telescope and in the preliminary data reduction, to V.E. Panchuk for fruitfull discussions of our results, and to N.S. Tavolganskaya for her help with the preparation of this manuscript. Our study of the spectra of extremely luminous stars are supported by the Russian Foundation for Basic Research (project No. 02–02–16085a), and by the research program “Extended Objects in the Universe” of the Department of Physical Sciences RAS.
References
- [1] 1. F. Comeron, A. Pasquali, A. Rodighiero, et al. 2002. Astron. & Astrophys. 389, 874
- [2] 2. P. Massey, K. DeGioia-Eastwood, and E. Waterhouse. 2001. Astron. J. 121, 1050
- [3] 3. D.H. Schulte. 1958. Astrophys. J. 128, 41
- [4] 4. H.J. Wendker and W.J. Altenhoff. 1980. Astron. & Astrophys. 92, L5
- [5] 5. C. de Jager. 1998. Astron. & Astrophys. Rev. 8, 145
- [6] 6. P. Massey and A.B. Thompson. 1991. Astron. J. 101, 1408,
- [7] 7. S.P. Souza and B.L. Lutz 1980. Astrophys. J. 235, L87,
- [8] 8. R.M. Humphreys and K. Davidson. 1994. Publ. Astron. Soc. Pac. 106, 1025
- [9] 9. A.M. van Genderen. 2001. Astron. & Astrophys. 366, 508
- [10] 10. W.W. Morgan, H.L. Johnson, and N. G. Roman. 1954. Publ. Astron. Soc. Pac. 66, 85
- [11] 11. S. Sharpless. 1957. Publ. Astron. Soc. Pac. 69, 239
- [12] 12. A.V. Torres-Dodgen, M. Carroll, and M. Tapia. 1991. Mon. Not. R. Astron. Soc. 249, 1
- [13] 13. T. A. Lozinskaya, V.V. Pravdikova, and A.V. Finogenov. 2002. Astron. Lett. 28, 223
- [14] 14. J.H. Bieging, D.C. Abbott, and E. B. Churchwell. 1989. Astrophys. J. 340, 518
- [15] 15. R.L. White and R.H. Becker. 1983. Astrophys. J. 272, L19
- [16] 16. C. Leitherer, O. Stahl, B. Wolf, and C. Bertout. 1984. Astron. & Astrophys. 140, 199
- [17] 17. A. Schulz and R. Lenzen. 1983. Astron. & Astrophys. 121, 158
- [18] 18. K.H. Nordsieck. 1974. Publ. Astron. Soc. Pac. 86, 324
- [19] 19. V.E. Panchuk, I.D. Najdenov, V.G. Klochkova, et al. 1998. Bull. Spec. Astrophys. Obs. 44, 127
- [20] 20. V.E. Panchuk, N.E. Piskunov, V.G. Klochkova, et al. 2002. Preprint Special Astrophys. Obs., No. 169
- [21] 21. V.E. Panchuk, M.V. Yushkin, and I.D. Najdenov. 2003. Preprint Special Astrophys. Obs., No. 179
- [22] 22. G.A. Galazutdinov. 1992. Preprint Special Astrophys. Obs., No. 92
- [23] 23. V.G. Klochkova, E.L. Chentsov, N.S. Tavolganskaya, & G.A. Proskurova. 2003. Preprint Special Astrophys. Obs., No. 183
- [24] 24. J.M. Marlborough. Astrophys. J. 1969. 156, 135
- [25] 25. J.I. Castor, L.F. Smith, and D. van Blerkom. 1970. Astrophys. J. 159, 1119
- [26] 26. A.P. Bernat and D.L. Lambert. 1978. Publ. Astron. Soc. Pac. 90, 520
- [27] 27. A. L ‘ebre and D. Gillet. 1992. Astron. & Astrophys. 255, 221
- [28] 28. B. Wolf, O. Stahl, M.J.H. de Groot, and C. Sterken. 1981. Astron. & Astrophys. 99, 351
- [29] 29. F. Scappini, S. Casu, C. Cecchi-Pestellini, and M. Olberg. 2002. Mon. Not. R. Astron. Soc. 337, 495
- [30] 30. S.P. Souza and B.L. Lutz. 1977. Astrophys. J. 216, L49
- [31] 31. R. Gredel and G. Münch. 1994. Astron. & Astrophys. 285, 640
- [32] 32. F.H. Chaffee, Jr. and R.E. White. 1982. Astrophys. J., Suppl. Ser. 50, 169
- [33] 33. R. Gredel, J.H. Black, and M. Yan. 2001. Astron. & Astrophys. 375, 553
- [34] 34. B. Bohannan and P.S. Conti. 1976. Astrophys. J. 204, 797
- [35] 35. J. Brand and L. Blitz. 1993. Astron. & Astrophys. 275, 67
- [36] 36. R.M. Humphreys. 1978. Astrophys. J. Suppl. 38, 309
- [37] 37. D. Hoffleit and C. Jaschek. 1982. The Bright Stars Catalogue. Yale Univ. Observ.
- [38] 38. D. Hoffleit, M. Saladyga, and P. Wlasuk. 1983. Supplement to the Bright Stars Catalogue. Yale Univ. Observ.,
- [39] 39. R.J. Reynolds. 1983. Astrophys. J. 268, 698
- [40] 40. T.M. Dame, D. Hartmann, and P. Thaddeus. 2001. Astrophys. J. 547, 792
- [41] 41. T.G. Sitnik, A.M. Mel’nik, and V.V. Pravdikova. (2001). Astron. Rep. 45, 34
- [42] 42. B.J. McCall, K.H. Hinkle, T.R. Geballe, et al. 2002. Astrophys. J. 567, 391
- [43] 43. L.M. Hobbs. 1969. Astrophys. J. 157, 135
- [44] 44. B.J. McCall, D.G. York, and T. Oka. 2000. Astrophys. J. 531, 329
- [45] 45. B. Wolf and O. Stahl. 1990. Astron. & Astrophys. 235, 340
- [46] 46. O. Stahl, T. Gaeng, C. Sterken, et al. 2003. Astron. & Astrophys. 400, 279
| 12.06.01 | 12.04.03 | |||||||
|---|---|---|---|---|---|---|---|---|
| 1 | 2 | 3 | 4 | 5 | 6 | 7 | 8 | 9 |
| HeI | (48) | 4921.93 | 0.43: | 0.73 | 18: | |||
| FeII | (42) | 4923.92 | 0.13: | 0.9: | ||||
| DIB | 4963.90 | 0.17: | 0.86 | 12: | ||||
| DIB | 4984.81 | 0.92: | ||||||
| NII | (19) | 5001.4: | 0.20: | 0.90: | 5: | |||
| NII | (6) | 5002.70 | 0.93: | |||||
| NII | (19,6) | 5005.15 | 0.13: | 0.91 | ||||
| NII | (24) | 5007.33 | 0.08: | 0.95 | ||||
| SII | (7) | 5009.56 | 0.95: | |||||
| NII | (4) | 5010.62 | 0.12: | 0.94 | 18 | |||
| HeI | (4) | 5015.68 | 0.35 | 0.83 | 14 | |||
| FeII | (42) | 5018.44 | 0.12: | 0.91: | 9: | |||
| SII | (7) | 5032.45 | 0.12: | 0.93: | 17: | |||
| NII | (4) | 5045.10 | 0.96: | |||||
| HeI | (47) | 5047.74 | 0.12: | 0.93: | ||||
| FeIII | (5) | 5073.90 | 0.08: | 0.96: | ||||
| FeIII | (5) | 5086.72 | 0.05: | 0.96: | ||||
| FeIII | (5) | 5127.35 | 0.09: | 0.95: | 12: | |||
| FeIII | (5) | 5156.12 | 0.09: | 0.92: | 10: | |||
| FeII | (42) | 5169.03 | 0.13: | 0.93 | 13 | |||
| FeIII | (113) | 5235.66 | 0.10: | 0.95: | ||||
| FeIII | (113) | 5243.31 | 0.98: | |||||
| FeIII | 5260.34 | 0.97 | ||||||
| FeII | (49,48) | 5316.65: | 0.03: | 0.98: | ||||
| SII | (38) | 5320.73 | 0.04: | 0.97: | 15: | |||
| SII | (38) | 5345.72 | 0.06: | 0.97: | 18: | |||
| DIB | 5404.50 | 0.95: | 12: | |||||
| DIB | 5418.90 | 0.96: | 0.07: | 0.92 | 16: | |||
| SII | (6) | 5428.67 | 0.07 | 0.96 | 19: | 0.05: | 0.96: | 26: |
| SII | (6) | 5432.82 | 0.10 | 0.94 | 20: | 0.13 | 0.91 | 23 |
| SII | (6) | 5453.83 | 0.24 | 0.88 | 16 | 0.21 | 0.86 | 25 |
| SII | (6) | 5473.62 | 0.05 | 0.97 | 18 | 0.09: | 0.94: | |
| DIB | 5487.67 | 0.22 | 0.95 | |||||
| DIB | 5494.10 | 0.07 | 0.92 | 14 | 0.08 | 0.90 | 13 | |
| NII | (29) | 5495.67 | 0.06: | 0.97: | ||||
| DIB | 5508.35 | 0.95 | ||||||
| SII | (6) | 5509.72 | 0.95: | 17: | ||||
| DIB | 5512.64 | 0.04 | 0.96 | 12: | 0.04 | 0.93 | 8: | |
| CII | (10) | 5535.35 | 0.06: | 0.97: | ||||
| DIB | 5541.62 | 0.97 | ||||||
| DIB | 5544.96 | 0.05 | 0.94 | 9 | 0.09: | 0.92 | 12: | |
| SII | (6) | 5564.98 | 0.04: | 0.96: | 27: | |||
| DIB | 5594.59 | 0.98 | 12: | |||||
| SII | (11) | 5606.15 | 0.06 | 0.96 | 13 | 0.09 | 0.95: | 25: |
| DIB | 5609.73 | 0.04 | 0.98 | 10 | 0.04 | 0.96: | 10: | |
| SII | (11) | 5616.64 | 0.98: | 15: | ||||
| SII | (14,11) | 5640.1: | 0.17 | 0.89 | 10: | 0.23 | 0.89 | 24: |
| SII | (14) | 5647.03 | 0.06 | 0.96 | 18: | 0.07 | 0.93 | 26 |
| SII | (11) | 5659.99 | 0.99: | 0.06: | 0.95: | 27: | ||
| SII | (11) | 5664.78 | 0.98 | |||||
| NII | (3) | 5666.63 | 0.13: | 0.92 | 17 | 0.11 | 0.92 | 27: |
| NII | (3) | 5676.02 | 0.12: | 0.95 | 19: | 0.13 | 0.92 | 20: |
| NII | (3) | 5679.56 | 0.23: | 0.89 | 17 | 0.24 | 0.85 | 23 |
| NII | (3) | 5686.21 | 0.13: | 0.96 | 22: | |||
| AlIII | (2) | 5696.60 | 0.10 | 0.93 | 13 | 0.12 | 0.91 | 23 |
| DIB | 5705.20 | 0.25 | 0.92 | 20: | 0.30 | 0.92 | ||
| NII | (3) | 5710.77 | 0.13 | 0.93 | 16 | 0.14 | 0.92 | 16 |
| DIB | 5719.30 | 0.05 | 0.97 | 1 | ||||
| AlIII | (2) | 5722.73 | 0.09 | 0.94 | 20 | 0.06: | 0.96 | 15: |
| SiIII | (4) | 5739.73 | 0.15 | 0.93 | 10 | 0.12 | 0.92 | 19: |
| NII | (9) | 5747.30 | 0.96 | |||||
| DIB | 5766.16 | 0.05 | 0.95 | 8 | 0.06 | 0.96 | 13: | |
| DIB | 5769.04 | 0.03 | 0.98 | 10: | 0.03 | 0.97: | 8: | |
| DIB | 5772.60 | 0.05: | 0.97 | 14: | 0.04 | 0.97: | 10: | |
| DIB | 5775.78 | 0.97: | ||||||
| DIB | 5780.37 | 1.03 | 0.60 | 9 | 0.95 | 0.62 | 8 | |
| DIB | 5785.05 | 0.97: | ||||||
| DIB | 5793.22 | 0.97: | 6: | |||||
| DIB | 5795.16 | 0.96: | 5: | |||||
| DIB | 5796.96 | 0.38 | 0.69 | 9 | 0.35 | 0.69 | 9 | |
| DIB | 5809.24 | 0.06: | 0.97: | 0.05 | 0.96: | 9: | ||
| DIB | 5811.96 | 0.98 | 15: | |||||
| DIB | 5818.75 | 0.97: | 6: | 0.05 | 0.96: | 13: | ||
| DIB | 5828.46 | 0.06: | 0.97 | |||||
| FeIII | (114) | 5833.93 | 0.05: | 0.97 | 15: | 0.07 | 0.96: | 15: |
| DIB | 5842.23 | 0.97 | ||||||
| DIB | 5844.80 | 0.96 | 12 | |||||
| DIB | 5849.80 | 0.16 | 0.88 | 12 | 0.14 | 0.86 | 12 | |
| HeI | (11) | 5875.72 | 0.76 | 0.64 | 2 | 0.82 | 0.66 | 12 |
| NaI | (1) | 5889.95 | 0.40 | 34 | ||||
| NaI | (1) | 5889.95 | 0.92 | 0.11 | 13 | 0.82 | 0.01 | 9 |
| NaI | (1) | 5895.92 | 0.58 | 34 | ||||
| NaI | (1) | 5895.92 | 0.76 | 0.14 | 12 | 0.72 | 0.02 | 9 |
| DIB | 6005.03 | 0.96: | 7: | |||||
| DIB | 6010.65 | 0.30: | 0.95 | 13 | ||||
| DIB | 6019.36 | 0.03: | 0.97 | 14 | 0.03: | 0.98: | 13: | |
| DIB | 6027.48 | 0.06: | 0.98 | 10 | 0.07 | 0.95 | 11 | |
| DIB | 6037.61 | 0.09: | 0.97 | 19: | 0.15 | 0.96 | ||
| OI | (22) | 6046.4: | 0.03: | 0.99: | ||||
| DIB | 6059.67 | 0.05: | 0.98: | 11: | ||||
| DIB | 6065.20 | 0.98: | 18: | 0.04 | 0.97: | 9: | ||
| DIB | 6068.20 | 0.02: | 0.99 | |||||
| NeI | (3) | 6074.34 | 0.04: | 0.98 | 7: | |||
| DIB | 6084.75 | 0.03: | 0.98 | |||||
| PII | (5) | 6087.82 | 0.02: | 0.99: | ||||
| DIB | 6089.78 | 0.06 | 0.94 | 7 | 0.04 | 0.94 | 11 | |
| NeI | (3) | 6096.16 | 0.05 | 0.97: | 8: | |||
| DIB | 6108.05 | 0.98: | 10: | |||||
| DIB | 6113.20 | 0.05 | 0.96 | 14 | 0.06 | 0.96 | 13 | |
| DIB | 6116.80 | 0.03: | 0.98 | 10: | ||||
| DIB | 6118.68: | 0.99 | ||||||
| DIB | 6139.94 | 0.03 | 0.97 | 15 | 0.02 | 0.96 | 10: | |
| NeI | (1) | 6143.06 | 0.05 | 0.97 | 8: | 0.10 | 0.95 | 27 |
| FeII | (74) | 6147.74 | 0.99 | |||||
| OI | (10) | 6156.3: | 0.99 | |||||
| OI | (10) | 6158.18 | 0.98 | 5: | ||||
| DIB | 6161.9: | 0.98 | 10: | |||||
| NeI | (5) | 6163.59 | 0.98 | |||||
| PII | (5) | 6165.59 | 0.98: | |||||
| FeIII | 6185.26 | 0.98: | ||||||
| DIB | 6194.73 | 0.98 | ||||||
| DIB | 6195.96 | 0.12 | 0.86 | 12 | 0.12 | 0.80 | 12 | |
| DIB | 6203.08 | 0.85 | 14 | 0.30: | 0.85 | 12 | ||
| DIB | 6211.66 | 0.03: | 0.97 | 14: | ||||
| DIB | 6212.90 | 0.02: | 0.98 | 9: | ||||
| DIB | 6215.79 | 0.99 | ||||||
| DIB | 6220.81 | 0.99 | 15: | |||||
| DIB | 6223.56 | 0.98 | 0.04 | 0.95 | ||||
| DIB | 6226.30 | 0.99 | ||||||
| DIB | 6234.03 | 0.95 | 14: | 0.05 | 0.95 | 12 | ||
| DIB | 6236.67 | 0.98 | ||||||
| FeII | (74) | 6238.39 | 0.99: | |||||
| FeII | (74) | 6247.55 | 0.99: | |||||
| DIB | 6250.82 | 0.98 | 12: | |||||
| NeI | (5) | 6266.50 | 0.04: | 0.97 | 14: | 0.05 | 0.97 | |
| DIB | 6269.75 | 0.27 | 0.86 | 13 | 0.28 | 0.85 | 11 | |
| DIB | 6283.85 | 0.59 | 14 | 0.61 | 10: | |||
| SII | (26) | 6312.66 | 0.98 | 16: | ||||
| FeII | 6317.99 | 0.98: | ||||||
| DIB | 6324.80 | 0.04: | 0.97: | |||||
| DIB | 6329.97 | 0.03 | 0.98 | 11: | ||||
| NeI | (1) | 6334.43 | 0.03 | 0.98: | 9: | 0.97: | 20: | |
| SiII | (2) | 6347.10 | 0.39 | 0.81 | 14 | 0.40 | 0.78 | 28 |
| DIB | 6353.34 | 0.05 | 0.98 | 15: | 0.04 | 0.97 | 15: | |
| DIB | 6362.30 | 0.05 | 0.98 | 15: | 0.06 | 0.97: | 12: | |
| DIB | 6367.25 | 0.04: | 0.97 | 13: | 0.04 | 0.95 | 8 | |
| SiII | (2) | 6371.36 | 0.28 | 0.87 | 14 | 0.33 | 0.84 | 30 |
| DIB | 6375.95 | 0.11: | 0.93 | 10 | 0.13 | 0.86: | 14 | |
| DIB | 6379.29 | 0.18 | 0.83 | 12 | 0.20 | 0.78 | 12 | |
| NeI | (3) | 6382.99 | 0.04 | 0.97 | 0.06: | 0.95 | 32: | |
| SII | (19) | 6384.89 | 0.99 | |||||
| DIB | 6397.39 | 0.08 | 0.96 | |||||
| DIB | 6400.30 | 0.98: | ||||||
| NeI | (1) | 6402.25 | 0.13 | 0.93 | 9 | |||
| DIB | 6410.18 | 0.04: | 0.98 | |||||
| SII | (19) | 6413.71 | 0.05: | 0.98 | ||||
| DIB | 6425.70 | 0.03: | 0.97 | 13 | ||||
| FeII | (40) | 6432.68 | 0.03: | 0.98: | ||||
| DIB | 6439.50 | 0.06 | 0.95 | 12 | 0.05 | 0.94 | 9 | |
| DIB | 6445.20 | 0.05 | 0.94 | 10 | 0.07 | 0.92 | 11 | |
| DIB | 6449.14 | 0.04 | 0.96: | 11: | 0.05 | 0.96 | 10: | |
| FeII | (74) | 6456.38 | 0.95: | 15: | ||||
| NII | (8) | 6482.05 | 0.95: | 13: | ||||
| NeI | (3) | 6506.53 | 0.97 | 10: | 0.93: | 26: | ||
| H | 6562.81 | 4.0: | 1.6 | 8 | 1.76 | 15 | ||
| CII | (2) | 6578.05 | 0.38: | 0.82 | 6 | 0.39 | 0.80: | 23: |
| CII | (2) | 6582.88 | 0.29: | 0.86 | 9 | |||
| DIB | 6597.31 | 0.96 | 10: | |||||
| NeI | (6) | 6598.95 | 0.98 | |||||
| NII | (31) | 6610.57 | 0.99: | |||||
| DIB | 6613.56 | 0.42 | 0.70 | 9 | 0.39 | 0.68 | 12 | |
| DIB | 6632.85 | 0.99: | ||||||
| OII | (4) | 6640.90 | 0.99: | |||||
| DIB | 6646.03 | 0.99: | ||||||
| DIB | 6660.64 | 0.06 | 0.93 | 11 | 0.07 | 0.92 | 10 | |
| DIB | 6665.15 | 0.98 | ||||||
| DIB | 6672.15 | 0.05 | 0.96 | 13 | ||||
| HeI | (46) | 6678.15 | 0.75 | 0.68 | 2 | |||
| DIB | 6689.30 | 0.03: | 0.99 | 13: | ||||
| DIB | 6694.48 | 0.02: | 0.99 | 17: | ||||
| DIB | 6699.26 | 0.07 | 0.95 | 11 | ||||
| DIB | 6701.98 | 0.02 | 0.98 | 15 | ||||
| DIB | 6709.39 | 0.02: | 0.98 | 6: | ||||
| DIB | 6729.28 | 0.02: | 0.98 | 11: | ||||
| DIB | 6737.13 | 0.02: | 0.99 | 13: | ||||
| DIB | 6740.99 | 0.03: | 0.98 | |||||
| DIB | 6767.74 | 0.01: | 0.99 | 17: | ||||
| DIB | 6770.05 | 0.03: | 0.98 | 9 | ||||
| DIB | 6788.66 | 0.02: | 0.99 | 7: | ||||
| DIB | 6792.52 | 0.03 | 0.98 | 12 | ||||
| DIB | 6795.24 | 0.03 | 0.98 | 6: | ||||
| DIB | 6801.37 | 0.02: | 0.98 | 9 | ||||
| DIB | 6810.5: | 0.98: | ||||||
| DIB | 6827.30 | 0.02: | 0.98 | 14 | ||||
| DIB | 6843.60 | 0.06 | 0.96 | 19 | ||||
| DIB | 6852.67 | 0.02 | 0.98 | |||||
| DIB | 6860.02 | 0.05 | 0.97 | 17 | ||||
| DIB | 6862.53 | 0.03: | 0.99 | |||||
| HeI | (10) | 7065.32 | 0.36: | 0.82 | 2: | |||
| DIB | 7357.60 | 0.91 | 14: | |||||
| NI | (3) | 7468.31 | 0.05 | 0.98 | 15: | |||
| DIB | 7494.89 | 0.98: | 9: | |||||
| FeII | 7495.63 | 1.01 | ||||||
| FeII | 7513.17 | 1.03 | 12 | |||||
| DIB | 7559.35 | 0.97 | 12 | |||||
| DIB | 7562.3: | 0.25: | 0.94 | 13: | ||||
| DIB | 7581.30 | 0.08: | 0.97 | 12: | ||||
| KI | (1) | 7664.91 | 0.70: | 0.4: | 9: | |||
| DIB | 7721.85 | 0.07 | 0.96 | 10 | ||||
| OI | (1) | 7771.94 | 1.231 | 0.76 | 3: | |||
| OI | (1) | 7774.2: | 0.75 | |||||
| DIB | 7832.81 | 0.05 | 0.97 | 10 | ||||
| 1 – the sum of of the OI–triplet lines at 7773 Å | ||||||||
| Lines | , km/s | |
|---|---|---|
| 12.06.01 | 12.04.03 | |
| Emissions | ||
| 10 | 15 | |
| FeII | 12: | |
| Photospheric absorptions | ||
| NII, OII, SII . | 16 | 25 |
| SiII (2) | 14 | 29 |
| CII (2) | 11 | 24: |
| HeI 5876 | 1 | 12 |
| 140:, 0: | 125:, 28 | |
| IS absorptions | ||
| NaI (1) | 11 | 34, 9, 20, |
| KI (1) | 10: | |
| DIB | 10 | 11 |