Distribution of dust clouds around the central engine of NGC 1068††thanks: Based on data collected at Subaru Telescope, which is operated by the National Astronomical Observatory of Japan.
Abstract
We studied the distribution of dust clouds around the central engine of NGC 1068 based on shifted-and-added 8.8 – 12.3 µm (MIR) multi-filter images and 3.0 – 3.9 µm (L-band) spectra obtained with the Subaru Telescope. In a region of 100 pc (14) around the central peak, we successfully constructed maps of color temperatures and emissivities of the MIR and L-band continua as well as the 9.7 µm and 3.4 µm dust features with spatial resolutions of 26 pc (037) in the MIR and 22 pc (03) in the L-band. Our main results are: 1) color temperature of the MIR continuum scatters around the thermal equilibrium temperature with the central engine as the heat source while that of the L-band continuum is higher and independent upon distance from the central engine; 2) the peak of the 9.7 µm silicate absorption feature is shifted to a longer wavelength at some locations; 3) the ratio of the optical depths of the dust features is different from the Galactic values and show complicated spatial distribution; and 4) there is a pie shaped warm dust cloud as an enhancement in the emissivity of the MIR continuum extending about 50 pc to the north from the central engine. We speculate that material falls into the central engine through this cloud.
1 INTRODUCTION
Physics around black holes, including accretion of material and launching of jets, has been a fundamental question in astronomy for a long time (e.g. Eardley & Press, 1975). It is not yet clearly known how accreting material disposes of its angular momentum while falling into a black hole, and how and where a jet is launched from around a black hole. With a jet of 100 pc scale observed (e.g. Gallimore et al., 1996), active galactic nuclei (AGNs) of Seyfert galaxies are the best targets to attack the mystery of accreting material and jets.
There are two classes of Seyfert galaxies; Seyfert 1 and Seyfert 2. They have similarities and differences in, for example, their visible spectra, which are commonly known to be explained with the unified model (Antonucci, 1993). According to the unified model, an AGN has a black hole at its heart. Material falls down into the black hole through an accretion disk while emitting X-ray and UV light. Throughout this paper, we define the system of the black hole and the accretion disk as “central engine” following Galliano et al. (2003). The unified model proposes three classes of clouds around the central engine. First, narrow line regions (NLRs) spread over 100 pc and emit permitted and forbidden lines with velocity widths of km sec-1. Second, broad line regions (BLRs) in the vicinity of the central engine emit permitted lines of km sec-1 velocity widths. Third, an opaque compact but geometrically thick dusty torus around the central engine hides the direct view to the central engine and their BLRs from our line of sight when the central engine is viewed through the torus. The dusty torus is the key to the unified model because it is the one which distinguishes Seyfert 1 and Seyfert 2: Seyfert 2 nuclei are viewed through the dusty torus and BLRs are only seen in scattered light.
NGC 1068 is one of the nearest Seyfert 2 galaxies. Many observations have revealed various features that confirm the unified model; an accretion disk of 1 pc scale (Gallimore et al., 1997, 2001), the Seyfert 1 nucleus seen in polarized light (Antonucci & Miller, 1985), and NLRs (Evans et al., 1991). However, no clear image of the dusty torus has been obtained (e.g. Bock et al., 2000; Tomono et al., 2001; Rouan et al., 2004). Only recently, Jaffe et al. (2004) found a 2.1 pc scale emission component of warm (320 K) dust surrounding a more compact hot ( K) dust component with the Mid-Infrared Interferometric Instrument coupled to the Very Large Telescope Interferometer. They identified the hot component as the inner wall of the dusty torus. It is a step towards clear images of the dusty torus including its temperature structure, density distribution, and relations with structures in larger and smaller scales.
On the other hand, the inner radii of the dusty tori are being measured with reverberation mapping. This method measures lag time of light curves of an AGN in the V-band and that in the K-band. In reverberation mapping, the measured lag time is interpreted as the time duration in which light from the AGN reaches the inner wall of the dusty torus. Multiplying the lag with the speed of light, the inner radius of the dusty torus can be obtained. Minezaki et al. (2004) found a good correlation between lags and absolute magnitudes in the V-band in a number of Seyfert 1 galaxies. It implies that is governed by luminosity of the central engine. Adopting their results, minimum for NGC 1068 is estimated to be 0.045 pc from 11.5 mag (Sandage, 1973). The estimated radius is consistent with the upper limit of 1 pc measured by Jaffe et al. (2004). The method seems to be promising in unveiling the innermost structures of dusty clouds around AGNs. However, we have to note that the results do not necessarily require the dusty clouds around the AGNs to be in the shape of a torus. It is still critical to obtain direct images of dusty tori.
It is best to look for a dusty torus in the infrared (IR). First, from thermal equilibrium, it is expected that dust in a torus of 10 pc scale radiates mainly around 10 µm (Pier & Krolik, 1992). Next, there are absorption/emission features of carbonaceous dust at 3.4 µm and of silicate dust at 9.7 µm. Comparison of the dust features may be used to probe the temperature structure of a dusty torus as has been suggested by Imanishi (2000). Because L-band emission is dominated by dust at K, the 3.4 µm absorption feature should originate from the dust clouds in a few pc from the central engine (Pier & Krolik, 1992). On the other hand, the 9.7 µm absorption feature only measures the extinction towards the outer region of the dusty torus because dust of K, which is the dominant source of the mid-infrared (MIR) emission, is located further out from the heating source. Therefore, the combination of MIR spectra (8 – 13 µm) and L-band spectra (2.8 – 4.2 µm) would probe the temperature distribution of dust in the line of sight through the dusty torus.
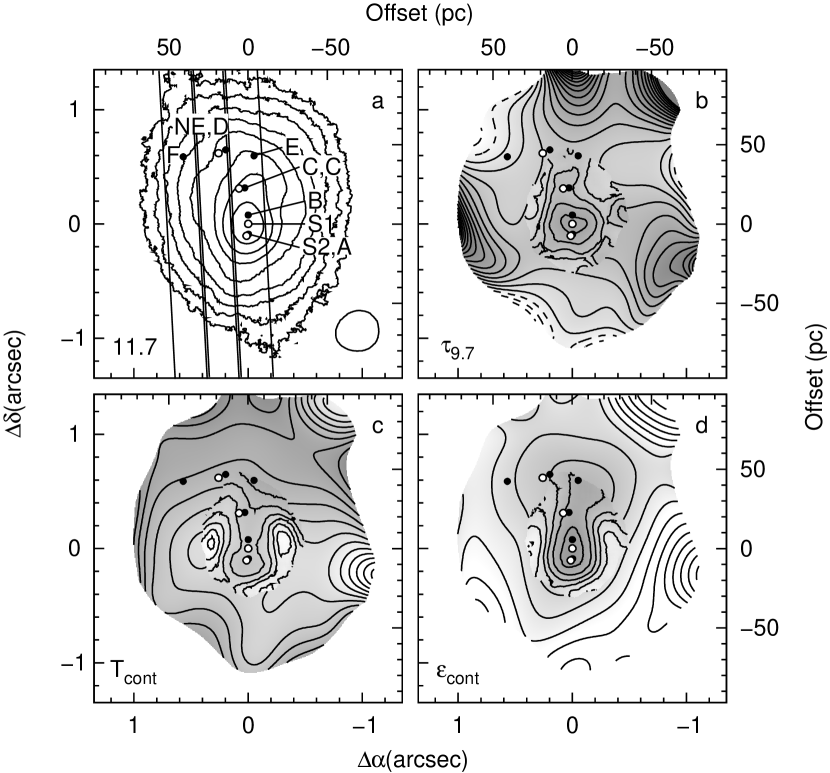
This paper reports the results from observations of NGC 1068 in the MIR and in the L-band with the Subaru Telescope, which is best suited for this study with the superb image quality in IR. Two instruments, the Mid-Infrared Test Observation System (MIRTOS) and the Infrared Camera and Spectrograph (IRCS), were used with the fine pixel scales optimized for the image quality of the telescope. The remainder of this paper is organized as follows: Sections 2 and 3 describe observations and data reduction in the MIR and in the L-band, respectively; Section 4 discusses emission mechanisms of the continua, spectral and spatial change of the dust features, and distributions of warm dust clouds; and § 5 summarizes the results. Throughout this paper, we assume the redshift of for NGC 1068 (Bottinelli et al., 1990). One arcsecond corresponds to 72 pc at the distance of NGC 1068, assuming the Hubble constant of km sec-1 Mpc-1. Galliano et al. (2003) measured positions of the various spatial structures in the NGC 1068 nucleus observed at different wavelengths and found that the central engine is at the IR peak. We employ their registration to compare the results in the MIR and in the L-band as well as those in the literature.
2 MIR DATA
2.1 Observations
MIR imaging observations of NGC 1068 with the “silicate filters” () at 7.7, 8.8, 9.7, 10.4, 11.7, and 12.3 µm were made on 1999 December 31, 2000 January 9, and 2000 January 18 UT. We used the MIRTOS (Tomono, 2000; Tomono et al., 2000) mounted at the Cassegrain focus of the 8.2-m Subaru Telescope. Pixel scale was 0067, corresponding to a projected distance on the sky of 4.8 pc at the distance of NGC 1068. Sequences of 96 images of 31 msec integration were obtained. Between the sequences, the telescope was nodded typically 30′ to the north to acquire background images. In this study, the data described in Tomono et al. (2001) were reduced again with the higher computing power available today.
2.2 Shift-and-add and registration of images
Many short-exposure images with 31 msec integration time were shifted-and-added to construct high-resolution images in each filter. First, background images, which were made with averaging the short-exposure images in the nodding pair, were subtracted from the raw images. Second, bad pixels and detector array specific features were corrected. Third, the peak position of the object in each image was measured with a precision of one tenth of a pixel with Gaussian fitting. The FWHM of the Gaussian was fixed to be the same as that of the Airy pattern to pick up the brightest speckle. Fourth, each pixel of the images was divided to 10 times 10 pixels resulting with a pixel scale of 00067. Fifth, each image of the smaller pixel scale was shifted by registering the peak position measured in the third step. Finally, the shifted images were averaged after some images with low peak values were removed. Table 1 summarizes total integration time of the short-exposure images used and the ratio of the images used to those acquired.
| Wavelength | Total integration time of images used | Percentage of images used |
|---|---|---|
| µm | sec | % |
| 7.7 | 2.7 | 23 |
| 8.8 | 5.2 | 43 |
| 9.7 | 4.9 | 41 |
| 10.4 | 24.9 | 42 |
| 11.7 | 53.7 | 53 |
| 12.3 | 68.2 | 47 |
The flux was calibrated with the standard star Ari (Cohen et al., 1999). Flux uncertainty was estimated at about 9% from the measurement of the other standard star CMa (Cohen et al., 1995).
The shifted-and-added image of each filter was registered and convolved to have the same FWHM of 037 (26 pc) as follows. The peak position of the object for each filter was measured by Gaussian fitting of the pixels with flux more than 75% of the peak. The images were registered assuming that the peaks for each filters are at the same location on the sky (Galliano et al., 2003). The images are then Gaussian convolved so that all the images have a similar FWHM. Figure 1 shows the spatially integrated SED within a 38 diameter aperture on the registered narrow-band images. The ISO-SWS spectrum in the 14″ 27″ aperture (Lutz et al., 2000; Sturm et al., 2000) is also shown for comparison. The flux density measured from the MIRTOS images are consistent with the flux density of the continuum in the SWS spectrum.

2.3 Grey body fitting
We fitted the MIR spectral energy distribution (SED) with a grey body emission model including the silicate feature to estimate the temperature and amount of MIR emitting dust, as well as optical depth of the silicate absorption/emission feature. It should be noted that the extracted parameters do not represent the entire physical conditions but only characterize distributions of dust in some aspects as described below. The observed SED was fitted with a model flux
| (1) |
where is the Planck function of temperature and is the optical depth of the silicate feature obtained from the IR excess towards Cep (Roche & Aitken, 1984) and normalized at 9.7 µm.
The Cep extinction curve is used in this work to compare the silicate feature with the 3.4 µm feature as has been done by Roche & Aitken (1984). The 7.7 µm image was not used because the IR excess data does not cover the short wavelength. The peak wavelength of the silicate absorption feature seen in the SEDs in Figure 1 is different from that observed towards Cep: the peak wavelength of the absorption is shifted from 9.7 µm to 10.4 µm especially at the central peak. Because of this, the 10.4 µm image was not used in the SED fitting. See § 4.2 for a discussion on the change of the peak wavelength.
The variables , , and were treated as free parameters for the fitting. Color temperature represents the temperature of warm dust grains emitting the MIR continuum (see § 4.1.1 for a discussion). The factor is a product of dust emissivity at 10 µm and beam filling factor of warm dust grains of . Throughout this paper, we call as “emissivity”. The mass of the warm dust grains per unit area can be estimated as , where is the absorption cross section per unit mass of dust grains. The dust model (Weingartner & Draine, 2001; Draine, 2003) with tabulates the absorption cross section at 10 µm as . Although the dust cloud might be clumpy, clumpiness does not affect the mass estimation when and a homogeneous temperature is assumed of warm dust that is emitting continuum. The other free parameter, , is the optical depth of the silicate feature at 9.7 µm towards the warm dust that is emitting continuum. A negative optical depth in our model represents emission of the silicate feature. Although the spectral index of dust emissivity is usually uncertain ranging from 1 to 2, we assumed following Cameron et al. (1993). Figure 2 shows spatial distributions of the parameters fitted on each pixel. The images were successfully fitted over a region of 50 pc to the north and 40 pc to the south from the central peak: uncertainty in fitted parameters are , , and . Using the secondary reference star CMa rather than Ari, resulting Tcont is within 1.5 K, becomes about 0.1 deeper, and becomes 10% stronger. To improve the signal-to-noise ratio of the parameters in the area surrounding the central peak, the data were also fitted after being convolved to have 1.4 times wider FWHM.
Maiolino et al. (2001) pointed out that ground based measurements of the silicate absorption feature at 9.7 µm might suffer from contamination in continuum with the unidentified infrared band (UIB) emission at 7.7 µm. However, Sturm et al. (2000) detected little emission of 7.7 µm UIB towards NGC 1068 with ISO-SWS in the 14″ 27″ aperture. The 3.3 µm UIB feature is not seen in the spectrum obtained towards NGC 1068 by Imanishi et al. (1997) with the 38 aperture nor in the L-band spectra in this work. In fact, the UIBs detected with ISOCAM (Le Floc’h et al., 2001) originate almost exclusively from the starburst regions, peaking at a distance of 1 kpc (14″) from the central engine. They indicated that the AGN contributes less than 5% to the total integrated UIB emission. Therefore, we concluded that the contamination by the UIBs to the continuum is negligible in our field of view of of 200 pc (27) around the central engine of NGC 1068.
High temperature areas seen 034 from the central engine on east and west sides coincide with the second and third diffraction rings (029 and 041 radius) of the Airy pattern at 8.8 µm. Between these diffraction rings, there are also diffraction rings at longer wavelengths which might affect the fitting. Nevertheless, a fitting on convolved Airy images does not reproduce a peak in fitted temperature. Therefore, we concluded that the high temperature region is not an artifact induced by the Airy rings.
Flux was also spatially integrated over the area of each L-band slitlet (see § 3.2) and the integrated flux is fitted with the same model as described in eq. [1]. With comparable spatial resolutions achieved for the MIR shifted-and-added images and the L-band seeing limited spectra, no further convolution or deconvolution was performed. Results are shown in Figure 1.
3 L-BAND DATA
3.1 Observation
A seeing limited spectroscopic observation of NGC 1068 in the L-band was conducted on 2000 September 24 UT. We used the IRCS (Tokunaga et al., 1998; Kobayashi et al., 2000) mounted at the Cassegrain focus of the Subaru Telescope. The L-band grism for 2.8 – 4.2 µm was used with the 03 slit, yielding the spectral resolution 400. The length of the slit was 18″. Pixel scale was 0058 pixel-1. NGC 1068 was observed with the slit position angle (P.A.) of 3° from the north, with slit positioned at three positions to map the eastern area of the central peak: pointing offsets of 6″ along the slit and 028 and 056 to the east were applied. Positions of the slits are illustrated in Figure 2a. We call the slit at the central peak as “C”, and the slits in the east as “0.28E” and “0.56E” according to the offsets to the east in arcseconds. Eight exposures of 2 seconds on-source integration time were obtained for each slit position. The sky condition was photometric throughout the observation. Airmass to the target was . From the size of the image along the slit, spatial resolution was estimated to be 031 or 22 pc in FWHM. As a telluric standard, a spectrum of BS 813 was obtained at the similar airmass (1.08). We selected a F-type star as a telluric standard because it is known that no strong stellar absorption lines are present in L-band for F-type stars. For flat fielding, spectra of dawn sky were obtained at the end of the night.
3.2 Data Reduction
The L-band data were reduced following the standard procedure: the 2-dimensional spectrograms were background subtracted by the dithering pairs, flat fielded, and corrected for bad pixels using IRAF111 IRAF is distributed by the National Optical Astronomy Observatories, which are operated by the Association of Universities for Research in Astronomy, Inc., under cooperative agreement with the National Science Foundation. . Subsequently, positional shifts of the spectrograms of each slit position were measured with cross correlations and confirmed to be not more than 0.2 pixels (001 or 3.2 Å) in both the spatial and dispersion directions. The spectrograms were shifted in the dispersion direction on the 2-dimensional spectrograms to cancel wavelength shifts between the slit positions. Flux of the spectrograms were then calibrated with the spectrum of the standard star BS 813, which was assumed to have an effective temperature of 7244 K (Johnson & Wright, 1983). Wavelengths of the spectra were calibrated using cross-correlation with a model atmospheric transmittance (Rothman et al., 1998). Then, the spectra in slitlets of 015 along the slit were extracted to examine spatial variations. Finally, the spectra were convolved with a Gaussian with the FWHM of 8.2Å in the dispersion direction to match the spectral resolution to that of the instrument and improve the signal-to-noise ratio.
Figure 3 shows spectra of some slitlets in the slit C. It should be noted that the slopes of the continuum at 3.0 µm and 3.9 µm are sensitive to the atmospheric conditions during the observation. In the following analysis, we did not use the data in these wavelength ranges to avoid the uncertainty of the continuum slope. The periodic feature at 3.46 – 3.56 µm in the spectrum of the central peak in Figure 3 is from the periodic telluric absorption in this wavelength range. Because the instrumental line profile changes upon spatial distribution of the illumination within the slit, the difference of the instrumental line profiles of the target and the standard star causes the residual features when the two spectra are divided each other (see the detailed discussion in Goto, 2003).

3.3 The 3.4 µm absorption feature and the L-band continuum
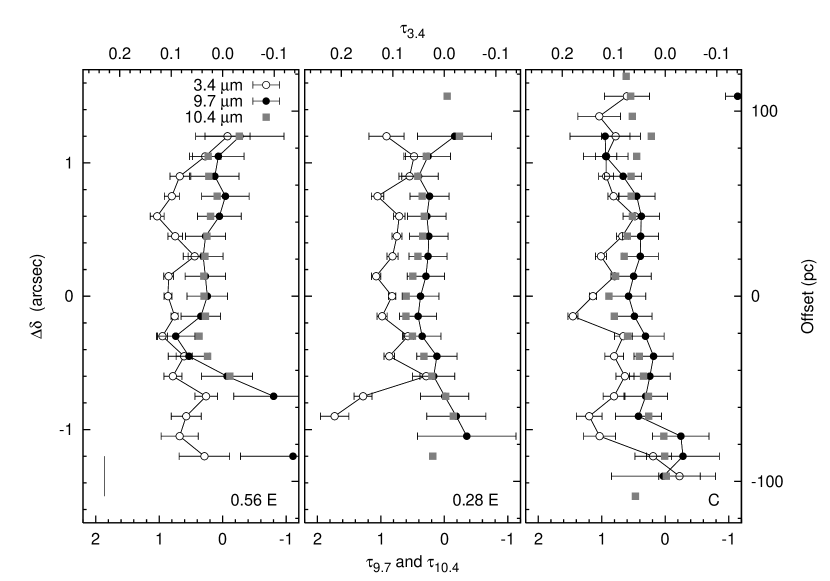
The absorption feature around 3.4 µm by carbonaceous dust is clearly seen in the spectra in Figure 3. Following Sandford et al. (1991), optical depth of the dust feature was measured as follows: 1) the continuum level at the absorption feature was estimated by connecting the continuum levels at rest wavelengths 3.23 and 3.64 µm with straight line and 2) was derived by averaging the optical depths at two sub peaks of the dust feature at rest wavelengths 3.38 µm (2955 cm-1) and 3.42 µm (2925 cm-1). The 3.48 µm (2870 cm-1) sub peak was not included in the measurements because of the residual telluric feature described in § 3.2. Figure 4 shows spatial change of along with and .
Color temperature and emissivity in the L-band were estimated by fitting a grey body model
| (2) |
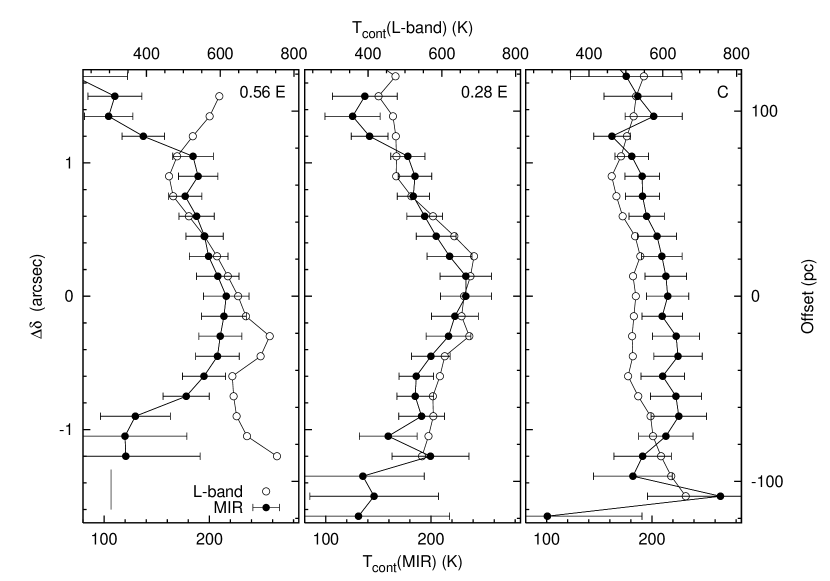
to the spectra at 3.00 – 3.23 µm and 3.64 – 3.90 µm. These wavelength ranges were chosen to avoid the 3.4 µm dust feature and the unstable continuum level at the both ends of the wavelength range due to changes of the atmospheric conditions. We assumed a dust emissivity index of for comparison of the parameters with those in the MIR (§ 2.3). Spatial change of the color temperature in the L-band along with those in MIR are shown in Figures 5.
4 RESULTS AND DISCUSSION
4.1 Emission mechanisms of MIR and L-band continua
Continua are detected both in the MIR and in the L-band over a region of 100 pc to the north and to the south from the central engine. Because Gratadour et al. (2003) detected no evidence of stellar activity in the vicinity of the central engine in their K-band spectra, stellar activity should be negligible as a source of the extended IR continua. In the following, we will show that the MIR continuum is emitted from dust in thermal equilibrium with the UV radiation from the central engine while the continuum in the L-band is emitted by Very Small Grains (VSGs).
4.1.1 MIR continuum emission
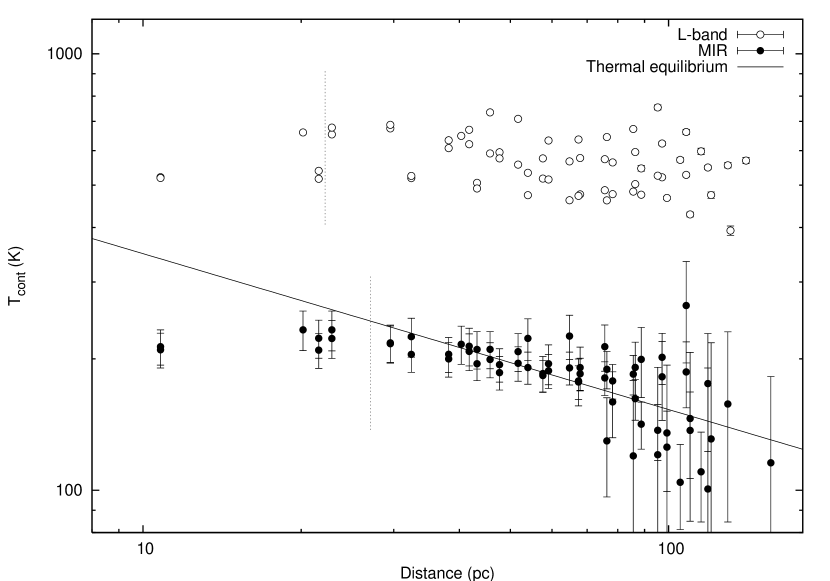
Assuming a dust emissivity index 1.6, Cameron et al. (1993) estimated dust temperature in thermal equilibrium with a UV radiation field as
| (3) |
where is the luminosity of the UV source and is the linear distance from the heating source. Figure 6 shows color temperature measured in the MIR and the estimated temperature for (Telesco & Harper, 1980, at luminosity distance of 15 Mpc) as a function of the distance from the central engine. The distance is assumed to be the same as the projected distance on the sky. The vertical dotted lines in the Figure show spatial resolutions of data in the MIR and in the L-band, which are different because of different wavelengths and observation conditions. Because the light from the central engine, of which color temperature might be different from that for the extended continua, might contaminate the continua, the color temperatures measured around the central engine within the spatial resolutions are not accurate.
In Figure 6, the measured in the MIR scatters around the estimated equilibrium temperature. This implies that, as a whole, the MIR emitting dust is mainly heated by the central engine and is in thermal equilibrium as has been suggested by Galliano et al. (2005).
4.1.2 L-band continuum emission
We interpret that the extended L-band continuum is emitted by VSGs among the following three possibilities. First, the continuum is not dominated by the scattered light of the continuum from the central engine. Packham et al. (1997) measured spatially resolved polarization degrees in the J, H, and K-bands around the central engine and found that they are not more than than 5%. Second, the L-band continuum is not emitted from dust in thermal equilibrium. As shown in Figure 6, color temperature of the L-band continuum is higher than expected for dust in thermal equilibrium. Third, color temperature in the L-band remains roughly constant as far as 100 pc from the central engine; suggesting that hot grains emitting L-band continuum exist in this area even if their column density is not as high as those emitting MIR continuum. As Rouan et al. (2004) and Gratadour et al. (2005) suggested, the uniformity of the color temperature can be explained as emission from VSGs, which emit continuum with color temperature higher than their equilibrium temperature due to thermal fluctuation upon absorption of UV photons (Sellgren, 1984; Sellgren et al., 1985).
If the continuum is emitted by VSGs, the incident UV photon flux does not determine color temperature but determines brightness, or emissivity in our grey body model, of the continuum. We actually found the change of emissivity of the L-band continuum upon incident UV photon flux from our grey body fittings, suggesting that the L-band continuum is indeed emitted by VSGs. Figure 7 shows correlation between and . Thermal equilibrium temperature should correlate with the UV photon flux. On the other hand, since is proportional to column density of dust grains emitting the continuum, gives the ratio of dust grains excited to be VSGs to those in thermal equilibrium emitting continuum in the MIR. In more detail, energy of UV photons absorbed by dust grains is balanced with the grey body emission with temperature as follows:
| (4) |
where is the emissivity of the dust cloud at 10 µm. Division of two equations for the L-band and MIR continua leads to the following equation:
| (5) |
The solid line in Figure 7 shows the fitting result when assuming and adjusting the factor as a free parameter. Relation between the measured and the measured in Figure 7 roughly matches with the assumption in the range of almost two orders of . The fitted factor (651 K) and the observed K leads to , suggesting that VSGs absorb almost half of the UV energy that is absorbed by dust grains in thermal equilibrium. The uniformity of the ratio suggests that dust in thermal equilibrium and VSGs are mixed well around the central engine.

4.2 Spectral profile change of the silicate absorption feature
At 10.4 µm, the silicate absorption towards the central engine is deeper than expected from the standard silicate feature. Figure 1 compares the observed SEDs with expected spectra from the IR excess towards Cep (Roche & Aitken, 1984). There are a number of similar wavelength shift of the silicate feature in the literature. The interferometric spectrum by Jaffe et al. (2004) also shows a shift of the peak of the absorption feature towards longer wavelength. Silicate emission feature detected towards a type 1 AGN (Sturm et al., 2005) and quasars (Siebenmorgen et al., 2005) is shifted to a longer wavelength.
The spatially integrated SED in Figure 1 is consistent with the spectrum observed through the 14″20″ aperture of the ISO-SWS (Sturm et al., 2000) which shows the normal spectral profile of the silicate absorption feature. This suggests that the spectral profile is normal as a whole and there is a spatial change of the profile.
To measure the optical depth of the feature without being affected by the change, we fitted the MIR SED with a gray body emission model without using the 10.4 µm image (§2.3). If the 10.4 µm image were included in the grey body fitting, the resulting would have been higher than expected from the literature (Roche et al., 1984; Tomono et al., 2001), especially near the central engine where would have to be significantly adjusted for the low flux at 10.4 µm.
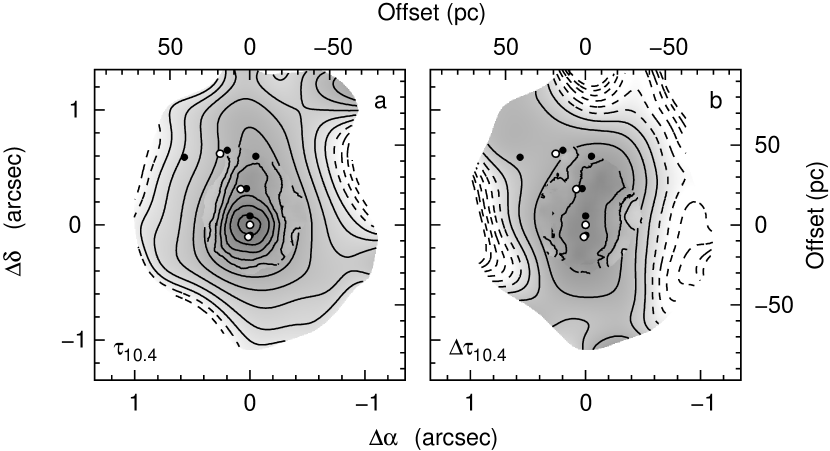
Figure 8a shows spatial distribution of optical depth in the 10.4 µm filter . It is measured with comparing the 10.4 µm image with the model continuum surface brightness fitted from the other images. The shape of the 10.4 µm absorption area is different from the 9.7 µm absorption area (Figure 2b). To illustrate the difference, we compared the measured with that expected from the measured and the IR excess towards Cep (Roche & Aitken, 1984). Figure 8b shows the excess optical depth at 10.4 µm () near the central engine and to the north north east.
The change of the spectral profile might be due to change of dust properties as suggested by Siebenmorgen et al. (2005) and Sturm et al. (2005) for type 1 AGNs and quasars. The area with large in Figure 8b coincides with the pie shaped high emissivity area (§ 4.4) seen in Figure 2d. This suggests that the spectral profile change of the silicate absorption feature occurs in dense regions.
4.3 Spatial variation of 9.7 µm and 3.4 µm absorption features
It is known that optical depth of the absorption feature of silicate dust and that of carbonaceous dust are proportional towards Galactic sources. Roche & Aitken (1984) showed that towards Wolf-Rayet stars and B supergiants in our Galaxy. Pendleton et al. (1994) measured optical depths of the carbonaceous dust and concluded that is for sources in the Galactic center or for sources in the local interstellar matter (ISM). From these results, ratio of the optical depths of the absorption features is 8.1 for the sources in the Galactic center or 13.5 for the local ISM. Towards AGNs, is expected to be smaller because of temperature gradient in the dusty torus in the line of sight (Imanishi, 2000). In fact, they measured towards NGC 1068 in the 38 aperture, compared it with measured in the 47 aperture by Roche et al. (1984), and yielded . With the data with higher spatial resolution, spatial variation of the ratio might show a trace of the dusty torus.
Our results show significant spatial variation of the ratio (Figure 9), with a complexity not expected to be produced by a dusty torus. As shown in Figure 1, the 9.7 µm silicate feature is shifted towards longer wavelengths at some locations: optical depth of the feature is deeper at 10.4 µm than at 9.7 µm (§ 4.2). To minimize influence from the wavelength shift, we defined as either or whichever has the higher absolute value. At the central peak, the ratio from our observation is between that measured by Imanishi (2000) and the Galactic values. In the slit C, the ratio increases from the central peak towards the north and approaches the Galactic values. In the eastern slits, the ratio is flatter and closer to that measured by Imanishi (2000). In the south, the ratio is smaller. Figure 4 shows that the silicate feature is observed as emission in the south.
The emission of the silicate feature in the south of the central peak implies a temperature gradient in the line of sight: e.g., an optically thin layer of warm dust is present in front of cooler continuum source. On the other hand, in the north, the change of the ratio may be explained either with a temperature gradient in the line of sight: warmer dust clouds are located behind cooler dust clouds, or with differences in dust composition. Spatially resolved MIR spectra are needed to disentangle the possibilities.

4.4 Pie shaped warm dust cloud
With the spatial resolution of 26 pc on the sky, the plausible dusty torus is not detected. Instead, we found a pie shaped area of high MIR emissivity in the north up to about 50 pc from the central engine (Figure 2d). The pie shaped area is in the west of the radio jet. There is no other hint of a channel supplying material to the central engine in the IR images in the literature and in this study. Therefore, we speculate that the area might be a channel that supplies material to the central engine.
The lifetime of this cloud can be estimated assuming that material falls down into the central engine through the cloud. The dust mass of the cloud is estimated at around M☉ integrating over the cloud where and dividing with (§ 2.3). Assuming the dust-to-gas ratio of 100 (Contini & Contini, 2003), total mass of the cloud is M☉. Mass accretion rate to the central engine is estimated at 0.05 M☉ year-1 from total luminosity (Telesco & Harper, 1980, at luminosity distance of 15 Mpc) and a typical value of mass-to-luminosity conversion efficiency of a black hole (Eardley & Press, 1975). The estimated total mass and accretion rate yields a lifetime of the cloud to be on the order of 109 years.
5 CONCLUSION
We observed an area of 28 (200 pc) around the central peak of NGC 1068 in the MIR (8.8 – 12.3 µm) and in the L-band (3.0 – 3.9 µm). The shifted-and-added MIR images have a spatial resolution of 037 or a projected distance of 26 pc while the L-band spectra are taken with a seeing limited spatial resolution of 03 or 22 pc. From these data, we derived grey body parameters: color temperatures of the continua and emissivities, which are proportional to column densities of dust emitting the continua, at each spatial element. Moreover, optical depths of spectral features of silicate around 9.7 µm and carbonaceous dust around 3.4 µm were also derived (§§ 2.3, 3.3).
The extended continua over 100 pc to the north and to the south of the central source are detected both in the MIR and in the L-band. We found that the MIR continuum is mainly emitted from dust in thermal equilibrium with radiation from the central engine while the L-band continuum is emitted by VSGs (§ 4.1). The observed SED in the MIR suggests that the peak wavelength of the 9.7 µm silicate absorption feature is shifted to a longer wavelength at some locations (§ 4.2). The ratio of the optical depths of the silicate and carbonaceous dust features show complicated spatial distribution (§ 4.3). There is a pie shaped area of enhanced MIR emissivity extending about 50 pc to the north from the central engine. The morphology of the cloud leads us to speculate that the area is a channel that feeds material into the central engine (§ 4.4).
References
- Antonucci (1993) Antonucci, R. 1993, ARA&A, 31, 473
- Antonucci & Miller (1985) Antonucci, R. R. J., & Miller, J. S. 1985, ApJ, 297, 621
- Bock et al. (2000) Bock, J. J., Neugebauer, G., Matthews, K., Soifer, B. T., Becklin, E. E., Ressler, M., Marsh, K., Werner, M. W., Egami, E., & Blandford, R. 2000, AJ, 120, 2904
- Bottinelli et al. (1990) Bottinelli, L., Gouguenheim, L., Fouque, P., & Paturel, G. 1990, A&AS, 82, 391
- Cameron et al. (1993) Cameron, M., Storey, J. W. V., Rotaciuc, V., Genzel, R., Verstraete, L., Drapatz, S., Siebenmorgen, R., & Lee, T. J. 1993, ApJ, 419, 136
- Cohen et al. (1999) Cohen, M., Walker, R. G., Carter, B., Hammersley, P., Kidger, M., & Noguchi, K. 1999, AJ, 117, 1864
- Cohen et al. (1995) Cohen, M., Witteborn, F. C., Walker, R. G., Bregman, J. D., & Wooden, D. H. 1995, AJ, 110, 275
- Contini & Contini (2003) Contini, M., & Contini, T. 2003, MNRAS, 342, 299
- Draine (2003) Draine, B. T. 2003, ARA&A, 41, 241
- Eardley & Press (1975) Eardley, D. M., & Press, W. H. 1975, ARA&A, 13, 381
- Evans et al. (1991) Evans, I. N., Ford, H. C., Kinney, A. L., Antonucci, R. R. J., Armus, L., & Caganoff, S. 1991, ApJ, 369, L27
- Galliano et al. (2003) Galliano, E., Alloin, D., Granato, G. L., & Villar-Martín, M. 2003, A&A, 412, 615
- Galliano et al. (2005) Galliano, E., Pantin, E., Alloin, D., & Lagage, P. O. 2005, MNRAS, 363, L1
- Gallimore et al. (1996) Gallimore, J. F., Baum, S. A., & O’Dea, C. P. 1996, ApJ, 464, 198
- Gallimore et al. (1997) —. 1997, Nature, 388, 852
- Gallimore et al. (2001) Gallimore, J. F., Henkel, C., Baum, S. A., Glass, I. S., Claussen, M. J., Prieto, M. A., & Von Kap-herr, A. 2001, ApJ, 556, 694
- Goto (2003) Goto, M. 2003, in Proceedings of the ESO Workshop on Science with Adaptive Optics held in Garching, Germany, 16-19 September 2003, ed. W. Brandner & M. Kasper, ESO Astrophysics Symposia, ESO (Springer-Verlag), in press
- Gratadour et al. (2003) Gratadour, D., Clénet, Y., Rouan, D., Lai, O., & Forveille, T. 2003, A&A, 411, 335
- Gratadour et al. (2005) Gratadour, D., Rouan, D., Boccaletti, A., Riaud, P., & Clénet, Y. 2005, A&A, 429, 433
- Imanishi (2000) Imanishi, M. 2000, MNRAS, 319, 331
- Imanishi et al. (1997) Imanishi, M., Terada, H., Sugiyama, K., Motohara, K., Goto, M., & Maihara, T. 1997, PASJ, 49, 69
- Jaffe et al. (2004) Jaffe, W., Meisenheimer, K., Röttgering, H. J. A., Leinert, C., Richichi, A., Chesneau, O., Fraix-Burnet, D., Glazenborg-Kluttig, A., Granato, G.-L., Graser, U., Heijligers, B., Köhler, R., Malbet, F., Miley, G. K., Paresce, F., Pel, J.-W., Perrin, G., Przygodda, F., Schoeller, M., Sol, H., Waters, L. B. F. M., Weigelt, G., Woillez, J., & de Zeeuw, P. T. 2004, Nature, 429, 47
- Johnson & Wright (1983) Johnson, H. M., & Wright, C. D. 1983, ApJS, 53, 643
- Kobayashi et al. (2000) Kobayashi, N., Tokunaga, A. T., Terada, H., Goto, M., Weber, M., Potter, R., Onaka, P. M., Ching, G. K., Young, T. T., Fletcher, K., Neil, D., Robertson, L., Cook, D., Imanishi, M., & Warren, D. W. 2000, in Proc. SPIE Vol. 4008, p. 1056–1066, Optical and IR Telescope Instrumentation and Detectors, Masanori Iye; Alan F. Moorwood; Eds., Vol. 4008, 1056–1066
- Le Floc’h et al. (2001) Le Floc’h, E., Mirabel, I. F., Laurent, O., Charmandaris, V., Gallais, P., Sauvage, M., Vigroux, L., & Cesarsky, C. 2001, A&A, 367, 487
- Lutz et al. (2000) Lutz, D., Sturm, E., Genzel, R., Moorwood, A. F. M., Alexander, T., Netzer, H., & Sternberg, A. 2000, ApJ, 536, 697
- Maiolino et al. (2001) Maiolino, R., Marconi, A., Salvati, M., Risaliti, G., Severgnini, P., Oliva, E., La Franca, F., & Vanzi, L. 2001, A&A, 365, 28
- Minezaki et al. (2004) Minezaki, T., Yoshii, Y., Kobayashi, Y., Enya, K., Suganuma, M., Tomita, H., Aoki, T., & Peterson, B. A. 2004, ApJ, 600, L35
- Packham et al. (1997) Packham, C., Young, S., Hough, J. H., Axon, D. J., & Bailey, J. A. 1997, MNRAS, 288, 375
- Pendleton et al. (1994) Pendleton, Y. J., Sandford, S. A., Allamandola, L. J., Tielens, A. G. G. M., & Sellgren, K. 1994, ApJ, 437, 683
- Pier & Krolik (1992) Pier, E. A., & Krolik, J. H. 1992, ApJ, 401, 99
- Roche & Aitken (1984) Roche, P. F., & Aitken, D. K. 1984, MNRAS, 208, 481
- Roche et al. (1984) Roche, P. F., Whitmore, B., Aitken, D. K., & Phillips, M. M. 1984, MNRAS, 207, 35
- Rothman et al. (1998) Rothman, L. S., Rinsland, C. P., Goldman, A., Massie, S. T., Edwards, D. P., Flaud, J.-M., Perrin, A., Camy-Peyret, C., Dana, V., Mandin, J.-Y., Schroeder, J., McCann, A., Gamache, R. R., Wattson, R. B., Yoshino, K., Chance, K. V., Jucks, K. W., Brown, L. R., Nemtchinov, V., & Varanasi, P. 1998, J. Quant. Spec. Radiat. Transf., 60, 665
- Rouan et al. (2004) Rouan, D., Lacombe, F., Gendron, E., Gratadour, D., Clénet, Y., Lagrange, A.-M., Mouillet, D., Boisson, C., Rousset, G., Fusco, T., Mugnier, L., Séchaud, M., Thatte, N., Genzel, R., Gigan, P., Arsenault, R., & Kern, P. 2004, A&A, 417, L1
- Sandage (1973) Sandage, A. 1973, ApJ, 183, 711
- Sandford et al. (1991) Sandford, S. A., Allamandola, L. J., Tielens, A. G. G. M., Sellgren, K., Tapia, M., & Pendleton, Y. 1991, ApJ, 371, 607
- Sellgren (1984) Sellgren, K. 1984, ApJ, 277, 623
- Sellgren et al. (1985) Sellgren, K., Allamandola, L. J., Bregman, J. D., Werner, M. W., & Wooden, D. H. 1985, ApJ, 299, 416
- Siebenmorgen et al. (2005) Siebenmorgen, R., Haas, M., Krügel, E., & Schulz, B. 2005, A&A, 436, L5
- Sturm et al. (2000) Sturm, E., Lutz, D., Tran, D., Feuchtgruber, H., Genzel, R., Kunze, D., Moorwood, A. F. M., & Thornley, M. D. 2000, A&A, 358, 481
- Sturm et al. (2005) Sturm, E., Schweitzer, M., Lutz, D., Contursi, A., Genzel, R., Lehnert, M. D., Tacconi, L. J., Veilleux, S., Rupke, D. S., Kim, D.-C., Sternberg, A., Maoz, D., Lord, S., Mazzarella, J., & Sanders, D. B. 2005, ApJ, 629, L21
- Telesco & Harper (1980) Telesco, C. M., & Harper, D. A. 1980, ApJ, 235, 392
- Tokunaga et al. (1998) Tokunaga, A. T., Kobayashi, N., Bell, J., Ching, G. K., Hodapp, K., Hora, J. L., Neill, D., Onaka, P. M., Rayner, J. T., Robertson, L., Warren, D. W., Weber, M., & Young, T. T. 1998, in Proc. SPIE Vol. 3354, p. 512-524, Infrared Astronomical Instrumentation, Albert M. Fowler; Ed., 512–524
- Tomono (2000) Tomono, D. 2000, PhD thesis, Univ. Tokyo
- Tomono et al. (2000) Tomono, D., Doi, Y., & Nishimura, T. 2000, in Proc. SPIE Vol. 4008, p. 853-860, Optical and IR Telescope Instrumentation and Detectors, Masanori Iye; Alan F. Moorwood; Eds., 853–860
- Tomono et al. (2001) Tomono, D., Doi, Y., Usuda, T., & Nishimura, T. 2001, ApJ, 557, 637
- Weingartner & Draine (2001) Weingartner, J. C., & Draine, B. T. 2001, ApJ, 548, 296