Dissecting Galaxy Colors with GALEX, SDSS, and Spitzer
Abstract
We combine data from SDSS and the GALEX and Spitzer observatories to create a sample of galaxies observed homogeneously from the UV to the Far-IR. This sample, consisting of 460 galaxies observed spectroscopically by SDSS provides a multiwavelength (0.15-24 m) view of obscured and unobscured star formation in nearby () galaxies with SFRs ranging from 0.01 to 100 M⊙ yr-1. We calculate a robust dust measure from the infrared to UV ratio (IRX) and explore the influence of star formation history (SFH) on the dust-UV color relation (i.e. the IRX- relation). We find that the UV colors of galaxies are only weakly dependent on their SFH as measured by the 4000Å break. However, we find that the contributions of dust and SFH are distinguishable when colors at widely separated wavelengths (e.g. 0.23-3.6µm) are introduced. We show this explicitly by recasting the IRX- relation as a more general IRX-SFH-color relation, which we examine in different projections. We also determine simple fits to this relation.
Subject headings:
galaxies:evolution — dust:extinction — galaxies:ISM — ultraviolet:galaxies — infrared:galaxies1. Introduction
The color of a galaxy is determined primarily by its star formation history (SFH) and the amount of dust attenuation present, with significant additional contributions from metallicity and dust geometry. An empirical relation between SFH, dust attenuation, and color is therefore a useful constraint on models of galaxy formation, and can aid in the interpretation of high redshift galaxy observations where measurements are difficult.
Here we investigate such an empirical relation, using a representative sample of galaxies observed from the ultraviolet to the infrared by GALEX, SDSS, and Spitzer. The long wavelength coverage allows us to construct simple but robust measures of dust attenuation that are relatively free of a dependence on SFH. Similarly, the SDSS spectroscopy allows us to measure SFH diagnostics – we use a 4000Å break measure – that are largely free of a dependence on dust attenuation.
Earlier studies of the effect of dust on galaxy colors have focused on the ultraviolet (UV, ) colors of galaxies. A primary reason for this is that the intrinsic, underlying UV color (before attenuation) is relatively insensitive to the SFH of the galaxy, when compared to the effects of dust attenuation. Also, studies of the highest redshift galaxies are often restricted to the restframe UV so that estimates of dust attenuation must be made using UV colors. Calzetti et al. (1994) derived the effective attenuation properties of dust in star-bursting galaxies by comparing the total dust absorption – measured from the ratio of dust emission to UV emission – to the change in UV color of a sample of starforming galaxies (the so-called IRX- relation). This locally derived relation has been used extensively to determine the dust attenuation in galaxies at higher redshift using their UV colors (e.g. Meurer et al. (1999)). However, more recent studies (Bell et al., 2002; Seibert et al., 2005; Buat et al., 2005) have shown that there is significant scatter in this relation, especially when less rapidly starforming galaxies are included. Kong et al. (2004) show, using stellar population synthesis models with significant recent bursts, that both SFH and dust are expected to affect the UV color of normal galaxies since at a constant value of dust attenuation galaxies with an older stellar population should appear redder in the UV because of their redder intrinsic UV spectra. They thus propose that a measure of SFH – specifically the 4000Å break – can be used to explain the scatter in the IRX- relation.
2. Data
We have constructed a sample of galaxies observed from the UV to the mid/far-infrared. Our primary data set is the sample of local () galaxies observed spectroscopically by SDSS and analyzed by Kauffmann et al. (2003) and Brinchmann et al. (2004) (hereafter SDSS/MPA galaxies). The UV data is taken from pipeline processed GALEX observations of the Lockman Hole, with exposure times of ks. The pipeline-produced GALEX catalogs are searched for objects within 3” of the SDSS/MPA galaxy locations, and the nearest object is taken as the match to the SDSS galaxy. UV flux measurements are made in elliptical Kron apertures. In the optical we use SDSS petrosian magnitudes. The infrared data is provided by the SWIRE Spitzer observations of the Lockman Hole (Lonsdale et al., 2003). We have performed aperture photometry in the SWIRE team processed111http://swire.ipac.caltech.edu/swire/astronomers.html for a description of the SWIRE image processing 3.6 through 7.8µm IRAC images and 24µm MIPS images at the location of each of the SDSS/MPA galaxies, using a 7” radius aperture (12” at 24 µm). The fluxes are then aperture corrected to total magnitudes. Systematic errors in IR flux due to calibration uncertainty, aperture corrections, and the resolved nature of many of the sources amount to .
The resulting UV through 3.6µm magnitudes are -corrected to (e.g. , , etc.) using the method of Blanton et al. (2003). At longer wavelengths dust emission becomes more important than stellar emission, and we use a different method to ‘-correct’ the data: we choose the best fitting redshifted Dale et al. (2001) model IR SED, on the basis of the observed 8 to 24µm flux ratio. This SED is then normalized using the measured 24µm flux, and the integrated far-infrared (8-1000µm) dust luminosities () are derived. Note that the different Dale et al. (2001) SEDs have ratios that are different by a factor of up to five. We have checked that our results would not change significantly if we use the model SEDs of Devriendt et al. (1999) (see Papovich & Bell (2002) for a detailed discussion of predicting IR luminosities from Spitzer data).
Our final selection of galaxies consists of those SDSS/MPA galaxies with detections in the Far-UV (, Å) and Near-UV (, Å) through 24µm bands. This is a total of 467 of the 645 SDSS/MPA galaxies within the deg2 of SDSS/GALEX/Spitzer overlap. These galaxies have a stellar mass range of and a SFR range of , as determined by Kauffmann et al. (2003) and Brinchmann et al. (2004) from the optical spectra and photometry. To simplify the present analysis we do not consider upper limits or selection effects except to note that we are biased against galaxies with very low or . Nevertheless, we recover a significant number of galaxies which appear ‘old’ and elliptical but have low levels of UV and IR emission.
3. Analysis
3.1. Dust Indicators
One of the primary motivations for compiling the sample of galaxies described above was to construct a robust and model independent measure of dust attenuation, the so-called infrared excess (IRX, see Gordon et al. (2000) for a discussion of the relation of infrared excess to UV attenuation). We adopt the definition where is the 8-1000µm dust luminosity as determined above and is the luminosity in the band (Å). A second available dust indicator is the Hto Hdecrement (see Kennicutt (1998) and references therein), measured from the SDSS spectra. This dust measure is only well defined for those galaxies with strong emission lines, and cannot be easily compared to global galaxy measures due to spectroscopic aperture effects. We do not consider it in the present study.
3.2. SFH Indicators
We take the strength of the 4000Å break in galaxies as an indicator of SFH (Balogh et al., 1999; Brinchmann et al., 2004; MacArthur, 2005). This has been measured from the deredshifted SDSS spectra by Kauffmann et al. (2003) using the ratio of the flux in two narrow bands () centered at 4050Å and 3900Å. This narrowband color, D, is less sensitive to reddening by dust than broadband colors. It is not, however, completely insensitive to dust effects (MacArthur, 2005). Note that D is only measured within the 3” SDSS aperture, which can cause an overestimate of the integrated D for galaxies with moderate bulge to disk ratios. We do not consider in detail the relation between D and more physical measures of galaxy age or SFH (e.g. the ratio of current to past averaged star formation rate or the specific star formation rate), which is metallicity dependent and requires population synthesis modeling.
4. Results: The Dust-SFH-Color Relation
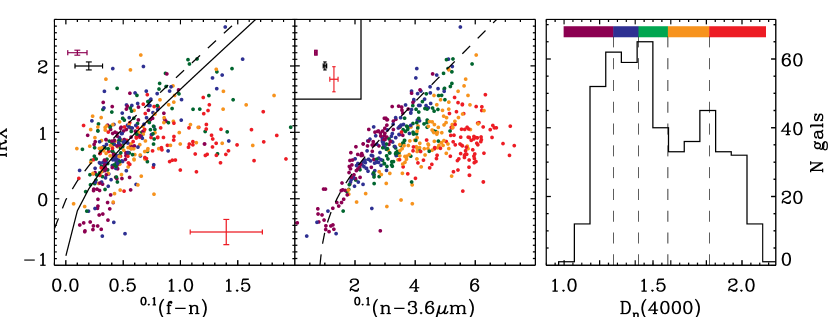
4.1. IRX vs. Color Binned by D
Models of galaxy spectra have suggested that the UV color of galaxies can be decomposed into contributions from dust and SFH, though the effect of dust is the dominant contribution (Kong et al., 2004). In Figure 1 we show the relation between IRX and color for different ranges of D. We find a marginal dependence of the IRX vs. relation (analogous to the IRX- relation) on D. Only the very oldest galaxies (red points) have systematically redder for the same value of IRX, but also have larger errors. For galaxies with D there appears to be little dependence of the scatter on galaxy SFH. This is similar to the result of Seibert et al. (2005), who use the K color as a measure of SFH (but see below for the effect of dust on the NIR color).
This result can be reconciled with the models of Kong et al. (2004) in several ways. First, some stars contributing to the dust heating (and therefore the IR emission) may not be contributing to the UV emission or, conversely, some stars contributing to the UV emission are not contributing to the IR emission (i.e. a decoupling of IR and UV emission). This may occur for various reasons including star-dust geometry (e.g. Calzetti et al. (2005); Thilker et al. (2005)) and contributions to dust heating from older stellar populations. Related to this, D may not be measuring the relevant timescale for changes in the UV spectrum. The SFH diagnostic that is likely to be most relevant to changes in the UV spectral shape is the ratio of current SFR to the SFR averaged over the last 100 Myr (Calzetti et al., 2005), which is not probed well by D. Second, weak AGN may affect the UV colors. Third, the entire range of color is mag, compared to a median error of mag. The scatter due to measurement error may obscure a trend in the scatter with SFH. The results of Kong et al. (2004) were based on a library of 95000 model spectra, which may not be well represented by our sample. These and other possibilities will be investigated in future work.
For color it is easy to see the effect of SFH that was predicted by Kong et al. (2004) for the color. At a given low D (i.e. younger mean stellar age, purple points) the relation between dust and color is clear, and has low scatter. This relation is closely related to the effective attenuation curve of the dust in these galaxies (Calzetti et al., 1994; Meurer et al., 1999). For intermediate D (i.e. intermediate mean stellar age, orange or green points) the relation between dust and color persists with low scatter, but the entire relation is shifted to redder color. This is presumably because of the redder intrinsic spectrum of an older stellar population, on top of which the effect of dust attenuation on color persists relatively unchanged. For the ratio of the median error to the range in color is significantly smaller than for , making trends with color easier to see.
At the largest D the scatter in the IRX-color relation increases – this may be due to several causes. First, there are larger errors in IRX (and color) for these galaxies, which have relatively little star formation and are systematically dimmer in and at 24µm. Second, the effects of metallicity on D become more pronounced at high D. Third, some UV emission may be due to evolved populations (e.g. BHB stars). Finally, these galaxies may well host AGN that affect the IR and/or UV emission, changing IRX.
4.2. D vs. Color Binned by IRX
In Figure 2 we present another projection of the dust-SFH-color relation. Here we show D as a function of color for different ranges of IRX. IRX appears to be well determined using just and D. The relation between D and shifts to redder color for galaxies with more dust, while the slope of the relation remains nearly constant. Galaxies in the lower right of this plot are predominantly dusty star-forming galaxies. Galaxies in the lower left are typically blue star-forming galaxies or dwarfs/irregulars. Galaxies in the upper right of Figure 2 are red-sequence galaxies composed primarily of old stars, with very low levels of UV and IR emission.
4.3. Fits to the Relation
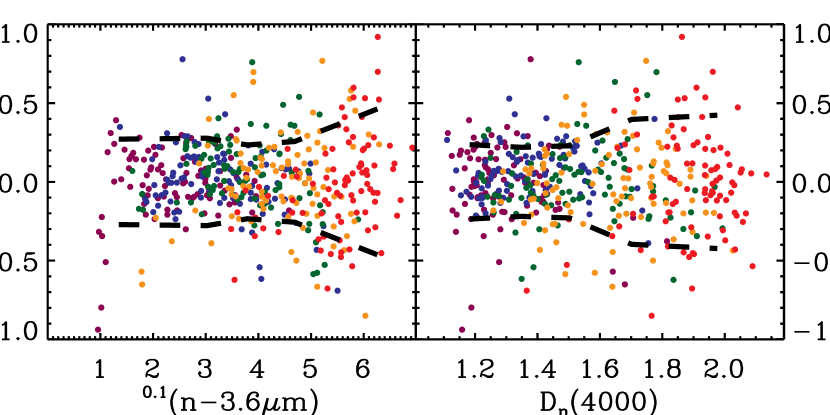
We have conducted quantitative parametric fits to the relation between dust attenuation, SFH, and the µm color. Considering a simple effective attenuation law we are motivated to consider polynomial fits to the color (), D, and an expression of IRX that is linearly related to color where is the bolometric correction to the UV and the bolometric correction to the IR has been made in §2 (see Meurer et al. (1999); Gordon et al. (2000); Seibert et al. (2005) for a discussion of the relation between IRX and the true UV attenuation ). We treat the color and D as independent variables (since the errors are much smaller than for IRX). We assume either a linear or quadratic form for the relation between color and D. The results are given in Table 1. Examination of the residuals shows that a cross term (D) is required, and fits including such a term are also given in Table 1. The fit from the 3rd row of Table 1 is overplotted in Figure 2, and the residuals in IRX as a function of color and D are shown in Figure 3. Figure 3 shows that the fit is poorer for redder colors and larger D. This may be due to the effects listed in §4.1 for the µm color, as well as the effect of aperture on D (§3.2). At bluer colors (µm) and smaller D the residuals are lower, rms in . Table 1 also includes fits using the color since this is more easily measured for a large sample of GALEX observed SDSS galaxies (e.g. Salim et al. (2005)). The behavior is similar to the µm color though the residuals are larger.
| A | B | C | D | E | RMS () | RMS (IRX) |
|---|---|---|---|---|---|---|
| µm | ||||||
| 1.31 | -3.46 | – | 0.84 | – | 0.57 | 0.33 |
| 1.21 | -1.59 | -2.73 | 0.83 | – | 0.55 | 0.31 |
| 1.08 | -1.80 | – | 1.03 | -0.72 | 0.51 | 0.31 |
| 1.07 | -2.39 | 1.59 | 1.10 | -0.94 | 0.50 | 0.32 |
| 1.60 | -3.27 | – | 0.87 | – | 0.75 | 0.43 |
| 1.43 | -0.58 | -4.12 | 0.89 | – | 0.70 | 0.39 |
| 1.27 | -1.56 | – | 1.35 | -1.24 | 0.65 | 0.38 |
| 1.25 | -2.91 | 3.30 | 1.56 | -1.82 | 0.64 | 0.39 |
We have used a simple treatment of attenuation to motivate our fits that does not self consistently consider, e.g., the heating of dust by old stars. Also, D is subject to aperture effects that may affect the fits. It is thus difficult to interpret the fit coefficients as physical parameters. The fits in Table 1 are referenced to D, because this region is typical of ‘blue sequence’ galaxies. The constant A term thus gives the typical for such galaxies. The B term (with contributions from the C and E terms when present) gives the trend in with D, and is negative since galaxies that are intrinsically redder have less attenuation for a given color. Similarly, D gives the trend in with color, and is positive as a redder galaxy at a given D has more attenuation.
5. Conclusions
While we recover only a weak SFH dependence for the short wavelength-baseline UV color, we have shown that long wavelength-baseline colors – specifically – can be decomposed into contributions from dust and SFH with low scatter. This is the dust-SFH-color relation. Such a decomposition is possible due to the use of a relatively dust-insensitive (though perhaps metallicity dependent) SFH indicator in combination with a robust measure of the dust attenuation in galaxies. At large D the relation between dust, SFH, and color is more scattered, suggesting that an additional parameter may be necessary to explain the color of such galaxies, or that our SFH and/or dust indicators become less reliable here. Deep Spitzer IRAC data, when combined with optical data, is ideally suited to measuring the color for galaxies at , allowing similar analyses for galaxies at much earlier epochs (e.g. Kriek et al. (2006) and Reddy et al. (2006)).
References
- Balogh et al. (1999) Balogh, M. L., Morris, S. L., Yee, H. K. C., Carlberg, R. G., & Ellingson, E. 1999, ApJ, 527, 54
- Bell et al. (2002) Bell, E. F., Gordon, K. D., Kennicutt, R. C., & Zaritsky, D. 2002, ApJ, 565, 994
- Blanton et al. (2003) Blanton, M. R. et al. 2003, AJ, 125, 2348
- Brinchmann et al. (2004) Brinchmann, J., Charlot, S., White, S. D. M., Tremonti, C., Kauffmann, G., Heckman, T., & Brinkmann, J. 2004, MNRAS, 351, 1151
- Buat et al. (2005) Buat, V. et al. 2005, ApJ, 619, L51
- Calzetti et al. (1994) Calzetti, D., Kinney, A. L., & Storchi-Bergmann, T. 1994, ApJ, 429, 582
- Calzetti et al. (2005) Calzetti, D., et al. 2005, astro-ph/0507427
- Dale et al. (2001) Dale, D. A., Helou, G., Contursi, A., Silbermann, N. A., & Kolhatkar, S. 2001, ApJ, 549, 215
- Devriendt et al. (1999) Devriendt, J. E. G., Guiderdoni, B., & Sadat, R. 1999, A&A, 350, 381
- Gordon et al. (2000) Gordon, K. D., Clayton, G. C., Witt, A. N., & Misselt, K. A. 2000, ApJ, 533, 236
- Johnson et al. (2006, in prep.) Johnson, B. D. et al. 2006, in prep.
- Kauffmann et al. (2003) Kauffmann, G. et al. 2003, MNRAS, 341, 33
- Kennicutt (1998) Kennicutt, R. C. 1998, ARA&A, 36, 189
- Kong et al. (2004) Kong, X., Charlot, S., Brinchmann, J., & Fall, S. M. 2004, MNRAS, 349, 769
- Kriek et al. (2006) Kriek, M., et al. 2006, astro-ph/0603063
- Lonsdale et al. (2003) Lonsdale, C. J. et al. 2003, PASP, 115, 897
- MacArthur (2005) MacArthur, L. A. 2005, ApJ, 623, 795
- Meurer et al. (1999) Meurer, G. R., Heckman, T. M., & Calzetti, D. 1999, ApJ, 521, 64
- Papovich & Bell (2002) Papovich, C., & Bell, E. F. 2002, ApJ, 579, L1
- Reddy et al. (2006) Reddy, N. A., et al. 2006, ApJ, in press
- Salim et al. (2005) Salim, S., et al. 2005, ApJ, 619, L39
- Seibert et al. (2005) Seibert, M. et al. 2005, ApJ, 619, L55
- Thilker et al. (2005) Thilker, D. A. et al. 2005, ApJ, 619, L79