Millimeter Multiplicity in NGC 6334 I and I(N)
Abstract
Using the Submillimeter Array (SMA), we have imaged the 1.3 millimeter continuum emission at the center of the massive star-forming regions NGC 6334 I and I(N). In both regions, the SMA observations resolve the emission into multiple millimeter sources, with most of the sources clustered into areas only 10,000 AU in diameter. Toward NGC 6334 I, we find four compact sources: the two brightest (I-SMA1 and I-SMA2) are associated with previously-known ammonia cores; I-SMA3 is coincident with the peak of the compact H ii region (NGC 6334 F); and I-SMA4 is a newly-discovered object. While I-SMA3 exhibits a mixture of free-free and dust emission, the rest of the objects are dust cores. Toward NGC 6334 I(N), seven compact dust cores are found, one of which is associated with a faint centimeter source. With the exception of I-SMA3, none of the millimeter sources have infrared counterparts in Spitzer Space Telescope 3-8 m images. Using a simple physical model for the dust continuum emission, the estimated mass of interstellar material toward each of these compact objects is in the range of 3 to 66 . The total mass in the compact objects appears to be similar in I and I(N). The small size of these groups of sources suggest that these objects are proto-Trapezia forming in the centers of clusters of low to intermediate-mass stars.
Subject headings:
stars: formation — infrared: stars — ISM: individual (NGC 6334 I) — ISM: individual (NGC 6334 I(N)) — techniques: interferometric — submillimeter1. Introduction
The formation process of massive stars continues to be a poorly-understood phenomenon in astrophysics. The most fundamental clues to the origin of OB stars are their multiplicity and their common association with high column densities of molecular gas and dust. A unique feature of OB stars is that they are often found in non-hierarchical (and consequently) non-stable systems in the center of clusters (Sharpless, 1954). A nearby example of this phenomenon is the Orion Trapezium with projected stellar separations of 4000 to 10000 AU, which in turn is found in the center of a rich cluster of low mass stars. A long-standing question is whether these multiple systems are the direct result of the formation process, thus providing a clue to the process of high mass star formation, or the result of dynamical evolution in the centers of young clusters where the most massive stars move toward the center by ejecting lower mass stars outward (Bonnell & Davies, 1998). While recent (sub)millimeter studies have identified good candidates for massive protoclusters on scales of several parsecs, the identification of proto-Trapezia is a more difficult prospect. Due to the complex nature of high mass star-forming regions, the high extinction typically observed toward massive protostars, and their typically large distance ( kpc), high-resolution imaging at (sub)millimeter wavelengths is required to resolve one protostar from another. Recent space-based near-infrared (NIR) imaging has succeeded in identifying a 5600 AU diameter cluster of five proto-OB stars comprising W3 IRS 5 (Megeath et al., 2005). However, because massive protostars form in the deeply-embedded cores of molecular clouds, dust extinction may obscure a significant fraction of them in the infrared. In these cases, millimeter continuum emission from dust provides one of the few alternative tracers of protostars because it remains optically thin at high column densities ().
The recent commissioning of the Submillimeter Array (SMA) on Mauna Kea, Hawaii has expanded the range of millimeter interferometry to higher frequencies and lower declinations. Now within reach is NGC 6334 (), a luminous and relatively nearby (1.7 kpc; Neckel, 1978) molecular cloud/H ii region complex containing several concentrations of massive star formation at various stages of evolution (Straw & Hyland, 1989). The northeastern end appears to be the youngest and contains the radio source “F” (G351.42+0.64; Rodríguez et al. (1982)) which is associated with IRAS 17175-3544. The earliest far-infrared images of this region (Emerson et al., 1973; McBreen et al., 1979) identified the emission as source “I”. An additional component “I(N)” was first detected at 1mm (Cheung et al., 1978) and later at m (Gezari, 1982). Further observations have demonstrated that although these two cores have comparable mass, NGC 6334 I dominates the combined bolometric luminosity of (Sandell, 2000). In the NIR, an embedded cluster of stars has been detected in the central of NGC 6334 I (Tapia et al., 1996). In contrast, the only NIR emission detected toward I(N) are H2 knots that are most likely associated with outflow activity (see Figure 3 of Megeath & Tieftrunk (1999)). In this paper, we present the first 1.3 millimeter interferometry of NGC 6334 I and I(N). Despite their strikingly different appearance in the NIR, we find that both regions contain a similar cluster of compact dust continuum cores. A detailed treatment of the millimeter line emission accompanying these objects will be the subject of a forthcoming paper (Hunter et al., in preparation).
2. Observations
2.1. Submillimeter Array (SMA)
The SMA111The Submillimeter Array (SMA) is a collaborative project between the Smithsonian Astrophysical Observatory and the Academia Sinica Institute of Astronomy & Astrophysics of Taiwan. observations were made with six antennas in both the compact configuration (2004 May), and extended configuration (2005 May). Two pointings were observed: NGC 6334 I at , and NGC 6334 I(N) at , (J2000). Unprojected baseline lengths ranged from 22m to 226m. The SMA receivers are double sideband mixers with 2 GHz bandwidth (Blundell, 2004). The center frequencies were 217.6 in LSB and 227.6 GHz in USB. The correlator was configured for uniform resolution (0.81 MHz per channel). Typical system temperatures were 200K. The gain calibrators were NRAO 530 ( distant) and J1924292 ( distant) and the bandpass calibrators were Uranus and 3C279. The data were calibrated in Miriad, then exported to AIPS where the line and continuum emission were separated with the task UVLSF. Self-calibration was performed on the continuum data, and solutions were transferred to the line data. Flux calibration is based on SMA flux monitoring of the observed quasar and is estimated to be accurate to within 20%. The estimated accuracy of the absolute coordinates is . After combining the calibrated LSB and USB continuum uv-data, the 1 rms noise level achieved in the continuum images is 7 mJy beam-1. The resulting synthesized beam is and the primary beam is .
2.2. Very Large Array (VLA)
Archival 3.6 cm data from the NRAO222The National Radio Astronomy Observatory is a facility of the National Science Foundation operated under agreement by the Associated Universities, Inc. Very Large Array (VLA) were calibrated and imaged in AIPS. The observation date was May 7, 1990 (A-configuration). The flux calibrator was 3C286, and the gain calibrator was NRAO530. The synthesized beam of the 3.6 cm continuum image is at (P.A.=) and the rms sensitivity is 1 mJy beam-1.
2.3. Spitzer Space Telescope
Both SMA fields were observed with the IRAC camera (Fazio et al., 2004) onboard the Spitzer Space Telescope. The total integration time was 666 seconds. The high dynamic range mode was used to obtain 0.4 and 10.4 second integrations. The data were reduced using the BCD data from the Spitzer Science Center version 11.4 pipeline. When constructing images, the 0.4 second data were used toward pixels where the 10.4 second data were saturated, which is only the case for some of the sources in NGC 6334 I. The pixel size for the images is . Upper limits were derived from mosaics produced with the MOPEX program. To calculate the upper limits, the rms signal was found for a 5x5 pixel box centered on the SMA sources. These values were converted to units of mJy per pixel, then multiplied by a factor of to calculate limits for detections in a 2x2 pixel aperture.
3. Results
3.1. NGC 6334 I
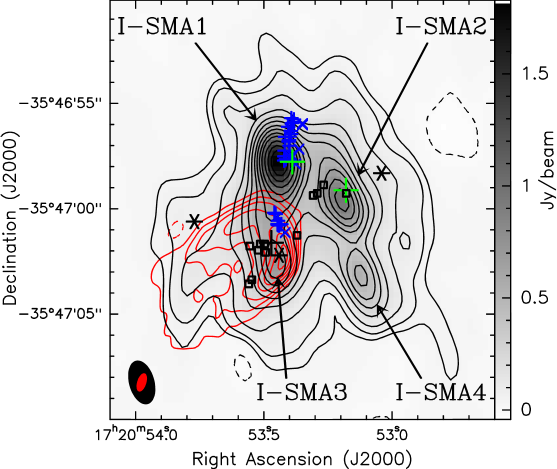
The 1.3 mm continuum emission in NGC 6334 I is shown in Figure 1. We have resolved four major continuum sources which we denote as I-SMA1..4, in descending order of peak intensity (see Table 1). The continuum sources are all fairly compact. Gaussian fitting yields formal size estimates between 1.6 and 2.7 arcsec (2800 and 4600 AU). Including compact and extended emission, the total flux density within Figure 1 is Jy, equivalent to % of the single dish continuum flux density (Sandell, 2000). The overall extent of the emission () agrees well with the size estimate from single-dish maps (Sandell, 2000). No other sources are found beyond this central concentration of objects. The two brightest millimeter sources (I-SMA1 and I-SMA2) correspond within to the two primary NH3 peaks observed in the (1,1), (2,2), and (3,3) transitions (Beuther et al., 2005; Kraemer & Jackson, 1995). The H2O masers form a linear structure (Forster, 1992) that appears to be associated with I-SMA1. In contrast, the 6.7 GHz CH3OH masers are associated with I-SMA2 and I-SMA3. I-SMA3 coincides to within of the peak of the 3.6 cm emission which traces a cometary compact H ii region (Carral et al., 1997). Based on the 3.6 cm flux density, we estimate that the free-free contribution to the 1.3 mm flux density of I-SMA3 is Jy (62%). The rest of the 1.3 mm continuum emission from this source (and all of the other sources) originates from dust. I-SMA3 lies south of the NIR star IRS1E which has been proposed as the exciting source of the compact H ii region (Persi et al., 1996). Since free-free emission dominates I-SMA3, it is perhaps not surprising that its position lies closer to the mid-IR/cm peak than to IRS1E. The known mid-IR sources IRS-I 2 (Persi et al., 1998) and DPT00 2 (De Buizer et al., 2002) reside within the extended millimeter contours, but the lack of a compact millimeter source at these positions supports the hypothesis of De Buizer et al. (2002) that they are not internally heated. With the exception of the H ii region nebula (I-SMA3), none of the millimeter sources are detected in the IRAC images. Indeed, no compact counterpart at any other wavelength has been observed toward I-SMA4.
| Source | J2000 coordinates | |||||
|---|---|---|---|---|---|---|
| () | () | (Jy/b) | (Jy) | (mJy) | (mJy) | |
| I-SMA1 | 17 20 53.44 | -35 46 57.9 | ..aafootnotemark: | |||
| I-SMA2 | 17 20 53.20 | -35 46 59.6 | ||||
| I-SMA3 | 17 20 53.45 | -35 47 02.6 | ..aafootnotemark: | ..aafootnotemark: | ||
| I-SMA4 | 17 20 53.12 | -35 47 03.2 | ||||
| Total | bbfootnotemark: | |||||
| I(N)-SMA1 | 17 20 55.21 | -35 45 04.1 | ||||
| I(N)-SMA2 | 17 20 54.90 | -35 45 06.8 | ||||
| I(N)-SMA3 | 17 20 55.00 | -35 45 07.5 | ||||
| I(N)-SMA4 | 17 20 54.69 | -35 45 08.5 | ||||
| I(N)-SMA5 | 17 20 55.08 | -35 45 02.0 | ||||
| I(N)-SMA6 | 17 20 54.59 | -35 45 17.9 | ||||
| I(N)-SMA7 | 17 20 54.96 | -35 44 57.3 | ||||
| I(N) Total | bbfootnotemark: | |||||
a The extended nebula of the compact HII region precludes a meaningful infrared point source upper limit
b The total 1.3mm flux density includes the extended emission; the listed uncertainties include 20% calibration uncertainty
3.2. NGC 6334 I(N)
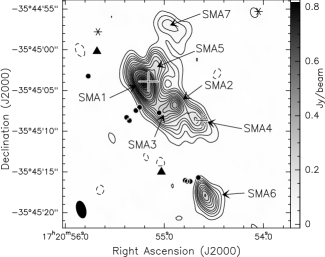
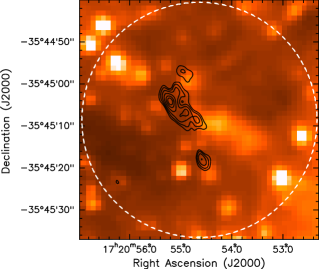
We have resolved the millimeter continuum of NGC 6334 I(N) into seven sources, which we denote as I(N)-SMA1..7 (Figure 2). Including the extended emission, the fraction of single-dish flux recovered in our image is %. Nearly half of the total emission originates from I(N)-SMA1. Although this field lacks any strong centimeter continuum emission, two faint 3.6 cm (0.3 mJy) sources have been reported (Carral et al., 2002). One of these sources lies within of I(N)-SMA4, which is also the source closest to a Class II CH3OH maser (Walsh et al., 1998; Norris et al., 1993). The faint continuum source with its (probable) associated class II CH3OH maser may represent a hypercompact HII region, similar to the sources found by van der Tak & Menten (2005) in other massive star formation regions. If this interpretation is true, then this object is an important power source in the I(N) region. Class I CH3OH masers have also been identified in this region at 25 GHz (Beuther et al., 2005) and at 44 GHz but with uncertain astrometry (Kogan & Slysh, 1998). None of the millimeter sources have counterparts in our IRAC data ( upper limits at m and m are given in Table 1). However, directly west of I(N)-SMA4 is an extended infrared source detected at 4.5 and 5.8 m (Figure 3). The elongated morphology suggests a jet or a reddened reflection nebulosity from an outflow cavity. In either scenario, the extended mid-IR emission would be the result of outflow activity from the embedded source in I(N)-SMA4. The unipolarity could be explained if the other lobe of the putative outflow was obscured by stronger extinction in its direction. This possible association is the only evidence, albeit indirect, for the I(N)-SMA sources at wavelengths m.
3.3. Mass estimates from the dust emission
We can estimate the mass of the individual dust sources by placing our millimeter continuum measurements in the context of a simple isothermal model of optically-thin dust emission (Beltrán et al., 2006). The assumption of low optical depth is justified because the peak continuum brightness temperature of the strongest dust source (I-SMA1) is only 6.3 K. The input parameters to the model include the dust temperature, the dust mass opacity coefficient at the observed wavelength (), and the gas-to-dust mass ratio. Based on our SMA spectra (Hunter et al., in preparation), we can categorize the sources into three groups: A) strong hot-core line emission: I-SMA1, I-SMA2 and I(N)-SMA1, B) weak line emission: I-SMA3 and I(N)-SMA2, and C) nearly line-free emission. Thus, from a qualitative viewpoint, the gas and dust is likely to be warmest in the group A sources, and coolest in the group C sources. By combining this information with the various gas temperature measurements from the literature, we have assigned a probable value for the dust temperature of each source including upper and lower limits (see Table 2).
| cold limit | nominal | warm limit | |||||
| Source | (cm2 g-1) | (K) | () | (K) | () | (K) | () |
| I-SMA1 | 2 | 75 | 23 | 100 | 17 | 300 | 5.4 |
| I-SMA2 | 2 | 75 | 15 | 100 | 11 | 300 | 3.5 |
| I-SMA3 | 1 | 40 | 52 | 60 | 33 | 100 | 19 |
| I-SMA4 | 1 | 20 | 66 | 33 | 36 | 50 | 22 |
| Total | 156 | 97 | 50 | ||||
| I(N)-SMA1 | 2 | 65 | 15 | 100 | 10 | 300 | 3.1 |
| I(N)-SMA2 | 1 | 20 | 30 | 40 | 13 | 100 | 4.8 |
| I(N)-SMA3 | 1 | 20 | 23 | 33 | 13 | 50 | 7.8 |
| I(N)-SMA4 | 1 | 20 | 20 | 33 | 11 | 50 | 6.1 |
| I(N)-SMA5 | 1 | 20 | 17 | 33 | 9 | 50 | 5.2 |
| I(N)-SMA6 | 1 | 20 | 28 | 33 | 15 | 50 | 8.7 |
| I(N)-SMA7 | 1 | 20 | 12 | 33 | 6 | 50 | 3.7 |
| I(N) Total | 145 | 77 | 39 | ||||
For the sources in group A, the brightness temperature of the arcsecond scale NH3 (2,2) emission provides the lower-limit temperature (Beuther et al., 2005). For I-SMA1 and I-SMA2, we set the “nominal” temperature equal to the dust temperature (100 K) obtained from fits to the single-dish spectral energy distribution (SED) for source I (Sandell, 2000). We also use 100 K for I(N)-SMA1, because the single-dish intensity ratio of NH3 (6,6) to (3,3) indicates the presence of gas with K (Kuiper et al., 1995); furthermore, recent interferometric measurements have localized the bulk of the NH3 (6,6) emission to the position of I(N)-SMA1 (Beuther et al., in preparation). For an upper limit temperature for group A, we adopt 300 K because an excitation temperature of 295 K was measured for H2CO in NGC 6334 I by Mangum & Wootten (1993) and 213 K for CH3OH by van der Tak et al. (2003). For the sources in group B, we set the nominal temperature equal to the CO excitation temperature derived by Kraemer et al. (1999) which is 60 K for NGC 6334 I and 40 K for I(N). For the sources in group C, we set the nominal temperature equal to the value (33 K) derived from a Large Velocity Gradient analysis of a single-dish submillimeter line survey (McCutcheon et al., 2000). In both I and I(N), the lower limit temperature of the group B and C sources is taken to be the temperature of the coolest dust core (20 K) in the surrounding region as measured by Sandell (2000), while the upper limit is taken to be 50 K due to the lack of direct evidence of any warmer gas at these positions. Measurements of in NGC 6334 I and I(N) with a beam yield values from 1.0 to cm2 g-1 (Schwartz et al., 1989). However, due to the large range of temperature in the compact millimeter sources, we have chosen to use tabulated values of from Ossenkopf & Henning (1994) for a density of cm-3. For sources in group A, we use a cm2 g-1 for dust grains without mantles, which is appropriate for regions where protostellar heating has destroyed the solid ice but has not yet dispersed the dust aggregates. In the other millimeter sources which show no hot core emission and are opaque at infrared wavelengths, the grains are likely to have thick ice mantles; thus we use cm2 g-1. Applying a gas-to-dust mass ratio () of 100 (Sodroski et al., 1997), these assumptions yield the masses listed in Table 2. Due to uncertainties in and , the uncertainties in all of the masses in Table 2 are likely to be at least a factor of two. Subject to these uncertainties, the total mass estimates of the compact objects (in both the warm and cold temperature limits) are of similar magnitude in I and I(N), ranging from to . In I(N), this mass is divided among a larger number sources which are, in turn, spread over a larger angular extent.
4. Discussion
The observed multiplicity and strength of the millimeter continuum emission is quite similar between NGC 6334 I and I(N), in contrast to their strikingly different appearance in the NIR (Megeath & Tieftrunk, 1999) and in thermal lines of NH3 and CH3OH (Beuther et al., 2005). Although previous maser and NH3 observations of NGC 6334 I had suggested the presence of multiple sources, our millimeter image provides a direct and unambiguous picture of a massive protocluster. The estimated mass of interstellar material toward each source is sufficient to form a massive star and is significantly greater than typical objects detected in the single-dish surveys of low-mass star-forming regions such as Perseus, where an average core mass of 2.3 has been found with a beamsize of AU (Enoch et al., 2006). In addition, it is likely that a compact protostellar object may already be present at the center of each source, heating the surrounding gas and dust and leading to our strong millimeter detections. This scenario is particularly likely for the strong hot-core sources I-SMA1 and I-SMA2. It is important to note that the masses in Table 2 do not include the total stellar mass that may be present in addition to the interstellar material.
In the case of NGC 6334 I(N), the presence of outflows, masers, warm gas emission, and a faint centimeter continuum source also indicates the presence of embedded sources. In comparison to source I, this cluster of sources may be in an earlier evolutionary phase, as suggested by the lack of a NIR cluster, HII region, or bright mid-IR source, and the significantly higher gas column density inferred from N2H+ observations (Pirogov et al., 2003). However, if the millimeter sources contain central protostars, then the lack of mid-IR detections toward all seven sources is especially curious, because, in contrast to source I, there is no confusion from bright, extended nebulosity in this region. If we consider the I(N) bolometric luminosity of (Sandell, 2000), the earliest ZAMS star that could be present is type B2V (Hanson et al., 1997). Our lowest m upper limit of 0.11 mJy (from Table 1) corresponds to an apparent magnitude . This limit is consistent with the non-detection of an embedded B2V ZAMS star as long as the extinction at m is mag, assuming an absolute stellar magnitude of (Hanson et al., 1997) and an intrinsic color mag (Koornneef, 1983). This level of extinction at m corresponds to 9.3 mag of band extinction (Indebetouw et al., 2005), 83 mag of band extinction (Rieke & Lebofsky, 1985), and a total hydrogen column density of (Ryter, 1996). Even using the smallest mass estimates from Table 2, the gas column density implied by the dust emission is several times larger than this value and can easily explain the non-detections. As a result, it is unclear whether these millimeter sources contain young protostars (B2 or later) that are simply heavily obscured, or whether they are intrinsically faint in the mid-IR due to their youth, and may eventually evolve into higher luminosity O stars. In either case, the high angular resolution and sensitivity of our observations have revealed the presence of compact systems where intermediate to high mass stars are being formed.
In NGC 6334 I, all four of the compact millimeter continuum sources are concentrated within a region of projected radius pc which is significantly smaller than the 0.33 pc radius of the NIR cluster (Tapia et al., 1996) and the 0.23 pc radius of the search region (i.e. the SMA primary beam). Furthermore, the millimeter sources in NGC 6334 I reside close to the geometric center of the NIR cluster where the number density of millimeter sources (8000 pc-3) exceeds the stellar density of the NIR cluster (1200 pc-3). These findings suggest that massive star formation is biased toward the center of the parent cluster. The projected separation of the four components of NGC 6334 I range from 5800 to 11200 AU. Because the ratio of distances between all components is less than three, it satisfies the criterion for identifying Trapezia as described by Abt & Corbally (2000) and originated by Ambartsumian (1954). If the total luminosity of NGC 6334 I ( ) was apportioned equally to four sources, their individual luminosities would correspond to that of an O8.5 ZAMS star (Hanson et al., 1997). These findings argue that the NGC 6334 I SMA sources may constitute a proto-Trapezium system, similar to the more evolved Orion Nebula Trapezium (10,000 AU in diameter) and many other optically visible nebulae and clusters. Although the I(N) SMA sources are more spread out, five of the sources of I(N) reside inside a region of 10,000 AU, suggesting that a similar system is forming in I(N). These observations suggest that the presence of Trapezia in clusters and nebulae may result from the massive stars forming preferentially in the centers of clusters in the deepest part of the gravitational well.
Are these new observations consistent with previous claims (Megeath & Tieftrunk, 1999; Sollins & Megeath, 2004) that NGC 6334 I(N) is in an earlier stage of star formation? In source I, we have identified examples of young massive protostars in the center of an established infrared cluster containing low to intermediate mass stars. In source I(N), we see evidence of massive protostars without a surrounding NIR cluster, which challenges the common picture of high mass stars forming after the first generation of low mass stars (e.g. Herbig (1962); Kumar et al. (2006)). More sensitive infrared imaging is needed to probe deeper through the extinction for signs of lower mass protostars in this field. However, until such evidence is found, the question of the relative age of I and I(N) hinges on three main facts: 1) the ratio of bolometric luminosity between I and I(N) is large () (Sandell, 2000); 2) the I(N) region exhibits significantly less hot-core line emission than NGC 6334 I (Thorwirth et al. (2003); Hunter et al., in preparation); 3) a cluster of compact dust continuum sources exists in I and I(N) with a comparable amount of mass (this paper). These observations suggest that NGC 6334 I is a more evolved cluster than I(N), or that I(N) is forming a cluster with a larger number of stars but of lower mass. In either case, our millimeter data provide strong evidence that NGC 6334 I(N) is forming a cluster of stars, even though an associated NIR cluster has not been identified, and may be still in the process of forming. Finally, we note that the virial masses derived from single-dish molecular line spectra (including N2H+ by Pirogov et al. (2003) and HC3N by Sollins & Megeath (2004)) for both NGC 6334 I and I(N) are several times higher than the total estimated mass contained in the compact millimeter sources. This fact illustrates the wealth of star-forming material in both regions that has either not assembled into compact protostars or exists in a wider distribution of smaller cores below our sensitivity limit. It is this gas which may be forming the cluster surrounding the SMA sources in NGC 6334 I(N) and which may further increase the population of the cluster in NGC 6334 I.
References
- Abt & Corbally (2000) Abt, H. A. & Corbally, C. J. 2000, ApJ, 541, 841
- Ambartsumian (1954) Ambartsumian, V. A. 1954, Les Processus Nucléaires dans les Astres, 293
- Beltrán et al. (2006) Beltrán, M. T., Brand, J., Cesaroni, R., Fontani, F., Pezzuto, S., Testi, L., & Molinari, S. 2006, A&A, 447, 221
- Beuther et al. (2005) Beuther, H., Thorwirth, S., Zhang, Q., Hunter, T. R., Megeath, S. T., Walsh, A. J., & Menten, K. M. 2005, ApJ, 627, 834
- Blundell (2004) Blundell, R. 2004, in Proceedings of the 15th International Symposium on Space Terahertz Technology, 3
- Bonnell & Davies (1998) Bonnell, I. A., & Davies, M. B. 1998, MNRAS, 295, 691
- Carral et al. (1997) Carral, P., Kurtz, S. E., Rodríguez, L. F., de Pree, C., & Hofner, P. 1997, ApJ, 486, L103+
- Carral et al. (2002) Carral, P., Kurtz, S. E., Rodríguez, L. F., Menten, K., Cantó, J., & Arceo, R. 2002, AJ, 123, 2574
- Cheung et al. (1978) Cheung, L., Frogel, J. A., Hauser, M. G., & Gezari, D. Y., ApJ, 226, L149
- De Buizer et al. (2000) De Buizer, J. M., Piña, R. K., & Telesco, C. M. 2000, ApJS, 130, 437
- De Buizer et al. (2002) De Buizer, J. M., Radomski, J. T., Piña, R. K., & Telesco, C. M. 2002, ApJ, 580, 305
- Emerson et al. (1973) Emerson, J. P., Jennings, R. E., & Moorwood, A. F. M. 1973, ApJ, 184, 401
- Enoch et al. (2006) Enoch, M. L., et al. 2006, ApJ, 638, 293
- Fazio et al. (2004) Fazio, G. G. et al. 2004, ApJS, 154, 10
- Forster (1992) Forster, J. 1992, in Astrophysical Masers, ed. A. Clegg & G. Nedoluha (Springer-Verlag)
- Gezari (1982) Gezari, D. Y. 1982, ApJ, 259, L29
- Hanson et al. (1997) Hanson, M. M., Howarth, I. D., & Conti, P. S. 1997, ApJ, 489, 698
- Herbig (1962) Herbig, G. H. 1962, Advances in Astronomy and Astrophysics, 1, 47
- Indebetouw et al. (2005) Indebetouw, R., et al. 2005, ApJ, 619, 931
- Kogan & Slysh (1998) Kogan, L. & Slysh, V. 1998, ApJ, 497, 800
- Koornneef (1983) Koornneef, J. 1983, A&A, 128, 84
- Kraemer & Jackson (1995) Kraemer, K. E. & Jackson, J. M. 1995, ApJ, 439, L9
- Kraemer et al. (1999) Kraemer, K. E., Deutsch, L. K., Jackson, J. M., Hora, J. L., Fazio, G. G., Hoffmann, W. F., & Dayal, A. 1999, ApJ, 516, 817
- Kuiper et al. (1995) Kuiper, T. B. H., Peters, W. L., Forster, J. R., Gardner, F. F., & Whiteoak, J. B. 1995, ApJ, 446, 692
- Kumar et al. (2006) Kumar, M. S. N., Keto, E., & Clerkin, E. 2006, A&A, 449, 1033
- Mangum & Wootten (1993) Mangum, J. G. & Wootten, A. 1993, ApJS, 89, 123
- McBreen et al. (1979) McBreen, B., Fazio, G. G., Stier, M., & Wright, E. L. 1979, ApJ, 232, L138
- McCutcheon et al. (2000) McCutcheon, W. H., Sandell, G., Matthews, H. E., Kuiper, T. B. H., Sutton, E. C., Danchi, W. C., & Sato, T. 2000, MNRAS, 316, 152
- Megeath & Tieftrunk (1999) Megeath, S. T. & Tieftrunk, A. R. 1999, ApJ, 526, L113
- Megeath et al. (2005) Megeath, S. T., Wilson, T. L., & Corbin, M. R. 2005, ApJ, 622, L141
- Migenes et al. (1999) Migenes, V., Horiuchi, S., Slysh, V. I., Val’tts, I. E., Golubev, V. V., Edwards, P. G., Fomalont, E. B., Okayasu, R., Diamond, P. J., Umemoto, T., Shibata, K. M., & Inoue, M. 1999, ApJS, 123, 487
- Neckel (1978) Neckel, T. 1978, A&A, 69, 51
- Norris et al. (1993) Norris, R. P., Whiteoak, J. B., Caswell, J. L., Wieringa, M. H., & Gough, R. G. 1993, ApJ, 412, 222
- Ossenkopf & Henning (1994) Ossenkopf, V. & Henning, T. 1994, A&A, 291, 943
- Persi et al. (1996) Persi, P., Roth, M., Tapia, M., Marenzi, A. R., Felli, M., Testi, L., & Ferrari-Toniolo, M. 1996, A&A, 307, 591
- Persi et al. (1998) Persi, P., Tapia, M., Felli, M., Lagage, P. O., & Ferrari-Toniolo, M. 1998, A&A, 336, 1024
- Pirogov et al. (2003) Pirogov, L., Zinchenko, I., Caselli, P., Johansson, L. E. B., & Myers, P. C. 2003, A&A, 405, 639
- Rieke & Lebofsky (1985) Rieke, G. H., & Lebofsky, M. J. 1985, ApJ, 288, 618
- Rodríguez et al. (1982) Rodríguez, L. F., Canto, J., & Moran, J. M. 1982, ApJ, 255, 103
- Ryter (1996) Ryter, C. E. 1996, Ap&SS, 236, 285
- Sandell (2000) Sandell, G. 2000, A&A, 358, 242
- Schwartz et al. (1989) Schwartz, P. R., Snell, R. L., & Schloerb, F. P. 1989, ApJ, 336, 519
- Sharpless (1954) Sharpless, S. 1954, ApJ, 119, 334
- Sodroski et al. (1997) Sodroski, T. J., Odegard, N., Arendt, R. G., Dwek, E., Weiland, J. L., H auser, M. G., & Kelsall, T. 1997, ApJ, 480, 173
- Sollins & Megeath (2004) Sollins, P. K., & Megeath, S. T. 2004, AJ, 128, 2374
- Straw & Hyland (1989) Straw, S. M. & Hyland, A. R. 1989, ApJ, 340, 318
- Tapia et al. (1996) Tapia, M., Persi, P., & Roth, M. 1996, A&A, 316, 102
- Thorwirth et al. (2003) Thorwirth, S., Winnewisser, G., Megeath, S. T., & Tieftrunk, A. R. 2003, in ASP Conf. Ser. 287: Galactic Star Formation Across the Stellar Mass Spectrum, 257–260
- van der Tak et al. (2003) van der Tak, F. F. S., Boonman, A. M. S., Braakman, R., & van Dishoeck, E. F. 2003, A&A, 412, 133
- van der Tak & Menten (2005) van der Tak, F. F. S., & Menten, K. M. 2005, A&A, 437, 947
- Walsh et al. (1998) Walsh, A.J., Burton, M. G., Hyland, A. R., & Robinson, G. 1998, MNRAS, 301, 640