11email: riffel@ufrgs.br
11email: miriani.pastoriza@ufrgs.br 22institutetext: Laboratório Nacional de Astrofísica - Rua dos Estados Unidos 154, Bairro das Nações . CEP 37504-364, Itajubá, MG, Brazil
22email: aardila@lna.br
A 0.8-2.4 m spectral atlas of active galactic nuclei
Abstract
Aims. We present a near-infrared spectral atlas of 47 active galactic nuclei (AGN) of all degrees of activity in the wavelength interval of 0.8-2.4 m, including the fluxes of the observed emission lines. We analyze the spectroscopic properties of the continuum and emission line spectra of the sources.
Methods. In order to exclude aperture and seeing effects we used near-infrared spectroscopy in the short cross-dispersed mode (SXD, 0.82.4 m), taking the JHK-bands spectra simultaneously.
Results. We present the most extensive NIR spectral atlas of AGN to date. This atlas offers a suitable database for studying the continuum and line emission properties of these objects in a region full of interesting features. The shape of the continuum of QSOs and Sy 1’s are similar, being essentially flat in the H and K bands, while a strong variation is found in the J band. In Seyfert 2 galaxies, the continuum in the F space smoothly decreases in flux from 1.2m redwards in almost all sources. In J, it smoothly rises bluewards in some sources, while in others a small decrease in flux is observed. The spectra are dominated by strong emission features of H i, He i, He ii, [S iii] and by conspicuous forbidden lines of low and high ionization species. Molecular lines of H2 are common features of most objects. The absence of O i and Fe ii lines in Seyfert 2 galaxies and the smaller FWHM of these lines relative to that of H i in the Seyfert 1 give observational support to the fact that they are formed in the outermost portion of the broad-line region. The[P ii] and coronal lines are detected for all degrees of activity. The [Fe ii] 12570Å/16436Å line ratio becomes a reliable reddening indicator for the narrow-line region of Seyfert galaxies.
Key Words.:
near-infrared atlas – AGN – emission lines1 Introduction
From the spectroscopic point of view, active galactic nuclei (AGNs) have been poorly studied in the near-infrared (NIR) spectral region, particularly in the interval between 1 m and 2.4 m. This region has been systematically absent in most surveys mainly because it does not fall within the spectral coverage of optical CCD detectors or infrared satellites (i.e., ISO, Spitzer). As a result, very little is known about the spectroscopic properties of AGNs in a transition zone that contains interesting features, in both the continuum and emission lines that can help to put firm constraints on the physical properties of the nuclear emitting gas and its environment.
With the new generation of IR arrays and their improved sensitivity, it is now possible to carry out spectroscopy at moderate resolution on faint and extended targets, such as galaxies and quasars. In addition, with the availability of cross-dispersed spectrographs offering simultaneous wavelength coverage in the interval 0.82.4 m, it is now possible to study the NIR region avoiding the aperture and seeing effects that usually affect JHK spectroscopy done in long-slit mode and single-band observations.
There is manifold interest in the NIR range. At 1.1 m (J-band), the nuclear continuum emission that dominates the UV and optical spectral energy distribution of quasars and Seyfert 1 galaxies no longer dominates (Barvainis, 1987; Kishimoto et al., 2005). At the same time, reprocessed nuclear emission by hot dust starts becoming an important source of continuum emission, mainly from the K-band and longer wavelengths (Barvainis, 1987; Rodríguez-Ardila & Mazzalay, 2006; Glikman et al., 2006). Moreover, because the NIR is less affected by extinction than the optical, the detection of highly reddened objects with buried AGN activity, usually associated to starburst and ultra-luminous infrared galaxies, increases. A better understanding of the AGN-starburst connection can then be made. Last but not least, NIR spectroscopy on AGNs of the local universe allows the construction of spectral templates to study the commonest features and the physical processes that originate them. These templates, in turn, are essential for understands the true nature of high-redshift objects discovered using Spitzer, for instance. In this sense, Glikman et al. (2006) recently published an NIR template for AGNs, made from observations of 27 quasars in the redshift range 0.118 z 0.418. They studied the emission lines in that region, revealing the Pashen series lines, as well as oxygen helium and forbidden sulfur emission.
With the above in mind, here we present the most extensive spectroscopic atlas in the 8000 24000 Å region to date for a sample composed of 47 AGNs in the redshift range 0.0038 z 0.549. It is aimed at constructing a homogeneous database for these objects at good S/N and spectral resolution, allowing the study of the continuum and line emission properties of the individual sources and the comparison of these properties among the different types of AGN. Moreover, most of the sources have no previous spectroscopic information in the literature covering the whole NIR interval. Therefore, this atlas is also intended to fill the existing gap in the SED observations of known sources and at the same time to increase the number of spectral features common to AGN that can be used to put additional constraints on the modelling of the physical properties of the nuclear gas emission.
This paper is structured as follows. In Sect. 2 we describe the sample selection, observations and data reduction process. In Sect. 3 we present the results. Comments about the main features found in the spectra are in Sect. 4. The final remarks are presented in Sect. 5. Throughout the text, a Hubble constant of 75 Mpc will be employed.
2 Observations
2.1 Sample selection
The 47 AGNs that compose our sample are divided into 7 quasars, 13 narrow-line Seyfert 1 galaxies, 12 classical Seyfert 1s, and 15 Seyfert 2s. Note that the above classification was based on published optical spectroscopy of these sources made by different authors. In addition, 4 starburst galaxies were included for comparison purposes, giving a total of 51 spectra available. The dominance of Type 1 objects is not by chance. Originally, we were aimed to select Type 1 objects because most NIR spectroscopy published previously was done on samples dominated by Seyfert 2 galaxies/LINERS (Goodrich et al., 1994; Veilleux et al., 1997; Sosa-Brito et al., 2001) and very little was known about the NIR spectra of Type 1 sources, except probably for those works on some individual sources and for the recent NIR spectroscopy on quasars (Glikman et al., 2006). Moreover, to avoid the effects of strong blending produced by the broad components of the permitted lines that could mask or dilute weak emission lines, emphasis was given to some narrow-line Seyfert 1 galaxies (NLS1). This sub-sample was selected on the basis of their singular behavior in the ultraviolet and/or soft X-ray energy bands. The list of Boller et al. (1996) was used to this purpose. We then increased our sample with classical Seyfert 1 and 2 galaxies. The selection of these objects was based on the CfA sample (Huchra & Burg, 1992). Finally, our list of objects was complemented with quasars selected from the Palomar Bright quasar survey (PG) of Schmidt & Green (1983).
The main criterion in the selection of the final sample was to include, as much as possible, well-known studied sources in the optical/UV and X-ray regions that would allow us to establish correlations between the NIR emission and that in other wavelength intervals. Other criteria, such as the -band magnitude, limited to 12, was also applied in order to keep the exposure time under reasonable values to reach S/N50 in the continuum emission in that band. After compiling a list of 102 AGN that matched the above conditions, objects that have a declination -35o or were already extensively studied in the NIR region, were cut out from the list. The final output was a list of 48 AGNs, plus the additional three starburst galaxies, included for comparison purposes.
Based on the above, although our sample of AGNs is not complete in any sense, we consider it as representative of the class of AGNs in the local universe (most sources have z0.1), because it is composed of well-known and studied objects in other wavelength bands. Note that most of the targets have already been studied in the NIR by imaging techniques.
Columns 2 and 4 of Table A 0.8-2.4 m spectral atlas of active galactic nuclei list the final sample of objects and the corresponding redshift, respectively. The latter value was taken from the NED database and confirmed by the position of the most intense lines in the individual spectra. Errors of less than 1% were found between our redshift determination and that published in the NED.
2.2 Observations and data reduction
The NIR spectra were obtained at the NASA 3 m Infrared Telescope Facility (IRTF) from April/2002 to June/2004. The SpeX spectrograph (Rayner et al., 2003), was used in the short cross-dispersed mode (SXD, 0.82.4 m). A complete journal of observations is in Table A 0.8-2.4 m spectral atlas of active galactic nuclei. The galaxies are listed in order of right ascension. In all cases, the detector employed consisted of a 10241024 ALADDIN 3 InSb array with a spatial scale of 0.15”/pixel. A 0.8”15” slit was employed giving a spectral resolution of 360 . This value was determined both from the arc lamp spectra and the sky line spectra and was found to be constant with wavelength within 3%. During the different nights, the seeing varied between 0.7”1”. Observations were done nodding in an ABBA source pattern with typical integration times from 120 s to 180 s per frame and total on-source integration times between 35 and 50 minutes. Some sources were observed on multiple nights. In these cases, these data were combined, after reduction, to form a single spectrum. During the observations, an A0 V star was observed near each target to provide a telluric standard at similar airmass. It was also used to flux calibrate the corresponding object.
The spectral reduction, extraction and wavelength calibration procedures were performed using SPEXTOOL, the in-house software developed and provided by the SpeX team for the IRTF community (Cushing, Vacca & Rayner, 2004)111SPEXTOOL is available from the IRTF web site at http://irtf.ifa.hawaii.edu/Facility/spex/spex.html. No effort was made to extract spectra at positions different from the nuclear region even though some objects show evidence of extended emission.
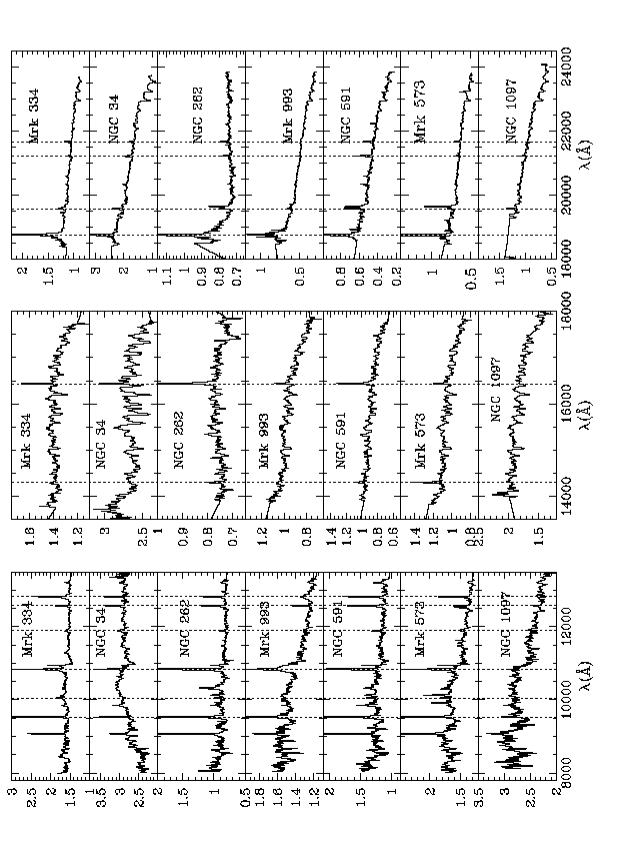
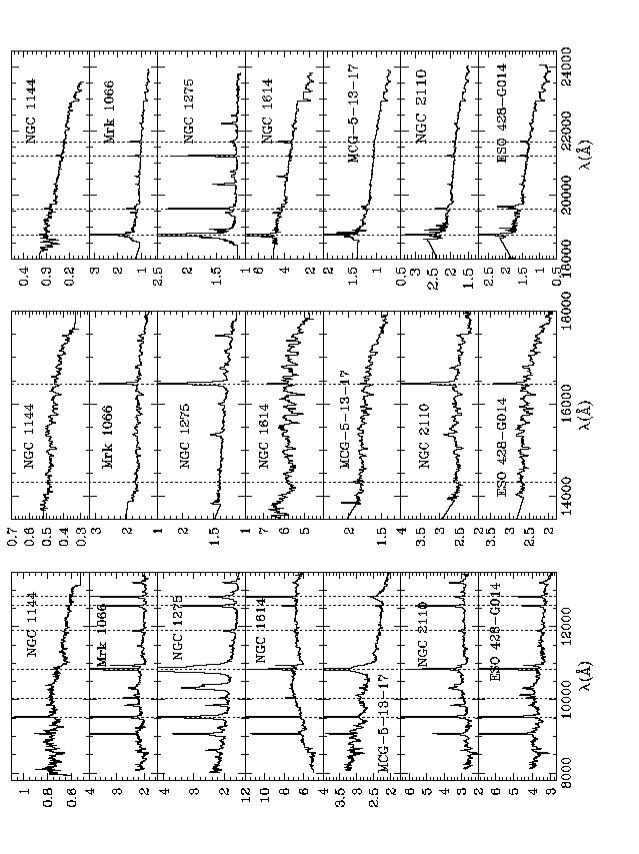
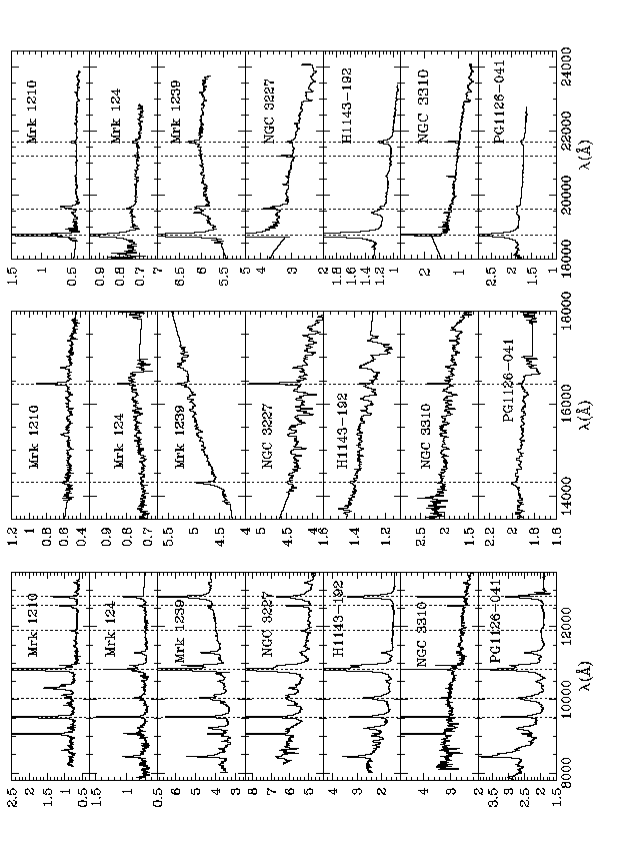
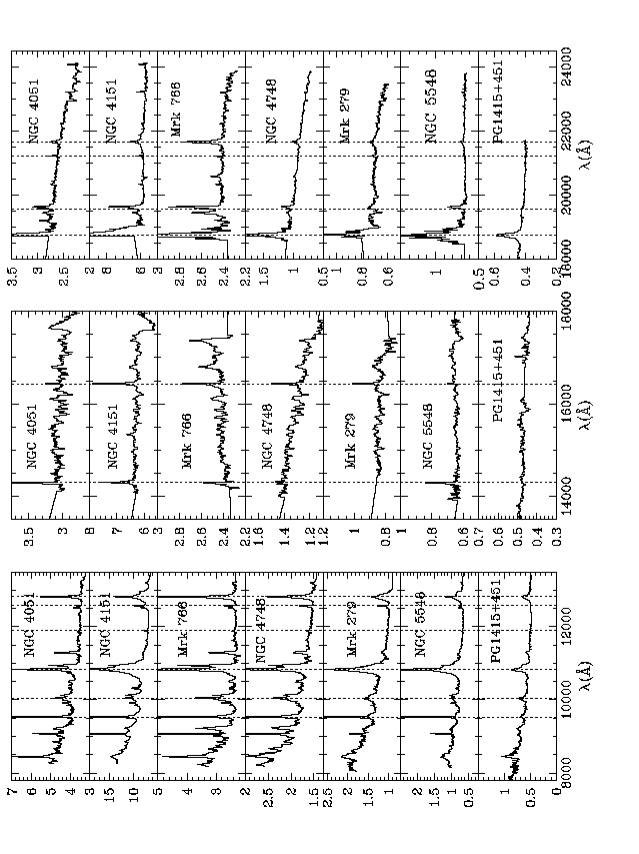
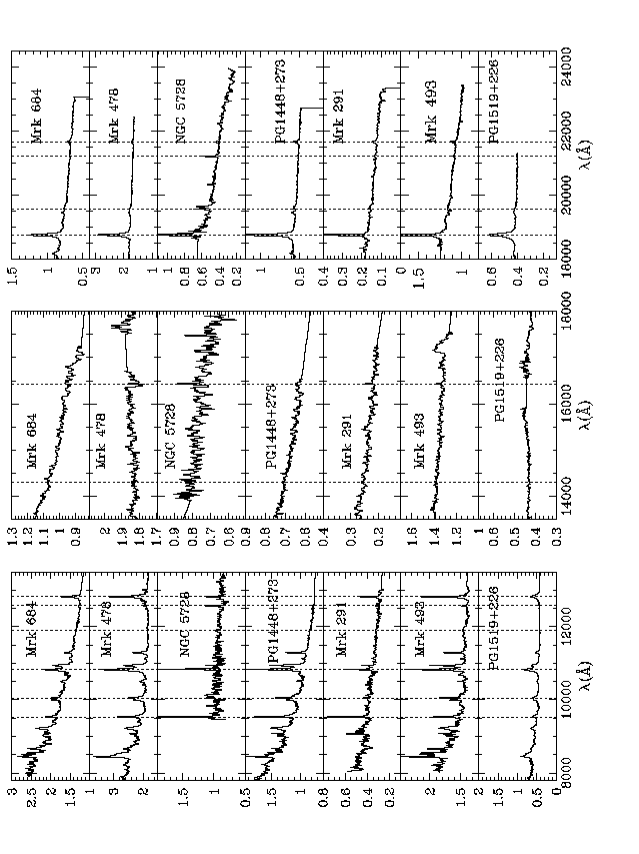
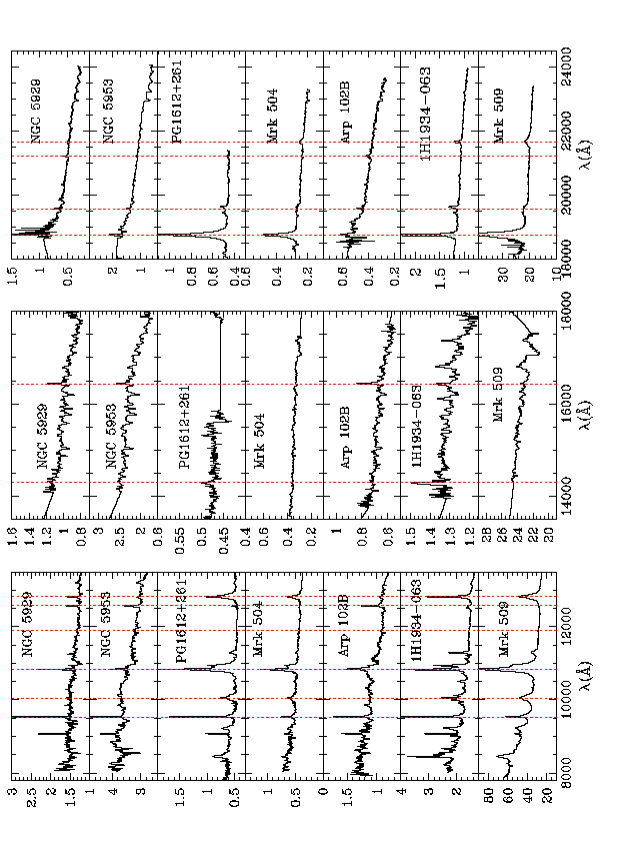
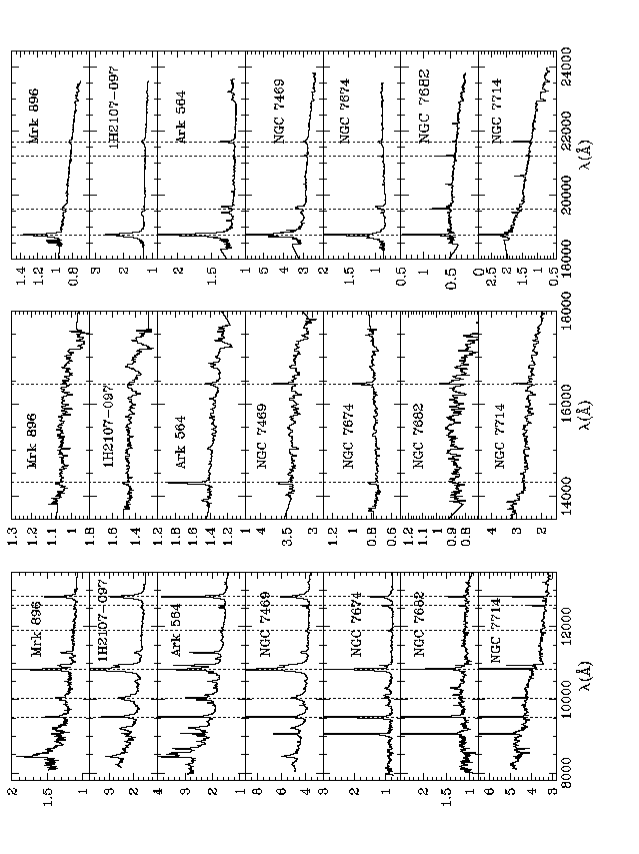
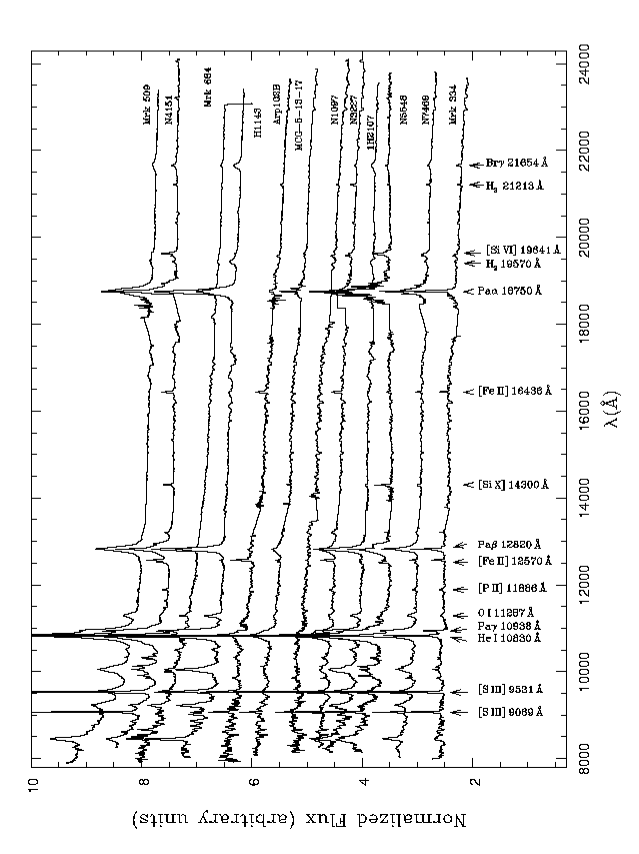
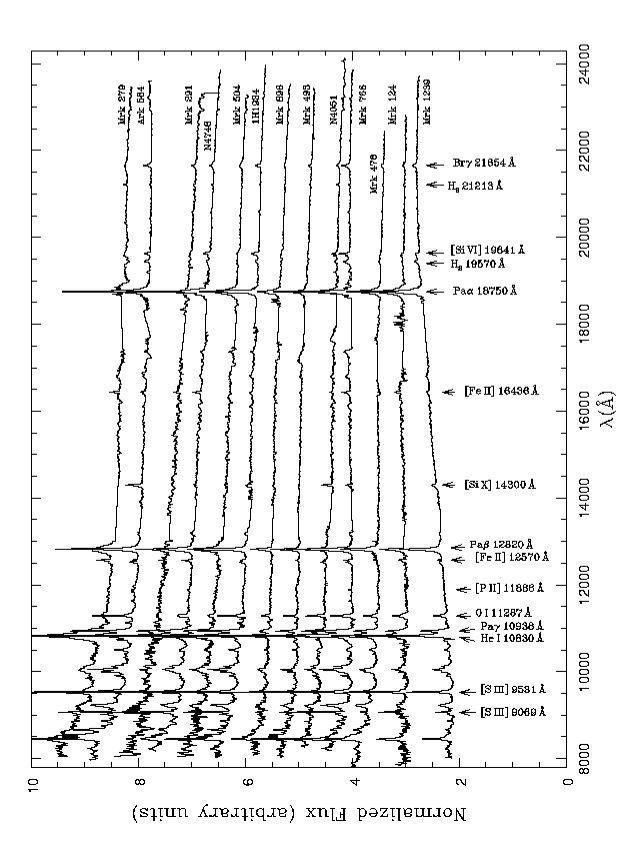
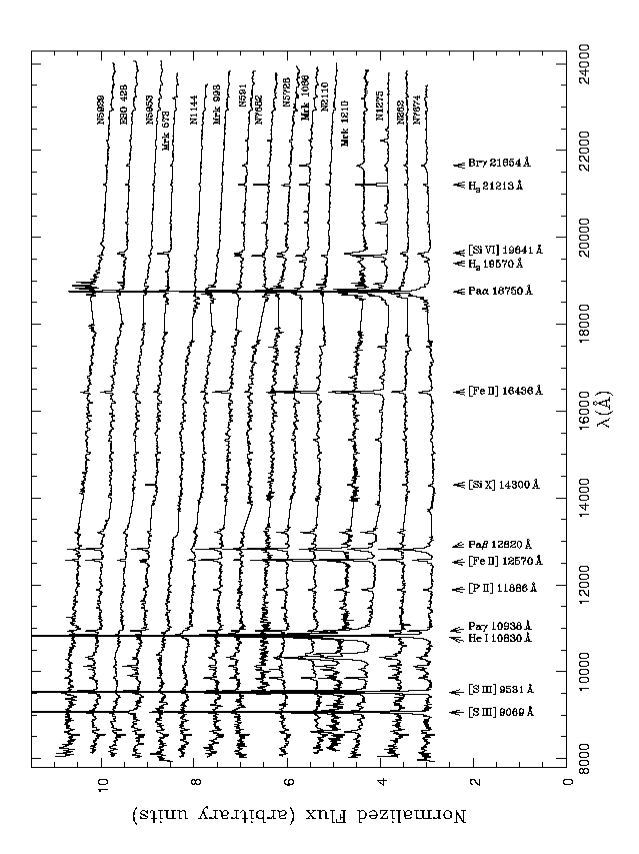
The 1-D spectra were then corrected for telluric absorption and flux calibrated using Xtellcor (Vacca, Cushing & Rayner, 2003), another in-house software developed by the IRTF team. Finally, the different orders of each galaxy spectrum were merged to form a single 1-D frame. It was later corrected for redshift, determined from the average measured from the positions of [S iii] 0.953m, Pa, He i 1.083m, Pa, and Br. A Galactic extinction correction as determined from the COBE/IRAS infrared maps of Schlegel et al. (1998) was applied. The value of the Galactic E(B-V) used for each galaxy is listed in Col. 5 of Table A 0.8-2.4 m spectral atlas of active galactic nuclei. Final reduced spectra in laboratory wavelengths, in the intervals 0.81.35 m (left panels), 1.351.8 m (middle panels), and 1.82.4 m (right panels), are plotted in Figs. 1 to 8. Because the blue region of SpeX includes the wavelength interval 0.8m–1.03m, which does not belong to the standard J-band, in the rest of this text we will refer to that region as the z-band, following the SpeX naming convention of the different orders.
3 Results
3.1 Final Reduced Spectra
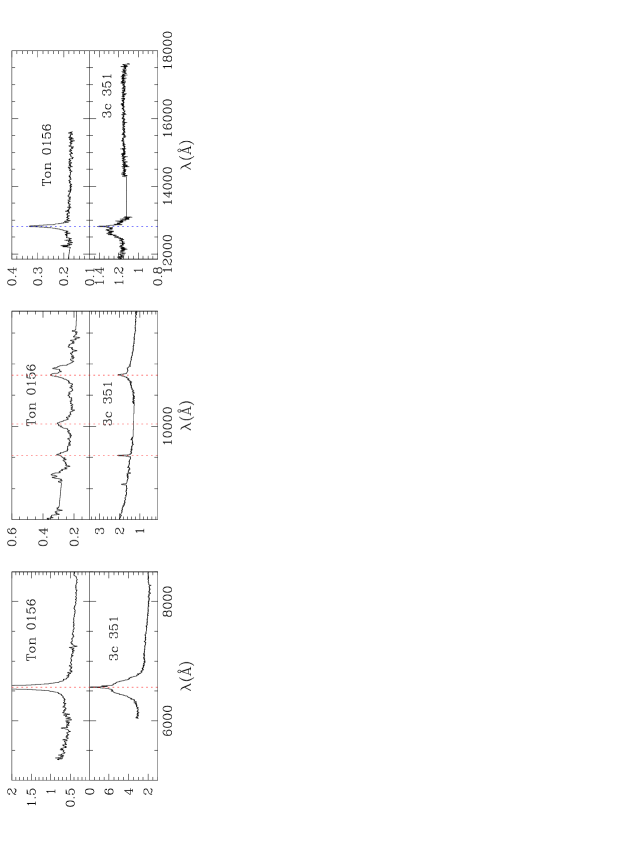
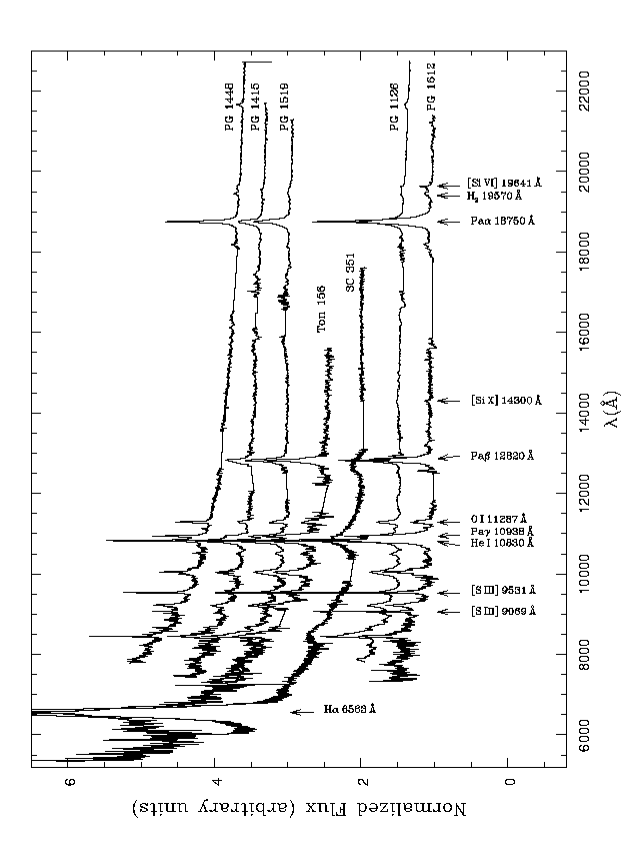
Final reduced spectra are presented from Figs. 1 to 8, sorted in the order of increasing right ascension. For each galaxy, the left panel displays the + bands, the middle panel the band, and the right panel the band. The abscissa represents the monochromatic flux in units of Å-1. For reference, we marked (dotted lines) the brightest emission lines, usually S iii] 9531 , Pa, He i 10830 , [P ii] 11886 , [Fe ii] 12570 , Pa (left panel), [Si x 14300 , [Fe ii] 16436 (middle panel), Pa H2 19570 , H2 21213 , and Br (right panel). The two high redshift sources Ton 0156 and 3C 351 were drawn in a separate panel (Fig. 8) because the blue edge of their spectra starts at 5800 Å, in laboratory wavelengths.
Emission line fluxes for each object of the sample were measured by fitting a Gaussian function to the observed profile and then integrating the flux under the curve. The LINER software (Pogge & Owen, 1993) was used to this purpose. The results are listed in Tables 1 to 4. We consider 3 level errors. For the large majority of our targets, these measurements represent the most complete lists of NIR fluxes made up to date in AGNs. The line fluxes of Mrk 1210 are already reported by Mazzalay & Rodríguez-Ardila (2006) and that of Mrk 766 in Rodríguez-Ardila, Contini & Viegas (2005).
3.2 The continuum spectra
The NIR spectra of AGN have been studied mostly via broad-band photometry. One of the most important results reported is that the continuum shape is correlated with the Seyfert type, in the sense that flatter spectral energy distributions (SEDs) tend to be found in Sy 1’s and steeper ones in Sy 2’s, in accordance with the unified model (e.g Alonso-Herrero et al., 2003, 2001, and references therein). However, no systematic study of the continuum characteristics in a representative sample of AGN have been made yet by means of spectroscopy. Previous works, concentrated on individual or on a small sample of objects, report a continuum described well by a broken power-law, with a flattening of the continuum slope at 1.1m (Thompson, 1995, 1996; Rudy et al., 2000, 2001; Rodríguez-Ardila et al., 2002a). It means that there would be a minimum in the continuum emission around 1.1m, probably associated to the red end of the optical power-law distribution associated to the central engine and the onset of the emission due to reprocessed nuclear radiation by dust (Barvainis, 1987; Rudy et al., 2000). Boisson et al. (2002), in a H-band spectroscopic study of 5 AGN, report that the Sy 2 nuclear spectra are dominated by stars, while evidence for dilution of the nuclear stellar components by hot dust and/or power-law AGN are found in Sy 1.
From what is said above, the main goal of this section is to characterize the NIR continuum observed in our sample and compare it to the different types of AGNs and to other data in the literature. To this purpose we normalized to unity the continuum emission of all spectra at 12230 , except for quasars, where the normalization was done at 11800 . The region around these two positions are free of emission lines. The normalization point for quasars is different than for the other objects because in the former, after the spectra are converted to rest frame, the first position falls in a region of bad atmospheric transmission. In order to help in the comparison, we grouped the spectra according to the type of nuclear activity. For each type of AGN, the data were sorted according to the spectral shape, from the bluest ones (top) to the reddest ones (bottom). These plots are shown from Figs. 9 to 13.
Overall, it is easy to see from the normalized spectra (Figs. 10 to 13) that the continuum shape of quasars, NLS1s and Sy 1’s are rather similar in the H and K-bands, where it is essentially flat or decreases smoothly in flux with wavelength. In contrast, in the + bands, the continuum shape varies from that which remains nearly flat, as in Mrk 334 and Mrk 124, to that displaying a strong blue continuum from 1.2m bluewards, as is the case for most quasars, such as Mrk 509 and NGC 4151. In most cases, it seems to be a break in the continuum form at 1.1m. At first sight, when looking at the nearby sources, one is tempted to state that the blue NIR excess is very similar in form and strength to the so called small blue bump (SBB) that is usually observed from 4000 Å bluewards in the optical spectra of Seyfert 1 galaxies and quasars. The SBB, modelled in detailed by Wills et al. (1985), was described in terms of Fe ii, Mg ii, and high-order Balmer lines and the Balmer continuum. However, the blue end of the NIR region does not contain that large number of Fe ii emission features, as in the optical, able to create an excess of emission over the underlying continuum. Likely, the Pashen continuum and high-order Pashen lines can contribute to the NIR bump.
The quasars Ton 156 and 3C 351, which at rest wavelengths include a large portion of the optical region in the z-band, provide us with important clues for studying the actual shape and extension of the blue NIR excess. Clearly, the continuum emission in these two high-redshift sources decreases steadily in flux with wavelength with no appreciable change in the steepness from the optical up to 1.2m, where a clear break in the continuum shape is observed, then becoming flat redwards. This situation can be easily extended to the nearby sources, as the location of the turnover point is rather similar in most objects, being the steepness in the blue continuum the only difference among the different objects. This confirms that the break at 1.1m is a common characteristic of Type 1 sources. What we have called the “blue NIR excess” could simply be the red end of the continuation of the power-law optical continuum typical of Type 1 sources for the NIR. Our results agrees with the findings of Glikman et al. (2006), who report a broken power-law function in the interval 0.57m–2.23m with the breaking point at 1.085m, to describe the continuum of a NIR composite quasar spectrum. We should add here that Type 1 sources display a nearly featureless continuum in the NIR, with only a few sources showing absorption features. In only a few sources, the 2.3m CO bandheads are relatively prominent. Arp 102B and NGC 1097, which were classified as Seyfert 1s because of their broad double-peaked Balmer lines, are among the Type 1 sources with conspicuous stellar features. CO absorption lines are also seen in the H-band, with equivalent widths of just a few Angstroms.
The exception to all the trends for Seyfert 1 galaxies mentioned above is Mrk 1239, whose continuum emission is outstanding because it is dominated by a strong bump of emission peaking at 2.2 m, with a strength not reported before in an AGN. In this object, the continuum does not becomes flatter at 1.1m, as in most Seyfert 1s but rather steep, reaching a maximum of emission at 2.2 m and then declining again in flux with wavelength. This extreme case was the subject of a separate publication by Rodríguez-Ardila & Mazzalay (2006). They found that a blackbody of T1200 K was needed to account for the strong excess of emission over a featureless continuum wich a power-law form. The blackbody component was interpreted in terms of very hot dust (=1200 K) near its sublimation temperature, very likely located both in the upper layers of torus and close to the apex of a hypothetical polar scattering region in this object. It is worth mentioning that Mrk 766 and Mrk 478 display an emission bump similar in form to that of Mrk 1239, although wich much lower intensity.
In contrast to Seyfert 1 galaxies, none of our Seyfert 2s display the blue rise of the continuum shortward of 1.1 m. Moreover, all objects show prominent absorption lines and bands in H and K. Indeed, the 2.3 m CO bandheads are present in all sources but NGC 1275 and NGC 262. In J, most Seyfert 2s display an absorption band at 1.1 m, not reported before in AGNs, and these we tentatively associated with CN (Maraston, 2005). According to Maraston (2005), that band, prominent in the NIR region, is indicative of thermal-pulsing AGB stars with ages 1 Gyr. The association of young stellar population and the CN feature can be strengthened if we consider that the three starburst galaxies of the sample display this absorption (see below). The contribution of stellar population to the observed continuum is further supported by the detection of CaII triplet absorption features in the large majority of these objects.
Overall, the continuum emission of Type 2 objects can be divided into two groups based on its shape: one that decreases in flux with wavelength across the NIR and that can in a first approach be approximated by a power-law function. Twelve out of 16 Seyfert 2s belong to this category. Another is dominated by a red continuum, with the flux increasing with wavelength up to 1.2 m. From that point redwards, the flux decreases with wavelength. Two objects, namely Mrk 1066 and NGC 2110, share these characteristics. At this point we should comment on the continuum in NGC 7674, which does not fit in any of the above two categories. From 0.8 m up to 1.4 m, the continuum decreases in flux with wavelength as in most Seyferts 2s. In H and K, however, it displays a clear excess of emission, similar to that reported for Mrk 1239. It should also be noted that, although NGC 7674 is classified as a Seyfert 2 from its optical spectrum, in the NIR region it displays broad emission components in the permitted lines, similar to what is observed in classical Seyfert 1s.
Finally, the continuum emission of the Starburst galaxies, from 1.3 m redwards, is rather similar for the three objects analyzed, decreasing smoothly in flux with wavelength. For NGC 3310 and NGC 7714, this same behavior is found in the blue portion of the spectrum. No upturns or breaks are found in the NIR. In contrast, the continuum in NGC 1614, is strongly reddened in the interval 0.8 m–1.2 m, becoming flat in the region between 1.2 m–1.3 m. Also, this source displays the most prominent absorption lines of the three galaxies. The CN absorption feature at 1.1 m is also conspicuous in the three objects. The detection of this feature in the spectra of Seyfert 2 galaxies that display prominent circumnuclear starburst activity, such as Mrk 1066, suggest that it can be a useful tracer of young stellar populations.
We conclude this section by noting that the continuum in the NIR displays significant differences between Type 1 and Type 2 sources. In the former, the continuum can be characterized by a broken power-law, with the break located almost invariably at 1.1 m. Shortwards to the break, the continuum is blue, and its steepness can be associated to the spectral index of the power-law that dominates the optical continuum emission. Redwards, the continuum is rather flat or else displays a smooth decrease in flux with wavelength. Overall, the composite power-law continuum is featureless, although absorption lines can be identified in some sources. The continuum emission of Type 2 sources, on the other hand, can be grouped into two classes: one that follows a single power-law function across the NIR and another displaying a red spectrum bluewards of 1.2 m and then decreasing steeply in flux with wavelength. The objects in the latter category display prominent absorption bands of CO and CN. They likely are dominated by circumnuclear starburst activity as told from the similarity with the spectra of genuine starburst galaxies. A quantitative approach of the analysis of the continuum emission is beyond the scope of this paper, but is left for a future publication.
3.3 The NIR emission line spectrum
The 51 NIR spectra presented in this work offer a prime opportunity for identify the most common emission features found in AGNs in a region not yet observed in such details. For completeness, the emission line fluxes of these lines, listed in Tables 1 to 4, form the largest and most complete database in the interval 0.8m–2.4m published so far for these objects.
From our data, it is easy to see that, independent of the Seyfert class, NIR AGN spectra are dominated by strong emission features of H i, He i, He ii, and [S iii]. Moreover, conspicuous forbidden low-ionization lines of ions such as [Fe ii], [S ii], and [C i], as well as molecular H2 lines are detected in the large majority of objects. Also detected in an important fraction of the targets are coronal lines of [S viii], [S ix], [Si vi], [Si x], and [Ca viii]. This set of lines need ionization energies of up to 360 eV for the production of the parent ion. Their detection is considered an unambiguous signature of nuclear activity, and it increases the number of coronal line species available to study the origin, location, and physical conditions of the gas that emits them. Overall, the fluxes listed in Tables 1 to 4 can be use to add firm constraints to model the physical state of the emission gas, both from the broad line and narrow line regions.
In this section we will describe the commonest NIR emission lines detected in the galaxy sample according to the Seyfert type. To start with, and summarizing what is said in the paragraph above, Figure 14 shows the frequency with which the most important NIR emission lines appear in the different spectra. A detailed discussion of the main spectral characteristics observed in each source can be found in Sec. 4.

3.3.1 Seyfert 1 galaxies
According to Osterbrock (1989), the emission-line spectrum of Seyfert 1 galaxies is characterized by permitted broad H i, He i and He ii lines, with FWHM of order of 5000 km s-1, and narrow permitted and forbidden emission lines with FWHMs of 500 km s-1. Lines with similar characteristics are also observed in the NIR, as can be seen in Fig. 15 and Fig. 9.
We found that the forbidden [S iii] 9069, 9531 lines are present in all the Sy 1 galaxies of our sample. The permitted He i 10830 Å line is detected in 91% of the sources. H i emission lines such as Pa, Pa, Pa and Br are common to 83% of the spectra. Moreover, exclusive BLR signatures like the Fe ii and O i lines were detected in in 67% of the Sy 1 galaxies. Forbidden low ionization species were also detected in the Sy 1 spectra. The commonest are [Fe ii] 12570, 16436 , which are present in 67% of the galaxies. Mrk 334, NGC 7469, NGC 3227 and NGC 4151 display [P ii] 11886 line, corresponding to 33% of the Sy 1 sample. The carbon emisson line [C i] 9850 Å is identified in 50% of the sources. The molecular H2 2.121 m line is observed in 75% of the objects. Finally, the coronal line [Si vi] 19641 is present in 50% of the galaxies, while [Si x] 14300 Å is common in 42% of the objects.

3.3.2 Narrow-line Seyfert 1 galaxies
The Narrow-line Seyfert 1 galaxies are a peculiar group of Sy 1 sources first identified by Osterbrock & Pogge (1985). Among other properties, they are characterized by optical spectra displaying broad permitted lines with FWHM 2000 and strong Fe ii emission. Our NLS1 subsample of objects, composed of 13 galaxies, is the largest set of AGN belonging to this category already observed in the NIR region and published in the literature, allowing the study of the most important emission features detected in their spectrum. Moreover, our NLS1 list is composed of well-studied objects in other spectral regions.
As can be observed in Figs. 15 and 10, the most conspicuous emission lines identified in the spectra are the first three lines of the Pashen series (Pa, Pa, and Pa) and the He i 10830 Å line, all of which are observed in all objects. In addition, exclusive BLR features of O i, Fe ii, and Ca ii, free from contamination of the NLR, are common to all the NLS1 galaxies. The presence of these three features, in particular Fe ii, represents a firm advantage of the NIR region compared to the optical in the study of that emission. The large number of Fe ii multiplets and its proximity in wavelength in the optical leads to the formation of a pseudo-continuum that usually hampers the detection of individual Fe ii lines, even in NLS1. In the NIR, the larger separation in wavelength among the different Fe ii multiples in combination with the small FWHM of broad features displayed by NLS1 allows the identification of iron lines that put firm constraints on the mechanisms that creates them. This is the case, for example, for the Fe ii lines located in the 9200 Å region, detected in the majority of the NLS1 sources (see Tables 1 to 2), and these are considered as primary cascading lines following Ly fluorescence (Sigut & Pradhan, 1998, 2003).
Aside from the lines mentioned above, the forbidden [S iii] 9531 Å line is also detected in all the NLS1 galaxies. Other conspicuous features, such as [Fe ii] and molecular hydrogen, are found in 85% and 92% of the galaxies, respectively. Three of the NLS1s, (Ark 564, 1H1934-063, and Mrk 766), display [P ii] 11460,11886 lines representing 23% of the sample. The forbidden [C i] 9850 line is clearly identified in 54% of the objects. As in the Sy 1 galaxies, the coronal lines [Si x] 14300 and [Si vi] 19641 are observed in 38% of the sample.
3.3.3 Quasi stellar objects
Overall, the emission line spectrum of quasars are similar to that of Seyfert 1s and NLS1s (see Fig. 11). The only appreciable difference is in the intensity of the forbidden lines, which are weak or absent in a large fraction of the objects studied. It must be recalled, however, that the small number of targets (7) only allow us to establish trends about the frequency of the most important emission features. The advantage here is that our statistics can be compared with the results found by Glikman et al. (2006), who studied a larger sample of quasars in the NIR. We recall that the Glikman et al. sample is composed of more distant quasars than ours.
As expected, the NIR spectrum of quasars is dominated by broad permitted lines of H i, He i 1.083 m, O i, and Fe ii. These features are identified in all objects except in 3C 351, which lacks Fe ii. This can be a dilution effect if we consider that 3C 351 displays extremely broad permitted lines, with FHWM reaching 12000 . Any weak-to-moderate Fe ii emission that broad would either be diluted in the continuum or heavily blended with nearby features turning them very difficult to isolate and identify. The lack of Fe ii can also be explained on physical grounds. It is well known from the work of Boroson & Green (1992) that steep radio sources display weak or no Fe ii emission and that would be the case of 3C 351.
Regarding the detection of signatures revealing the presence of a NLR, it is interesting to note that the forbidden [S iii] 9069, 9531 is found in all quasars. In addition, [C i] is clearly identified in 57% of the objects. The high ionization line [Si x] 14300 is detected in two sources (PG 1612 and PG 1126), representing a frequency of 28%. [Si vi] 19641 is the commonest coronal line. It was detected in 43% of the objects. Similarly, molecular hydrogen is clearly present in PG 1448, PG 1612, and PG 1126, corresponding to 43% of the galaxies. We should note that the spectra of the high redshift QSOs, Ton 0156 and 3C 351, display the presence of H. The measured line fluxes of these two objects are presented in Table 6.
Our results agree very closely with those reported by Glikman et al. (2006). The only lines that appear in our data, but seems to be missed in their composite quasar spectrum correspond to the [C i] and the coronal lines. This, however, needs to be looked at with caution because the spectrum that they present corresponds to a composite one instead of individual sources.
| Ion | Ton 0156 | 3C 351 | Ion | Ton 0156 | 3C 351 | ||
| H i | 6563 | 200.122.11 | 935.0424.70δ | H i | 10049 | 11.041.13 | - |
| O i+Ca ii | 8486 | 8.572.14 | 72.114.16 | Fe ii | 10500 | 1.870.45 | - |
| S iii | 9069 | - | 4.220.16 | He ii | 10830 | 16.421.03 | 52.013.40 |
| S iii | 9531 | - | 11.330.43 | H i | 10938 | 9.590.70 | 18.743.37 |
| Fe ii | 9127 | 0.570.14 | - | O i | 11287 | 2.530.63 | |
| Fe ii | 9177 | 1.050.26 | - | H i | 12820 | 14.160.79 | 22.094.85 |
| Blend with [N ii] 6548 and [N ii] 6583. | |||||||
3.3.4 Seyfert 2 galaxies
The spectrum of Sy 2 galaxies is dominated by strong emission features of permitted and forbidden lines, with FWHM rarely exceeding 600 . By far, the strongest emission lines observed are [S iii] 9531 and He i 1.083 m, detected in allmost all the sources (see Figs. 15 and 12). Permitted H i is clearly identified in 87% of the objects. Low ionization lines of [Fe ii] and molecular H2 are found in all spectra. Phosphorus and carbon are also identified. At least one of the phosphorus forbidden transitions either [P ii] 11460 or [P ii] 11886 is detected in 60% of the Sy 2 sample. [C i] is detected in 67% of the Sy 2s. Forbidden high ionization lines are also detected. The [Si x] 14300 line is common to 40% of the objects, and the [Si vi] 19641 line is found in 60% of the spectra. Broad permitted lines of H i were found in NGC 7674 and Mrk 993, leading us to consider that they are obscured Seyfert 1 objects. Both sources display broad emission lines in polarized lines (Miller & Goodrich, 1990).
3.3.5 Starburst galaxies
For comparison purposes, four starburst galaxies, namely NGC 34, NGC 1614, NGC 3310, and NGC 7714 were include in our survey, been the last three genuine SB, while NGC 34 has an ambiguous classification (see Sect. 4). Their spectra are dominated by unresolved permitted lines of Pa, Pa, Pa, Br and He i 10830 (see Fig. 13). The forbidden emission lines of [S iii] 9069, 9531 , and [Fe ii] 12570, 16436 are also conspicuous in the three objects. molecular hydrogen lines are clearly visible in the data. No high ionization lines were found. All three objects display a remarkably similar emission line spectrum, nearly indistinguishable from each other. The continuum emission is different in NGC 1614 and NGC 34.
3.4 Reddening in Seyfert galaxies by means of NIR line ratios
The flux ratios between hydrogen emission lines are very often used as diagnostics of the reddening affecting the emitting gas of an AGN. This approach, however, is subject to large uncertainties when trying to determine the extinction in Type 1 sources, either because the H i lines are strongly blended with nearby features, as in classical Seyfert 1, or because of the intrinsic difficulties in deblending the contribution from the NLR and the BLR in NLS1s. Another major problem is the fact that the intrinsic line ratios may depart significantly from Case B because of the high-density environment of the BLR and radiation transfer effects (Collin-Souffrin, Dumont & Tully, 1982; Osterbrock, 1989). The alternative is to use forbidden line ratios, but this method is very limited because the lines involved need to be from the same ion, have a large separation in wavelength, and must share the same upper limit, so that the line ratio is insensitive to the temperature over a wide range of densities been only function of the transition probabilities.
For all the above, the NIR region opens a new window to explore this issue. First, observational studies based on small samples of objects indicate that the line ratios of Pa/Br are not only comparable in both BLR and NLR but also consistent with Case B recombination, confirming that this ratio is less affected by collisional effects than by optical lines (Rhee & Larkin, 2000), which is expected because the NIR lines have smaller optical depths. Second, suitable pairs of forbidden lines can be found, allowing an alternative route for determining the extinction, as is the case of [Fe ii] lines at 1.257 m and 1.643 m (see, for example, Rodríguez-Ardila et al., 2004).
In order to see if the reddening determined by means of the H i line ratios and that found from the [Fe ii] are similar, we have plotted the ratios Br/Pa vs [Fe ii] 1.2m/1.6m in Fig. 16. In the calculation, we assumed that the intrinsic ratios are 0.17 and 1.33, respectively (Hummer & Storey, 1987; Bautista & Pradhan, 1998). Note that for Seyfert 1 galaxies, we used the total flux of the lines to avoid uncertainties introduced in the deblending of the broad and narrow components, mainly in the NLS1. The dashed line corresponds to a reddening sequence, from E(B-V)=0 (diamond with arrow) up to E(B-V)=2, in steps of E(B-V)=0.5 mag. The Cardelli, Clayton & Mathis (1989) [CCM] reddening law was employed for this purpose.
A first inspection on Fig. 16 shows that Seyfert 2s tend to have a much narrower distribution in the [Fe ii] flux ratio than do Seyfert 1s. Also, Seyfert 2s tend to lie close to the locus of points of the reddening curve, with E(B-V) in the interval 0.25-1 mag, implying that the regions emitting the H i and [Fe ii] lines are affected by similar amounts of extinction. Seyfert 1s, in contrast, appear to be divided into two groups. One is populated predominantly by broad-line Seyfert 1s, which display extinction values near to zero for both ratios, and the second group, composed mostly of NLS1s, displays high values of extinction for the [Fe ii] gas but close to zero for the H i region. Moreover, a few Seyfert 1s have lower Br/Pa ratios than the intrinsic Case B.
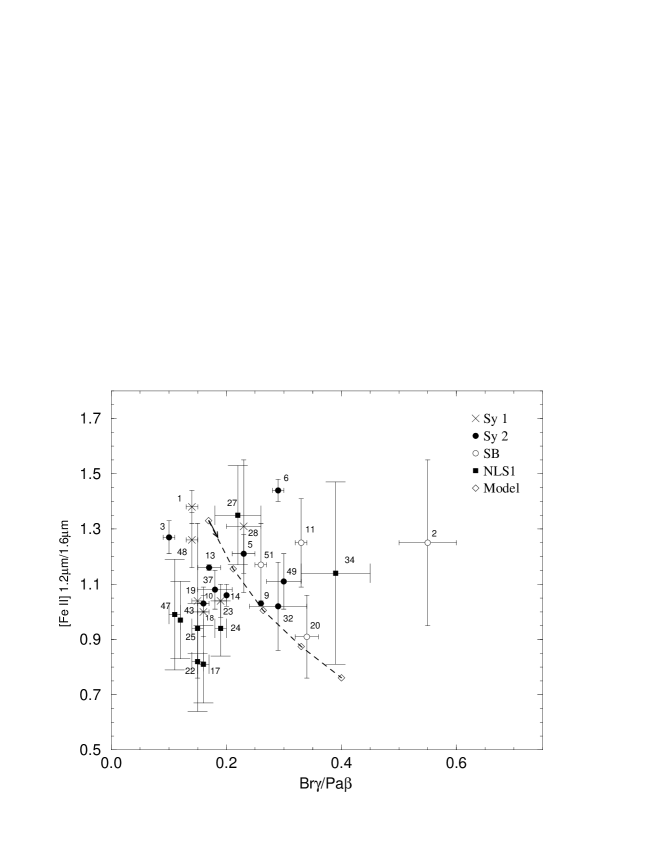
Keeping in mind that the total flux of the Br and Pa lines plotted in Fig. 16 for the Seyfert 1s is likely to be dominated by the one emitted by the BLR component, we propose that the lack of significant reddening for the H i gas in these objects can be explained if Case B intrinsic values are ruled out for the NIR lines, as happens in the optical region. Density and radiation transport effects modify them so that they are not a reliable source of information for the reddening. The alternative is that the region emitting the H i lines, particularly the BLR, is little or not affected by dust. This hypothesis is highly plausible, as the environment of the BLR is rather turbulent and very close to the central source making the environment unfavorable for dust grain survival.
In Sect. 3.2 we already noted that the NIR continuum within the same type of AGN was rather homogeneous, particularly in the H and K-bands, being the major appreciable difference the steepness of the continuum in the + band. Is that steepness related to a measurable parameter such as extinction? In order to investigate if such a relationship can be established, we plotted in Fig. 17 the reddening indicators (top) and [Fe ii] 12570/16436 (bottom) vs NIR color indices derived from the flux ratio of continuum emission integrated in windows of 100 Å. The regions chosen for integration are free of line emission contribution and are meant to be representative of the form of the continuum across the NIR region. The measured continuum fluxes are presented in Table 7.
As reference, we compared the observed ratios in Fig. 17 with two reddening sequences: one that starts from points representing the intrinsic values of the line ratios ( and [Fe ii] 12570/16436) and the dereddened continuum ratios taken from the SB galaxy NGC 3310, assumed to be representative of a continuum typical of a young stellar population. The value of E(B-V) for the deredening was taken from Rodríguez-Ardila, Riffel & Pastoriza (2005). For this object, the dereddened continuum was then reddened in steps of E(B-V)=0.5 mag (Mod. SB, filled triangles joined by a dashed line) up to a E(B-V)=2 mag. The CCM reddening law was employed. We also plot a reddening sequence for the Type 1 galaxies in Fig. 17 (open triangles connected by a solid line, Mod. Sy 1), using as zero points in the abscissa axis the continuum ratios measured in Mrk 493, an NLS1 galaxy whose continuum is considered to be affected by extinction and stellar population very little or not at all (see for example Crenshaw at el., 2002).
A first inspection to the two upper panels of Fig. 17 allows us to state that H i ratios constrain the reddening in Seyfert 1 objects poorly, while they are useful diagnostics for Seyfert 2 galaxies. This conclusion is based on the fact that the former type of objects are concentrated in the region close to the point corresponding to E(B-V)=0. The two upper plots also confirm that the continuum emission of Seyfert 1s is rather homogeneous from object to object as the ratio between the continuum and line emission display little scatter. In contrast, Seyfert 2 seems to be divided into two groups. One follows the theoretical reddening curve, suggesting that their continuum emission can be reproduced by means of a reddened starburst component, and another whose H i ratios and continuum emission seem to be dominated by emission from the central engine, as these objects share similar continuum and emission line ratios of Seyfert 1s. The two outliers, identified with the numbers 2 (NGC 34) and 34 (Mrk 291), may represent extreme cases of highly reddened sources. For instance, NGC 34 is a luminous infrared galaxy with strong water megamaser emission, suggesting both strong thermal emission by dust and starburst activity. Mrk 291 is a NLS1 galaxy whose emission line spectrum is closer to that of a Seyfert 2.
The two lower panels of Fig. 17, which involves the reddening sensitive line ratio [Fe ii] 12570/16436, confirm that an important fraction of the Seyfert 2s of our sample display a continuum emission that is dominated by reddened stellar emission, most likely emitted by circumnuclear starburst activity. The [Fe ii] provides a reliable measurement of the NLR extinction, as most points are close to the reddening sequence. Seyfert 1 galaxies display a large scatter in reddening for the NLR (measured through the [Fe ii] ratio), although the slope of the continuum emission varies little. It means that the continuum emission it little or not affected by dust. The fact that some Seyfert 1s display continuum flux ratios compatible with a highly reddened starburst component may be artificial. Rather, these objects can have an important stellar contribution to the observed continuum emission, where part of the [Fe ii] may be emitted.
Overall, the panels shown in Fig. 17 reveal the complex nature of the NIR continuum in AGNs, but proves to be useful in detecting objects with important starburst activity. Moreover, they show that there are strong differences in the form of the NIR continuum emission between Seyfert 1s and 2s objects.

| Cont. range | Cont. range | Cont. range | Cont. range | |
|---|---|---|---|---|
| Source | 9700-9800 | 12230-12330 | 16600-16700 | 20900-21000 |
| Mrk 334 | 1.56 | 1.52 | 1.35 | 1.09 |
| NGC 34 | 2.82 | 2.91 | 2.60 | 1.78 |
| NGC 262 | 0.86 | 0.81 | 0.76 | 0.73 |
| Mrk 993 | 1.46 | 1.26 | 0.91 | 0.51 |
| NGC 591 | 1.21 | 1.12 | 0.83 | 0.47 |
| Mrk 573 | 1.61 | 1.39 | 1.00 | 0.66 |
| NGC 1097 | 2.73 | 2.38 | 1.76 | 1.05 |
| NGC 1144 | 0.74 | 0.63 | 0.43 | 0.24 |
| Mrk 1066 | 2.14 | 2.01 | 1.58 | 1.05 |
| NGC 1275 | 1.88 | 1.58 | 1.32 | 1.14 |
| NGC 1614 | 6.41 | 6.84 | 5.57 | 3.67 |
| MCG-5-13-17 | 2.75 | 2.29 | 1.69 | 1.08 |
| NGC 2110 | 2.69 | 2.83 | 2.54 | 1.91 |
| ESO 428-G014 | 3.72 | 3.39 | 2.48 | 1.40 |
| Mrk 1210 | 0.76 | 0.65 | 0.54 | 0.42 |
| Mrk 124 | 0.68 | 0.70 | 0.76 | 0.71 |
| Mrk 1239 | 3.32 | 4.05 | 5.11 | 5.99 |
| NGC 3227 | 5.39 | 4.95 | 4.16 | 3.02 |
| H1143-192 | 1.68 | 1.49 | 1.25 | 1.05 |
| NGC 3310 | 2.98 | 2.60 | 1.85 | 1.06 |
| PG1126-041 | 1.94 | 1.89 | 1.80 | 1.72 |
| NGC 4051 | 3.89 | 3.51 | 2.98 | 2.63 |
| NGC 4151 | 8.69 | 6.90 | 6.22 | 5.83 |
| Mrk 766 | 2.35 | 2.32 | 2.42 | 2.41 |
| NGC 4748 | 1.76 | 1.54 | 1.23 | 0.93 |
| Ton 0156 | 0.23 | 0.18 | - | - |
| Mrk 279 | 1.32 | 0.98 | 0.82 | 0.70 |
| NGC 5548 | 0.78 | 0.66 | 0.65 | 0.65 |
| PG1415+451 | 0.59 | 0.49 | 0.46 | 0.40 |
| Mrk 0684 | 1.76 | 1.28 | 0.93 | 0.69 |
| Mrk 478 | 1.92 | 1.82 | 1.85 | 1.69 |
| NGC 5728 | 0.95 | 0.91 | 0.72 | 0.44 |
| PG 1448+273 | 1.05 | 0.78 | 0.61 | 0.52 |
| Mrk 291 | 0.40 | 0.30 | 0.21 | 0.13 |
| Mrk 493 | 1.46 | 1.37 | 1.31 | 1.09 |
| PG 1519+226 | 0.46 | 0.43 | 0.44 | 0.40 |
| NGC 5929 | 1.50 | 1.27 | 0.94 | 0.51 |
| NGC 5953 | 3.60 | 3.13 | 2.17 | 1.16 |
| PG 1612+261 | 0.48 | 0.45 | 0.46 | 0.45 |
| Mrk 504 | 0.50 | 0.41 | 0.32 | 0.24 |
| 3C 351 | 1.36 | 1.16 | 1.15 | - |
| Arp 102B | 1.10 | 0.90 | 0.64 | 0.39 |
| 1H 1934-063 | 1.71 | 1.50 | 1.27 | 1.07 |
| Mrk 509 | 35.80 | 27.31 | 22.58 | 20.24 |
| Mrk 896 | 1.20 | 1.10 | 1.01 | 0.84 |
| 1H2107-097 | 1.81 | 1.60 | 1.37 | 1.25 |
| Ark 564 | 1.90 | 1.54 | 1.30 | 1.16 |
| NGC 7469 | 3.88 | 3.67 | 3.29 | 2.81 |
| NGC 7674 | 10.52 | 14.51 | 19.83 | 24.52 |
| NGC 7682 | 1.13 | 1.08 | 0.82 | 0.44 |
| NGC 7714 | 4.27 | 3.40 | 2.38 | 1.33 |
4 Notes on individual objects
In this section we describe the most important spectral features found in the AGN sample. It is motivated by the fact that for a large fraction of objects (44/51), no previous NIR spectra covering the JHK bands simultaneously are available in the literature. In fact, only NGC 4151 (Thompson, 1995), Mrk 478 (Rudy et al., 2001), Ark564 (Rodríguez-Ardila et al., 2002a, c), 1H1934-063 (Rodríguez-Ardila et al., 2000, 2002a) , Mrk766 (Rodríguez-Ardila, Contini & Viegas, 2005), Mrk 1210 (Mazzalay & Rodríguez-Ardila, 2006), and Mrk1239 (Rodríguez-Ardila & Mazzalay, 2006) have been observed before in this interval.
-
•
Mrk 334. This Seyfert galaxy from the CfA catalog, classified as 1.8, is located in an interacting system in an advanced stage of merger. It has a tidal arm visible in both the and images (Martini et al., 2001). The HST images in the F606W filter reported by Pogge & Martini (2002) reveal knots of emission quite near the nucleus, signaling at least some circumnuclear star formation. Support for this hypothesis comes from the L-band spectroscopy of Imanishi (2003), where the 3.3 m PAH emission has been observed. Our NIR spectrum, is dominated by the emission lines of H i, He i, [S iii], and [Fe ii]. Pa displays a conspicuous broad component, not observed in any other permitted line. In J, a strong broad absorption is seen to the right of Pa, which we associate with CN (Maraston, 2005) while in H, several narrow absorptions lines of stellar origin are seen. Strong CO bandheads starting at 2.3m are clearly present in K. No high-ionization lines were detected.
-
•
NGC 34. This is an infrared-luminous galaxy in an advanced stage of a merger, with two nuclei separated by approximately 6 kpc (Andy et al., 2000). It contains the most distant and one of the most luminous water vapor megamasers so far observed in a Seyfert galaxy (Henkel et al., 2005). The nature of its emission-line spectrum is highly controversial. Osterbrock & Dahari (1983) claim that NGC 34 is an emission-line galaxy, but not a Seyfert one. based on the optical emission-line ratios. However, Veron-Cetty and Veron (1986) classify it as a Seyfert 2. Andy et al. (2000) argue that this galaxy is more properly classified as a starburst rather than a Seyfert. To our knowledge, the only previous NIR spectroscopy reported in the literature was the K-band spectrum of (Imanishi & Alonso-Herrero, 2004). It can be seen from our data (see Fig. 1), that the continuum emission is dominated by absorption features of stellar origin, and it is indeed very prominent in the H-band. NGC 34 is also one of the few sources where Pa and higher order Pashen lines appear in absorption. The K-band spectrum is dominated by the CO bandheads and H2 emission lines. Overall, NGC 34 displays a poor emission-line spectrum, with weak [S iii] emission, in contrast to what is observed in the other Seyfert 2 spectra. This suggests that NGC34 is not a genuine AGN or that it has a buried nuclear activity at a level that is not observed at NIR wavelengths. Additional support for this conclusion comes from the lack of high-ionization lines in its spectrum. Because of the above, we classified NGC 34 as a starburst galaxy.
-
•
NGC 262. This CfA galaxy hosts a Sy 2 nucleus with strong emission lines. In polarized light, it presents a broad H component (FWHM=8400 km s-1) and an underlying featureless continuum (Miller & Goodrich, 1990). A hard X-ray detection (Awaki et al., 1991) supports the idea that NGC 262 harbors an obscured Seyfert 1 nucleus. The J-band spectroscopy of Veilleux et al. (1997) reports the presence of a faint blue-wing emission with FWHM900-1600 in Pa and He i 10818 Å, which is not seen in the forbidden lines. The NIR spectrum of this source has been studied in separated works (Veilleux et al., 1997; Sosa-Brito et al., 2001; Imanishi & Alonso-Herrero, 2004), but the one presented here is the first one covering the JHK-bands simultaneously. We find that the NIR continuum emission is essentially flat. A rich emission line spectrum was detected with strong forbidden lines of [S iii] and [Fe ii], as well as [C i] 9850Å and [P ii] 11886Å. High ionization lines such as [Si vi] 19630Å, [S viii] 9912Å and [Si x] 14300Å, are also present. No evidence of broad components or wings are found either in Br (FWHM=520 ) or Pa (FHWM=400 ). We attribute the blue wing reported by Veilleux et al. (1997) in Pa to [Fe ii] 12788Å, which contaminates the blue profile of the former. For comparison, [S iii] displays an FWHM of 560 . Faint absorption lines, mainly in the H-band, were detected.
-
•
Mrk 993. This CfA AGN (Huchra & Burg, 1992) has been classified as a Seyfert 1.5-2. Our spectrum displays a conspicuous broad component in He i 10830Å, with FHWM=4500 , and in Pa (FHWM=3600 ). It means that in the NIR, this source can be considered a genuine Seyfert 1 object (see Fig. 1). The continuum emission decreases steeply towards longer wavelengths. Absorption lines of stellar origin are seen across the spectrum, with a prominent Ca ii triplet to the blue edge and the 2300Å CO bandheads in K. It is worth mentioning that the narrow component of the H i lines is seen mostly in absorption. Its NIR spectrum is poor in emission lines. Besides He i and He i, only [S iii] and [Fe ii] are detected (see Fig 1).
-
•
NGC 591. This Seyfert 2 galaxy, also a radio source, displays water megamaser emission with high velocity features that are approximately symmetrically spaced about the systemic velocity of the galaxy, a possible signature of a nuclear disk (Braatz et al., 2004). Optical spectroscopy reported by Durret (1994) reveals a moderately high excitation AGN, with an intrinsic E(B-V) of 0.6 mag. Previous published K-band spectroscopy for this source (Veilleux et al., 1997), shows conspicuous Br, He i, and H2 lines. Here, we present the first simultaneous JHK-band spectroscopic observation of this galaxy. The spectrum is rich in emission features, displaying bright lines of [S iii], He i, H i, and [Fe ii]. We also detected [C i] 9850Å and [P ii] 11886Å as well as high ionization lines of [Si vi] 19630Å, [S viii] 9912Å and [Si x] 14300Å. Strong molecular hydrogen lines are observed in K. No evidence of broad components or wings are observed in the permitted lines, ruling out the hypothesis of a hidden BLR. In fact, both Bracket and Pashen lines are spectroscopically unresolved, while most forbidden lines have widths varying between 500-600 . Absorption lines are easily visible, mostly in the H- and K-bands, with the CO bandheads the most prominent ones.
-
•
Mrk 573. The CfA Seyfert 2 galaxy Mrk 573 (Huchra & Burg, 1992) is a well-studied AGN with two ionization cones seen in [O iii] maps (Pogge & De Robertis, 1995; Falcke et al., 1998). It is also known for the bright high-ionization emission lines displayed in its optical nuclear spectrum (Durret, 1994). Spectropolarimetric observations by Nagao et al. (2004) show prominent scattered broad H emission and various narrow forbidden emission lines, the degree of polarization of the latter ones correlated with the ionization potential of the corresponding line. They interpret this correlation in terms of obscuration of the stratified NLR by the optically and geometrically thick dusty torus. The NIR spectrum of Mrk 573 presented in Fig. 1, is very similar to that of NGC 591. The strong emission lines of [S iii], He i, and H i dominates the J-band. Also, strong high-ionization lines were detected, including those of [S ix] 12520Å, [Si x] 14300Å, and [Ca viii] 23218Å. The line profiles are narrow, with an FWHM typically of 400 . The most prominent stellar absorption features are the Ca ii triplet at the blue end and the 2.3m CO bandhead in K.
-
•
NGC 1097. Classified originally as LINER on the basis of its optical spectrum (Keel, 1983), NGC 1097 was later reclassified by Storchi-Bergmann (1997) as a Seyfert 1 galaxy after observing the appearance of broad Balmer line emission and a featureless blue continuum. It has a bright star-forming ring of diameter 20”, with the nucleus contributing negligibly to the integrated H and Br emission, as well as to the total MIR emission (Kotilainen et al., 2000). The NIR spectrum resembles anything but a Seyfert 1 galaxy. From 0.8 m to 1.7 m, a poor emission line spectrum is detected, with [S iii] 9068, 9531Å the most prominent ones, although intrinsically weak. Absorption bands and lines dominate the NIR region, confirming that the nucleus contributes little to the integrated emission line spectrum. In the K-band, the only emission lines detected are those of molecular hydrogen. The 2.3 m CO absorption bandheads dominate the red edge of the spectrum. Similar results are found from the 1.5–2.5 m spectrum reported by Reunanen et al. (2002).
-
•
NGC 1144. A CfA Seyfert 2, with NGC 1143 forms an interacting pair separated by 0.7”. Our NIR spectrum is very similar to that of NGC 1097. It displays a steep blue continuum in the interval 0.8 m–2.4 m, dominated by stellar absorption features. The emission line spectrum is rather poor, with only [S iii] 9069, 9531, [Fe ii] 1.257 m and H2.2033, 2.121 m being detected.
-
•
Mrk 1066. Regan & Mulchaey (1999) describe this Seyfert 2 galaxy as a dusty object with a single broad dust lane dominating its morphology. It is an FIR luminous galaxy containing a double nucleus (Gimeno et al., 2004). Recently, water vapor maser emission was detected (Henkel et al., 2005), with two components bracketing the systemic velocity of its parent galaxy. The non-simultaneous J- and K-band spectroscopy of Veilleux et al. (1997) shows strong [Fe ii] and Pa, with weak excess of emission seeing at the sides of both lines. They put stringent constraints on the flux of broad Br and Pa. Our JHK spectrum display a flat continuum from 0.8 m to 1.3 m. Redwards, it steeply decreases with wavelength. The emission line spectrum is strong and bright. [S iii], He i, H i, [Fe ii] and H2 are the most conspicuous emission features. Weak high-ionization lines of [Si vi] 19630Å and [Ca viii] 23218Å were detected. The line profiles are narrow, with FWHM 400-500 . No evidence of broad components in the permitted lines was found. The most prominent stellar absorption features are the Ca ii triplet in the blue end and the 2.3 m CO bandhead in K.
-
•
NGC 1275. One of most widely studied objects of our sample, NGC 1275 is a giant elliptical galaxy at the core of the Perseus cluster, with an optically luminous nucleus, currently classified as a Seyfert 1.5/LINER (Sosa-Brito et al., 2001). It is also a strong radio-source in the center of a strong cooling flow and two systems of low-ionization filaments, one of which is probably the remnants of a recent merger (Zink et al., 2000). In the NIR, it was studied in the (HK-bands) by Krabbe et al. (2000), who found that its NIR properties can be described best as a combination of dense molecular gas, ionized emission line gas, and hot dust emission concentrated on the nucleus. They also argue that there is no evidence of a nuclear stellar continuum and that at a distance of 1 Kpc from the nucleus the emission is totally dominated by an old normal stellar population. Recent NIR integral-field spectroscopy by Wilman et al. (2005) shows that the observed H2 is part of a clumpy disk rotating about the radio-jet axis. Our spectrum, the first to simultaneously cover the 0.8 m–2.4 m interval, shows an outstanding emission line spectrum with strong He i, [S iii], [Fe ii], and H2 lines. He i 10830 displays a conspicuous broad component, with FHWM 4700 , not reported before in the literature. It displays the richest H2 emission line spectrum of the sample, with up to the S(7)1-0 line present in the H-band. Note that high-ionization lines are totally absent in the nuclear spectrum. The continuum emission is steep, and decreasing in flux with wavelength. Stellar absorption lines are almost absent. Only the 2.3 m CO band-heads in K are barely visible.
-
•
NGC 1614. This is a strongly interacting galaxy in a late stage of a merging process with spectacular tidal features. It is one of the four starburst galaxies of our sample, also cataloged as a luminous infrared galaxy (LIRG Alonso-Herrero et al., 2002). The HST/NIR camera and multiobject spectrometer (NICMOS) observations reported by Alonso-Herrero et al. (2001) show deep CO stellar absorption, tracing a starburst nucleus about 45 pc in diameter surrounded by a 600 pc diameter ring of supergiant H ii regions. The luminosities of these regions are extremely high, an order of magnitude brighter than 30 Doradus. The spectrum presented in Fig. 2 agrees with the starburst nature of this source. Only narrow nebular emission lines are detected, all spectroscopically unresolved. The molecular H2 spectrum is particularly weak. The continuum is dominated by stellar absorption features, with strong CO bandheads in K and numerous CO absorptions in H.
-
•
MCG-5-13-17. This Seyfert 1 is a strongly perturbed galaxy, with the strongest [O iii] emission concentrated in the nucleus and showing an extension to the southeast, suggestive of a conical morphology. The optical spectrum is dominated by broad permitted lines and narrow permitted and forbidden lines (Rodríguez-Ardila et al., 2000). Our NIR spectroscopy is the first one carried out on this source. In J, broad H i and He i lines are strong, with an FWHM of 4500 and 5400 , respectively. Numerous forbidden lines, including high-ionization lines of[S ix], [Si x], and [Si vi] are present. The Br and H2 molecular emission lines are observed in K, although they are intrinsically weak. The nature of the continuum emission is clearly composite, with stellar absorption features of Ca ii, CO in H, and the 2.3 m CO bandheads in K on top of a steep power-law like continuum.
-
•
NGC 2110. It was initially classified by Bradt et al. (1978) as a narrow-line X-ray galaxy with sufficient column of dust to the nucleus to obscure the broad-line region, thus leading to a Seyfert 2 classification of the optical spectrum, but with an insufficient gas column to attenuate the 2-10 keV emission. In fact, its hard X-ray luminosity is comparable to those of Seyfert 1 galaxies (Weaver et al., 1995). In the NIR, it has been the subject of numerous studies (Veilleux et al., 1997; Sosa-Brito et al., 2001; Reunanen et al., 2003). Our NIR spectrum reflects the low-ionization nature of this source. The most striking characteristic is the strength of the [Fe ii] emission line spectrum with [Fe ii] 12570Å/Pa6, three times higher than the typical values observed on Seyferts (0.6-2 Rodríguez-Ardila, Riffel & Pastoriza, 2005) and the detection of intrinsically weak lines such as [Fe ii] 12950Å and 13212Å. The Bracket and Pashen H i lines are weak. Strong molecular lines are also seen in K. The continuum emission in the J- and H-bands is nearly flat and steep towards the red in K. The Ca ii triplet in absorption, as well as the CO bandheads at 2.3 m and the CO bands in H, are the most conspicuous stellar absorption features detected. No coronal lines are found from our data.
-
•
ESO 428-G014. As the host of a Seyfert 2 nucleus (Bergvall et al., 1986), the NLR of this object has been the subject of investigation because of the many individual, thin strands that are very closely related to the radio jet and that produce a highly complex, yet ordered, structure (Falcke et al., 1996). It also displays a two-side jet with a double helix of emission-line gas. In the NIR, ESO 428-G014 has been studied, among others, by Veilleux et al. (1997) and Reunanen et al. (2003). The latter authors reported bright, extended (up to 320 pc) [Fe ii], Br, and H2 emission, parallel to the cone. Our NIR spectrum, of larger wavelength coverage, shows that the strongest nuclear emission lines are those of [S iii] and He i. We also report the first detection of [S viii] 9912Å and [Si x] 14300Å as well as lines of [P ii], [S ii] and [Ca i]. The continuum emission smoothly decreases in flux with wavelength. The Ca ii triplet and numerous CO bands (in both H and K) are clearly detected. We also confirm the detection of strong [Si vi] 19630Åas previously reported by Reunanen et al. (2003). A hint of [Ca viii] 23218 emission was seen but it is strongly affected by the CO bandheads at 2.3 m.
-
•
Mrk 1210. Optically classified as a Seyfert 2 galaxy, this object shows broad polarized lines in H and H (Tran et al., 1992). The NIR nuclear spectrum, studied in detailed by Mazzalay & Rodríguez-Ardila (2006), is dominated by H i and He i recombination lines as well as [S ii], [S iii] and [Fe ii] forbidden lines. Coronal lines of [S viii], [S ix], [Si vi], [Si x], and [Ca viii] in addition to molecular H2 lines are also detected. The analysis of the emission line profiles, both allowed and forbidden, shows a narrow ( ) line on top of a broad ( ) component, ruling out the presence of a hidden BLR claimed to be present in earlier NIR observations (Veilleux et al., 1997) and confirming the results of Lutz et al. (2002). Mazzalay & Rodríguez-Ardila (2006) reports extended emission of [S iii] and He i, up to a distance of 500 pc from the center. The continuum is steep, decreasing in flux with wavelength. Absorption lines of CO, both in H and K, are observed, indicating the presence of starlight contribution to the nuclear integrated spectrum.
-
•
Mrk 124. Optically classified as a NLS1 galaxy by de Grijp et al. (1992), the spectrum shown in Fig. 3 is the first one published on this source in the NIR region. It is dominated by bright permitted Pa, He i and O i and forbidden [S iii] lines. Forbidden high-ionization lines of [S viii] and [Si vi] are also detected. Pa shows a broad component of FWHM2150 , while Veron-Cetty et al. (2001) report a broad H component of FWHM in the range 1050-1400 . It may indicate that dust obscuration may hide a large fraction of the BLR contribution. Pa is severely affected by the atmospheric cutoff at the red edge of the J-band, so the presence of such a broad permitted component cannot be fully confirmed. Permitted Fe ii lines in the region around 1m were detected. The continuum emission is featureless and flat, with a small excess of emission in the H and K bands. No evidence of stellar population is observed.
-
•
Mrk 1239. Classified as a NLS1 galaxy by Osterbrock & Pogge (1985), this object displays a highly polarized optical spectrum (Goodrich, 1989) and one of the steepest X-ray spectra found in AGNs, with =+3.0 based on ROSAT PSPC data (Grupe et al., 2004a). Smith et al. (2004) modeled the polarization nature of this object and find that it is one of the rare cases of Seyfert 1 galaxies that appear to be dominated by scattering in an extended region along the poles of the torus. The continuum emission of this source is the most outstanding of all the objects in our sample. The detailed study by Rodríguez-Ardila & Mazzalay (2006) shows that the NIR is dominated by a strong bump of emission peaking at 2.2 m, with a strength not reported before in an AGN. The bump follows a simple blackbody curve at T1200 K. It suggests that we may be observing direct evidence of dust heated near to the sublimation temperature, probably produced by the putative torus of the unification model. The emission line spectrum shows numerous permitted and forbidden lines, with He i 1.083m the strongest. Permitted Fe ii transitions, some of them in the 9200 Å region and attributed to Ly fluorescence, are clearly identified. A conspicuous NLR spectrum is detected, with strong [S iii], as well as high-ionization lines of [Si vi], [Si x], [S viii], and [Ca viii]. The last lines display a blue asymmetric profile with their peak centroid blueshifted relative to the systemic velocity of the galaxy. Because of its extreme properties, the line spectrum of Mrk 1239 is discussed in a separate paper (in preparation).
-
•
NGC 3227. Because of its proximity (15.6 Mpc), NGC 3227 is a well-known and studied Seyfert 1/1.5 galaxy in virtually all wavelengths intervals. It displays all the possible ingredients found in an AGN: variability in its nucleus (both in the line and continuum Winge et al., 1995), a radio jet (Kukula et al., 1995), an ionization cone in [O iii] (Mundell et al., 1995), a circumnuclear starburst (González Delgado et al., 1997), strong X-ray emission (Reichart et al., 1985), an inner warp molecular disk (Quillen et al., 1999). The NIR images of this galaxy reveal an unresolved nuclear source in the K band and a nuclear stellar cluster that is slightly resolved in the J and H bands, this cluster contributes to about 40-65% of the total emission continuum (Schinnerer, Eckart & Tacconi, 2001). The NIR properties of this object have been studied, among others, by Reunanen et al. (2003), Schinnerer, Eckart & Tacconi (2001) and Quillen et al. (1999). Our spectrum shows a rich emission line spectrum with strong broad permitted lines in He i and Pa. [S iii] is the brightest forbidden narrow line. [Fe iii] 1.257, 1.644m are also strong in the spectrum. High-ionization lines of [S viii] 9912Å and [Si vi] 1.963m, although weak, were detected. The continuum is steep, decreasing towards longer wavelengths. It displays CO absorption bands in H and K, as well as the Ca ii triplet at the blue edge of the spectrum.
-
•
H 1143-182. This classical Seyfert 1 galaxy has been studied mostly in the X-rays and UV region. The NIR spectrum is dominated by broad permitted lines of H i, He i, O i, and Fe ii, with intrinsic FWHM of 3800 . The NLR spectrum is rather weak with only [S iii], [S ix], [Si x], and [Si vi] detected. No narrow components of the permitted lines were identified. The continuum emission is featureless of a power-law form. From 10000 Å bluewards, a small excess of emission over the underlying power-law is observed. No evidence of absorption stellar features were found.
-
•
NGC 3310. One of the four starburst galaxies of our sample, NGC 3310, is thought to have merged with a companion galaxy (Wehner & Gallagher, 2005). It has been extensively studied in the UV and optical regions because of its peculiar properties. It is one of the bluest spiral galaxies in the de Vaucouleurs (1991) catalog and its far-infrared luminosity (Lir = 1.1 1010 L) indicates that the starburst in this galaxy is comparable to that of the “prototypical” starburst galaxy M82 (Smith et al., 1996). Our JHK spectrum of this object (see Fig. 3) displays a continuum that decreases in flux with wavelength. The emission line spectrum shows lines of only a few species, H i, He i, He ii, [S ii] [S iii] and [Fe ii], all spectroscopically unresolved. Molecular H2 lines at K are barely detectable. The most prominent absorption features are the Ca ii triplet and the CO bandheads in H and K.
-
•
PG 1126-041. The quasar PG 1126-041 is a strong X-ray source that shows clear signs of warm absorption (Wang et al., 1996). Its optical spectrum (Rafanelli & Bonoli, 1984) is characterized by conspicuous Fe ii emission line complexes and broad Balmer lines. NIR information on this object is scarce, but recently Cresci et al. (2004) reported adaptive optics assisted K-band spectroscopy at a spatial resolution of 0.08”, allowing them to spatially resolve the Pa emission within the nuclear 100 pc. The comparison with higher excitation lines suggests that the narrow Pa emission is due to nuclear star formation. Our NIR spectrum is dominated by the classical broad permitted lines of H i, He i, O i, and Fe ii, emitted by the BLR. We clearly detect the forbidden lines of [Fe ii], [S iii], [Si x], and [Si vi], the last line also detected by Cresci et al. (2004). We also found evidence of the presence of H2 1.957 m, but it is strongly blended with Br to the blue and [Si vi] to the red. The latter set of lines (forbidden ones and molecular) allow us to favor the existence of a classical NLR. We propose that part of the narrow flux found by Cresci et al. (2004) in Pa should come from the NLR emission. No absorption lines were detected in our spectrum. The continuum is featureless, and has power-law form with a similar excess of emission blueward of 10000 Å described in H 1143-182 (see above).
-
•
NGC 4051. One of the most well-studied AGN of our sample, NGC 4051 is classified as a NLS1 galaxy. Our NIR spectrum reveals a large variety of spectroscopic features, from low ionization forbidden lines such as, [C i] and [N i], to high-ionization lines of [S ix] and [Si x]. The last two are particularly strong, compared to the other emission lines observed. The NLS1 nature of NGC 4051 is revealed well by the width of permitted lines. The FWHM of O i 11287 Å, an exclusive BLR feature free of contamination from the NLR, is only 940 . Moreover, the broad component of H i and He i is 1200 . We also report the detection of several permitted Fe ii lines, including the ones near 9200 Å, attributed to Ly fluorescence processes (Sigut & Pradhan, 1998, 2003). The continuum emission is clearly composite and steep, decreasing in flux towards longer wavelengths. Underlying stellar population is observed, as can be seen from absorption lines of CO, including the bandheads at 2.3 m. Towards the blue edge of the spectrum, a small excess of emission is seen.
-
•
NGC 4151. NGC 4151 is probably the best-studied Seyfert 1 galaxy in the literature, to which we owe much of our understanding about the AGN phenomenon. Its nuclear continuum and BLR emission are highly variable (see, e.g., Maoz et al.,, 1991; Kaspi et al., 1996), during its low-luminosity state may display characteristics of a Seyfert 2 nucleus (Penston & Pérez, 1984). Observations of this source span the full electromagnetic spectrum, including the NIR. Simultaneous JHK spectroscopy was previously reported by Thompson (1995). Thomson’s resolution was high enough to identify the prominent [Fe ii] spectrum displayed by this object as well as numerous permitted lines of H i, He i, He ii, and O i. A comparison of our NIR spectrum with Thompson’s allowed us to conclude that his was observed during a lower-luminosity state. The higher S/N of our data allowed us to detect broad components in the lines of Pa, He ii, and Br. We also report the detection of O i 11287 Å, not observed in the Thompson’s spectrum. Moreover, our spectrum includes some small spectral regions not covered in the Thompson’s data, leading to the first detection of [Si x] 14300 Å, for instance. We also added new NLR features such as [C i] 9850Å, [N i] 1.04 m, and [P ii] 1.146 m, 1.188 m, not observed before. The continuum emission is featureless and very steep in the region 0.8 m–1.2 m. Redwards, it decreases smoothly in flux with wavelength. The CO stellar absorption features were detected in H but the bandheads at 2.3 m are completely absent.
-
•
Mrk 766. Classified by Osterbrock & Pogge (1985) as NLS1, this barred SBa galaxy displays a number of interesting features. The HST images of this object show filaments, wisps and irregular dust lanes around an unresolved nucleus (Malkan et al., 1998). Radio observations at 3.6 cm, 6 cm and 20 cm (Ulvestad et al., 1995; Nagar et al., 1999) show that the radio source appears to be extended in both P.A. 27 (on a scale of 0.25) and P.A. 160 (on a scale of 03, Nagar et al. 1999). In the optical, the emission is extended (González Delgado & Pérez, 1996a; Mulchaey et al., 1996) through a region of a total size greater than that of the radio source. The NIR spectrum, described well by Rodríguez-Ardila, Contini & Viegas (2005), is characterized by numerous permitted lines of H i, He i, He ii, and Fe ii, and by forbidden lines of [S ii], [S iii] and [Fe ii] among others. High ionized species such as [Si ix], [Si x], [S ix] and [Mg vii] were also observed. The continuum emission has a complex shape, with contributions of the central engine, circumnuclear stellar populations and dust. This last component is shown by the presence of an excess of emission, similar in form to what is reported above for Mrk 1239 but with a much lower strength, peaking at 2.25m, well-fitted by a blackbody function with =1200 K (Rodríguez-Ardila, Contini & Viegas, 2005).
-
•
NGC 4748. Classified as NLS1 by Goodrich (1989), this object had been previously cataloged as a Seyfert 1/1.5 (see for example, Osterbrock & de Roberties, 1985). It resides in an interacting pair, in contact, as evidenced by the H+[N ii] image of Mulchaey et al. (1996). It displays considerable soft X-ray emission (Rush et al., 1996). The L-band spectroscopy of Imanishi & Wada (2004) shows 3.3 m PAH emission in this object, confirming the presence of circumnuclear star formation. Our NIR spectrum reveals conspicuous emission lines, where [S iii] 9531 Å and He i 10830 Å are the strongest ones observed. From the width of the permitted lines, we confirm the NLS1 classification of this object: O i 11287 Å and Pa show FWHM of 1740 and 1950 , respectively. The spectrum is dominated by BLR features, including fluorescent lines of Fe ii. The continuum emission is composite by a power-law-like form and absorption lines of CO both in H and K. Molecular emission lines of H2 were also detected.
-
•
Ton 0156. This radio-quiet quasar is the most distant object of the sample (=0.549). Because of its redshift, our NIR spectrum includes both Balmer and Pashen H i lines. As such, it is dominated by H, with an FWHM of 6260 . On the other hand, P displays a broad component of FWHM 3200, while O i and Fe ii show an FWHM of 2000 . No evidence of forbidden emission lines was found. The continuum is featureless and rather blue shortward of 1.2m. Redward, it becomes rather flat with wavelength increasing.
-
•
Mrk 279 Our NIR spectrum is dominated by broad permitted features of H i and He i, with FWHM 4200 . In contrast, O i 11287Å, also emitted by the BLR, reaches only 2700 . Forbidden lines of [S iii], [Fe ii], [C i], and [S ii] were detected. We also found strong molecular lines of H2 in the K-band. The continuum emission is rather blue shortward of 1.2 m. At this position, there is a subtle change in the inclination, becoming less steep, as is typical of Type 1 objects. CO absorption bands, as well as the Ca ii triplet in absorption are also observed.
-
•
NGC 5548. The NIR spectrum of this well-studied and known Seyfert 1 is dominated by the He i 1.083 m and [S iii] 9531 Å lines. It also shows very broad components in the permitted lines (H i and He i), of complex structure, similar to that observed in double-peaked profiles. It is worth to mention that similar reports of double-peak lines exist in the optical region on this object. In fact, due to the high variability shown by NGC 5548, the double-peak in the optical lines is not always detected. The coronal emission line spectrum is remarkably strong, with [S viii] 9912 Å, [S ix] 12520 Å, [Si x] 14300 Å, [Si vi] 19630 Å and [Ca viii] 23210 clearly detected. The continuum emission displays a clear turnover at 13000 Å, which is rather steep to the blue. Redwards of the turnover, the continuum emission rises steeply to the red, very likely due to dust emission, similar to the one reported in Mrk 1239. The stellar contribution to the observed spectrum seems rather low, with only a few weak CO bands in H detected
-
•
PG1415+451. One of the quasars of the sample, PG1415+451 has the appearance of a naked Type 1 object, as no evidence at all of forbidden emission lines was found on its spectrum. This agrees with the optical/NIR imaging work of Surace et al. (1991), who reports that no distinguishable features from the host galaxy are seen in the images of this source. In contrast, Evans et al. (2001) report the detection of an edge-on CO molecular disk. UV/Optical spectroscopy on this source presented by Corbin & Boroson (1996) shows that Fe ii and Mg ii are the two most conspicuous features in its spectrum. Our NIR spectrum is totally dominated by emission from the BLR, with broad permitted lines of H i, He i, O i, and Fe ii detected. Spikes at the expected position of H2 1.957 m and H2 2.121 m are visible in the K-band but data with better S/N is required to confirm this detection. The observed continuum is very steep, of power-law form.
-
•
Mrk 684. Osterbrock & Pogge (1985) classified this object as a NLS1. Indeed, optical spectroscopy reveals prominent Fe ii emission and broad Balmer lines with FHWM of only 1300 (Persson, 1988). The NIR spectrum is dominated by permitted lines of H i and He i with FWHM 1150 . Permitted lines of Fe ii, O i and Ca ii (seen in emission) are also detected but with slightly narrower FWHM (900 ), suggesting that they are formed in the outer portions of the BLR. The NLR emission is almost absent, while [S iii] 9531 Å is likely to be present but is strongly blended with Pa 8 to make a secure detection. The continuum emission is rather steep and featureless. No evidence of stellar absorption features was found. Like PG1415+451, it has the appearance of a naked Type I source.
-
•
Mrk 478. Mrk 478 is an NLS1 with a steep soft X-ray spectrum (Gondhalekar et al., 1994). Imaging work of Surace et al. (1991) detected evidence of faint shells or arms attributed to its host galaxy. Persson (1988) reports Ca ii lines with FWHM of 2500 and H with an FWHM of 1250 . Later, (Grupe et al., 2004b) measured an FWHM of 1630 on this same line. It is also a strong Fe ii emitter with optical Fe ii/H0.97 (Grupe et al., 2004b). Rudy et al. (2001) report the 1 m Fe ii lines as well as emission from H i, He i, Ca ii and O i. We confirm the presence of all emission line features shown in the Rudy et al. spectrum. Moreover, the FWHM of the Ca ii lines are of 1350 , nearly half the value found by Persson (1988), while Pa displays a broad component of FWHM 1950 , more in accord with Grupe et al. (2004b) results. Forbidden emission from [S iii] and [N i] as well as molecular hydrogen lines in K were clearly detected, evidencing the presence of a NLR/host galaxy. The continuum emission flux from 1 m redwards increases slightly with wavelength up to 1.8 m, from which it becomes steep. From 1 m bluewards, it is rather steep, displaying a large NIR excess.
-
•
NGC 5728. This is one of the Seyfert 2 galaxies that displays prominent co-linear biconical emission line cones, separated by a dark band (Wilson et al., 1993). NGC 5728 is also known for having two nested bars (Wozniak et al., 1995). In the NIR, the K-band spectroscopy has been published by Veilleux et al. (1997) and Sosa-Brito et al. (2001). They both show a spectrum dominated by molecular H2 and weak Br emission. Our composite JHK spectroscopy reveals a poor emission line spectrum, dominated by unresolved [S iii] 9531 Å and He i 1.083 m. The H i spectrum is very weak, showing strong reddening in the direction of the NLR gas. We report the first detection of [Si vi] 19630 Å, in the K-band, implying the existence of high-ionization gas. Moreover, [Si vi] is the only line spectroscopically resolved, with an FWHM of 430 . The continuum emission is steep and almost featureless. The only absorption lines detected are the CO bandheads at 2.3 m and Na 2.207 m in K.
-
•
PG 1448+273. This Palomar-Green quasar is also an NLS1 galaxy and a strong Fe ii emitter. Grupe et al. (2004b) reported an FWHM of H of 1330 and an Fe ii/H ratio of 0.94. No previous spectroscopic observations of this source were found in the literature. Our NIR spectroscopy shows a conspicuous emission line spectrum, with broad permitted lines displaying FWHM values in the range 800 -2300 . The lower values correspond to those measured in the Fe ii, Ca ii, and O i lines, while the large ones were found in Pa. High ionization lines of [S viii] and [S iii], as well as [S iii] emission were detected. In the K-band, molecular H2 is clearly present. The secure detection of these molecular lines supports the idea for a starburst component on this source because of the possible Wolf-Rayet features found in the optical region by Lipari et al. (2003). The continuum emission is steep and featureless of a power-law type.
-
•
Mrk 291. Was classified as an NLS1 galaxy in Goodrich (1989). So far there has been no report of NIR spectroscopy on this object. At first glance, the NIR spectrum only shows very narrow permitted lines, similar to those observed in Seyfert 2 galaxies. Weak broad components are seen in Br (FWHM1600 ), Pa (FWHM2200 ), and Pa (FWHM1800 ). O i, Ca ii, and Fe ii lines, all emitted only by the BLR, are seen in the spectrum. The FWHM of these lines, however, reaches only 1000 . The forbidden line spectrum is rather poor, with only [S iii] and [Fe ii] detected. Molecular lines of H2 are seen in the K-band. The continuum emission is steep and featureless of a power-law type.
-
•
Mrk 493. Classified by Osterbrock & Pogge (1985) as NLS1, Mrk 493 displays very narrow optical broad permitted lines. Persson (1988), for instance, reports an FWHM650 for Ca ii and 450 for both O i and H i. Wang et al. (1996) note that the ROSAT PSPC spectrum is very steep and cannot be fitted by a power law with cold absorption. A power law with either a warm absorption or a soft black-body component fits the data equally well. The only NIR spectrum reported to date for this source is the K-band spectroscopy of Grupe & Thomas (2002). It shows Br in emission, but this appears rather weak. Our JHK spectrum displays numerous emission lines, mostly permitted ones. Pa, He i 1.083 m, and O i1.1287 m were the brightest emission lines. There is also a conspicuous Fe ii emission line spectrum, with primary fluorescent lines at 9200 Å. The BLR profiles display a large interval in FWHM. Exclusive BRL emission features like O i and Fe ii show FWHM of 700 while the broad component of Pa has an FWHM of 1900 . Forbidden emission lines of [S iii] and [Fe ii] are detected but are weak. In the K-band, H2 21210 Å is relatively strong, indicating that hot molecular gas exists in the circumnuclear region of this source.
-
•
PG 1519+226. The NIR spectrum of this source, the first one reported in the literature, is dominated by BLR line emission features. Pa, He i 1.083 m and O i 8446 Å are the brightest lines with FWHM of 3500 for the former two and 1700 for the last. Evidence of [S iii] 9500 Å was found. No other forbidden NLR features were detected. The continuum emission displays the typical turnover at 1.2 m. Bluewards, it is very steep. Redwards, it becomes flat. No signs of stellar absorption features were detected.
-
•
NGC 5929. This CfA Seyfert 2 galaxy (Huchra & Burg, 1992) resides in a strong interacting system and seems to share a common outer envelope with its neighbor, NGC 5930 (Nagar & Wilson, 1999). The K-band spectroscopy for this object, published by Imanishi & Alonso-Herrero (2004) and Ivanov et al. (2000), shows a continuum dominated by CO absorption features and points out towards a moderate circumnuclear starburst component. Our NIR spectrum displays strong [S iii] 9531 Å, He i, and [Fe ii] emission and weak H i. Conspicuous molecular hydrogen lines were detected in the K-band. No high ionization lines were observed. The continuum is steep with strong stellar CO absorption lines in H and K.
-
•
NGC 5953. This Arp-Madore galaxy is interacting with NGC 5954 (Arp, 1966). It has a Seyfert 2 nucleus (Rafanelli et al., 1990), surrounded by a ring of star formation with a radius of 4”. Long-slit spectroscopy shows that in the circumnuclear region a starburst coexists with moderate-excitation gas ionized by the active nucleus (González Delgado & Pérez, 1996b). The J-band spectroscopy of Alonso-Herrero et al. (2000) shows a spectrum dominated by [Fe ii] 1.257 m and weak Pa emission. Our spectrum displays low- and moderate-ionization emission lines, on top of a steep continuum with numerous stellar absorption features. The Ca ii triplet in absorption dominates the blue end of the spectrum, while strong 2.3 m CO bandheads are observed at the red edge. The CO absorption bands are also strong in H. The highest (and most intense) forbidden line detected is [S iii]. In addition, [Fe ii] emission is prominent in the J and H. In K, the most conspicuous emission features are from H2. Br is rather weak, and Pa is severely affected by telluric absorption. A comparison of the NGC 5953 spectrum with the ones discussed in this section allows us to conclude that NGC 5953 is the edge of a Seyfert 2/LINER classification.
-
•
PG 1612+261. Is a radio-quiet quasar that displays a very interesting radio structure very likely associated to a one-sided jet (Kukula et al., 1998). No previous NIR spectroscopy has been published on this object. Our spectrum displays one of the flattest continuum of all Type 1 sources of the sample redwards of 1 m. A small NIR blue excess was detected. The contribution of the NLR to the integrated spectrum is moderate. Strong [S iii] as well as high-ionization lines of [S viii], [S vi], and [Si vi] were detected. In addition, molecular lines of H2 are conspicuous in the K-band. The broad components of the permitted lines display a large interval in FWHM. Pa, for instance, has an FWHM of 3800 while that of O i is 1930 . The Fe ii emission is rather weak.
-
•
Mrk 504. This Palomar-Green galaxy was classified as a NLS1 by Osterbrock & Pogge (1987). It displays a moderate emission line spectrum, dominated by He i 1.083 m H i and [S iii]. The broad components of the permitted lines have FWHM consistent with its classification as an NLS1. Br, Pa and O i display FWHM of 1860 , 2560 and 1330 , respectively. Overall, the NLR spectrum is rather weak. The continuum is very steep, with a power-law form. The CO absorption bands in H and K are detected, evidencing the presence of circumnuclear stellar population.
-
•
3C 351. A very steep radio source and the second most distant object of the sample, 3C 351 is a lobe-dominated, radio-loud QSO (log = 2.81) with moderate-strength X-ray and ultraviolet absorption by ionized gas (Brandt et al., 2000). UV/optical spectroscopy published by Corbin & Boroson (1996) shows a flat optical spectrum and a red UV continuum. In the optical, unusually strong narrow [O iii] lines are observed on top of a very broad H (FHWM6560 ) line. No Fe ii emission was detected. Due to the redshift of this object, our NIR spectrum covers from H to the H-band, allowing the simultaneous detection of Balmer and Pashen lines. In addition to the extremely broad features in the permitted lines, which reach 12100 of FWHM and 25000 at FWZI in H, we found that the peak of the broad component in Pa has a high blueshift, of 2340 , relative to the centroid position of the narrow component. This extremely high blueshift is not detected in H. In this line, a shift of only 365 was measured between the peak position of the narrow and broad components. Note that Pa is isolated from other permitted lines, ruling out blending effects with nearby broad features to explain such a high blueshift. It cannot be due to errors in the wavelength calibration, as the narrow component of Pa is located at the expected position. Narrow forbidden emission features of [N ii] and [S iii] were also detected, meaning that 3C 351 has a noticeable NLR. The continuum emission is featureless and very steep to the blue. Redwards of 1.2 m, it becomes rather flat. No evidence of absorption lines was found.
-
•
Arp 102B. Arp 102B is the archetype double-peaked broad-line radio galaxy (Chen et al., 1989). Corbbet et al. (1998) note that the H profile is extremely broad and has two prominent peaks displaced by 4970150 and 7200300 to the blue and red, respectively, of the narrow component of H. Though less prominent, a third, central broad component can clearly be seen underlying the narrow H and [N ii] 6548, 6583 Å lines. Arp 102B is also a low-luminosity radio galaxy which at 6 cm exhibits a bright unresolved core with a relatively faint extended tail (Corbbet et al., 1998). In our NIR spectrum no trace of double-peaked H i lines were detected. As judged by its overall appearance, and if we compare it to the other spectra discussed in this section, in the NIR Arp 102B is more similar to a LINER-like object than to a Seyfert 1. Moreover, the H i lines, both the Bracket and Pashen series, are almost absent. Pa and Pa are the only ones that are detected but the former is affected by telluric absorption. In contrast, strong He i, [S iii], and [Fe ii] lines were observed. In addition, [C i], [S ii], and molecular H2 transitions are also found in the data. The most remarkable feature in the spectrum is a large blue wing seeing in He i 1.083 m that resembles a broad component to this line. Moreover, the peak of the narrow component is displaced to the red by 415 . This displacement cannot be attributed to a bad wavelength calibration of the spectrum, as all other emission features appear at the expected position. The continuum emission is blue, decreasing in flux towards longer wavelengths, with deep stellar absorption bands of CO in H and K.
-
•
1H 1934-063. The X-ray NLS1 galaxy 1H 1934-063 have been studied in detail in the optical and NIR regions by Rodríguez-Ardila et al. (2000) and Rodríguez-Ardila et al. (2002a). It displays a very rich spectrum with strong permitted lines of H i, He i, and O i and strong forbidden emission of [S iii]. Forbidden high-ionization lines are also conspicuous across the NIR. Emission lines of Fe ii, probably produced by Ly fluorescence, are also conspicuous in the J-band. The continuum emission is featureless of a power-law type. To the blue, a small excess of emission over the power-law continuum is seen. No evidence of circumnuclear stellar population was found in this object.
-
•
Mrk 509. The Seyfert 1 galaxy Mrk 509 is known because of its high X-ray variability as its continuum emission flux in the interval 2-10 keV changes by as much as a factor of 2, and the iron line is detected in only five of 11 observations, for instance (Weaver et al., 2001). It is a well-studyied source, from radio to high-energies. The NIR spectrum is dominated by emission from the BLR. The lines are broad, with FWHM varying from 2800 for O i and Fe ii up to 6300 for the H i lines. The NLR emission from lines of [S ii], [S iii], and [Si vi] are clearly present, as well as emission from the H2 21210 Å line. The continuum emission is rather blue and featureless, with a strong NIR excess of emission shortward of 10000 Å
-
•
Mrk 896. Classified as an NLS1 galaxy by (Veron-Cetty et al., 2001). Our NIR spectrum is dominated by permitted lines of He i 1.083 m, H i, and O i. Weak permitted Fe ii is also detected (e.g. 10500). The FWHM of the broad components of these lines ranges from 1100 to 1500 , confirming its classification as an NLS1. Only medium to high-ionization forbidden NLR features were detected ([S iii], [Si vi], and [Si x]). Some molecular lines of H2 are visible in the K-band. The continuum emission is steep, decreasing in flux with wavelength. The CO absorption lines, including the bandheads at 2.3 m are distinguished in the spectrum, implying a young stellar component in the circumunclear region.
-
•
1H 2107-097. This Seyfert 1 galaxy was the subject of a multiwavelength study, from X-rays to radio, by Grossan et al. (1996). Among their most important findings are the V band variability, which was observed to change by a factor of 1.8 in 6 weeks, and the strong coronal line emission in the optical region. Grossan et al. (1996) also called the attention to the intrinsically weak blue bump even after correcting by reddening. They concluded that weak blue bumps are, therefore, not always an artifact caused by extinction. Our NIR spectrum, is dominated by BLR features with strong He i and H i lines. We also detected permitted transitions of Fe ii and O i. As is the rule for Type 1 galaxies, the last two lines have smaller widths (FWHM1800 ) than the broad components of H i (FWHM3600 ). The NLR spectrum is dominated by [S iii] and high-ionization lines of [Si vi], [Si x] and [Ca viii]. The continuum emission is featureless with a power-law form, and a strong NIR bump in the blue region. No stellar absorption features were detected.
-
•
Ark 564. Classified as an NLS1 galaxy by Goodrich (1989), Ark 564 is one of the best-studied objects in the X-ray because of its brightness in the 2-10 keV band (Collier et al., 2001). The results of an intensive variability campaign on several wavelength bands show that the optical continuum is not significantly correlated with the X-ray (Shemmer , Romano & Bertram, 2001). The ionization state of the gas, as described by Crenshaw et al. (2002), is relatively high. They found that at least 85% of the narrow emission-line flux comes from a region 95 pc from the nucleus and surrounded by a dust screen associated to a “lukewarm” absorber. Ark 564 is also known for the narrowness of its permitted lines, with FWHM in the range 600- 1030. The NIR spectroscopic properties were analyzed in detailed by Contini et al. (2003). The spectrum shown here was taken three years later at a better S/N but essentially all spectroscopic features detected here have already been described by Rodríguez-Ardila et al. (2002a) and Rodríguez-Ardila et al. (2002c). It displays a very rich emission line spectrum, with bright high-ionization lines. The continuum emission is featureless and well-described by a broken power-law.
-
•
NGC 7469. This well-studied Seyfert 1 galaxy, is widely known because the active nucleus is surrounded by a more or less complete ring of powerful starburst activity (Mauder et al., 1994; Miles et al., 1994; Genzel et al., 1995). The circumnuclear ring has a luminosity equivalent to two-thirds of the bolometric luminosity of the entire galaxy. It contains a number of supergiant star formation regions with a few 104 OB stars each. It has been studied in the NIR by several authors, among them, Genzel et al. (1995), Thompson (1996), and Sosa-Brito et al. (2001). The NIR spectrum of Genzel et al. (1995) display bright lines of Br, [Fe ii], [Si vi], H2, He i, and CO on a scale of less than a few hundred parsecs. The NIR spectrum shown in Fig. 7, to our knowledge the first one that simultaneously covers the interval 0.8 m–2.4 m, displays a wealth of emission lines, with He i 1.083 m and [S iii] 9531 Å as the strongest ones. High-ionization lines of [S viii], [S ix], [Si vi], and [Si x] were identified. The continuum emission is steep, of a broken power-law type. Stellar absorption features were detected mostly in the H- and K-bands. In the latter, the 2.3 m CO bandheads are prominent for a Type 1 object.
-
•
NGC 7674. Classified as a Seyfert 2 (Osterbrock & Dahari, 1983), NGC 7674 is a CfA galaxy (Huchra & Burg, 1992) in interaction with UGC 12608 (Levenson et al., 2001). NGC 7674 displays broad emission in polarized lines, which were first detected in this object by Miller & Goodrich (1990). The extremely bright nuclear point source compared to the other Seyfert 2 galaxies (with the exception of NGC 1068) reinforces its interpretation as an obscured Seyfert 1. Our NIR spectrum is ambiguous regarding the classification of this source. It is a Seyfert 2 because of the absence of O i and Fe ii. However, most H i lines display a conspicuous broad component, particularly strong in Pa and Br, where it reaches an FWHM of 3000 . This width is similar to the one detected in polarized light for H (Tran, 1995). Note that the peak of the broad component is blueshifted relative to the systemic velocity of the galaxy by 480 in Pa and 300 in Br. Such a shift, of lower value (100 ), is also found in the polarized broad component reported by Tran (1995). Veilleux et al. (1997) suggests that the broad component is not associated to the classical BLR because it is similar in width to the one found in [O iii] 5007 Å. We checked the [S iii] 9531 line, and indeed it has a blue wing, well-fitted by a broad component of 1550 , half the value found in Pa. Other lines, such as [Fe ii] 1.257 m, display a similar component to that of sulfur. We therefore conclude that we are looking at a genuine BLR feature in NGC 7674. The continuum emission of this object is peculiar. It is nearly flat from the blue end up to 1.2 m. Redwards, it increases with wavelength, with a shape very similar to that found in Mrk 1239 and Mrk 766. In addition, NGC 7674 shows large polarization, supporting the hypothesis that the excess of NIR continuum emission in H and K are very likely due to hot dust.
-
•
NGC 7682. Is a CfA Seyfert 2 (Huchra & Burg, 1992) in interaction with NGC 7683 (Arp, 1966). Ionized gas in H+[N ii] and [O iii] 5007 Å is detected on scales of kiloparsecs on this object (Brodie et al., 1987; Durret, 1994). In the NIR, only K-band spectroscopy was previously reported by Imanishi & Alonso-Herrero (2004). Our spectrum displays conspicuous emission lines with bright [S iii], He i, and H i. Low-ionization lines such as [C i], [S ii], and [Fe ii] as well as high-ionization lines of [S viii] and [Si vi] were clearly detected. In the K-band, molecular H2 and Pa were the brightest emission features. All lines were spectroscopically unresolved or barely resolved. The continuum emission is dominated by absorption features, including the Ca ii triplet in the blue and numerous CO bands in H and K.
-
•
NGC 7714. Is described by Weedman et al. (1981) as an archetype of the starburst nucleus galaxies. According to Kinney et al. (1993), the burst of star formation is thought to be caused by interaction with the companion NGC 7715. The central region of about 330 pc has been the site of active star formation at a rate of about 1 M yr-1 for some 108 years (Brandl et al., 2004). NGC 7714 is also classified as a Wolf-Rayet galaxy because of its strong He ii 4686 Å line (González Delgado et al., 1995). Recent Spitzer observations of this object by Brandl et al. (2004) show that it has an H ii region-like spectrum with strong polycyclic aromatic hydrocarbon emission features. No evidence of an obscured AGN was found. With very little silicate absorption and a temperature of the hottest dust component of 340 K, NGC 7714 is defined by Brandl et al. (2004) as the perfect template for a young, unobscured starburst. However, we measured an E(B-V)=0.47 from our spectrum, based on three different indicators, implying the existence of dust along the line of sight to this source. Although it has been extensively studied in the mid-infrared, Dudley (see, e.g., 1999); O’Halloran et al. (see, e.g., 2000); Brandl et al. (see, e.g., 2004), our SpeX spectrum is the first one published with simultaneous JHK spectroscopy. Our data shows unresolved emission lines of [S iii], He i, H i, [C i], [Fe ii], and H2. The continuum emission is steep, decreasing in flux towards longer wavelengths and dominated by absorption lines and bands across the whole NIR region, the strongest ones being those of Ca ii and CO, including the bandheads at 23000 Å.
5 Final remarks
We have presented the most extensive NIR spectral atlas of AGN to date. This atlas offers a suitable database for studying the continuum and line emission properties of these objects in a region full of interesting features. Ionization codes and models built to study the physical properties of AGNs need to include the constraints provided here in order to fully describe the state of the emitting gas.
The continuum and line emission properties of each subtype of active nucleus are described. In addition, we provide flux measurements of the lines detected in each of the 51 sources, distributed as follows: 12 Seyfert 1, 13 narrow-line Seyfert 1, 7 quasars, 15 Seyfert 2 and 4 starburst.
We found that the continuum of quasars, Seyfert 1s, and NLS1s are rather similar and well-described by a broken power-law. At 1.2 m, most objects display a clear turnover in the continuum, changing from a steep blue continuum shortwards of the breaking point to one being essentially flat or nearly flat redwards. The steepness of the continuum bluewards of 1.2 m changes from source to source and we associate it to the extrapolation of the power-law that characterizes the UV/optical continuum of Type 1 sources. The exception to this trend is Mrk 1239, which displays a remarkable bump of emission over the underlying power-law, peaking at 2.2m. This bump is accounted for by emission from hot dust at T1200 K. The Mrk 766 and NGC 7674 (which optically is classified as Seyfert 2) show evidence of a much weaker but similar bump. The continuum of all quasars is featureless. Some Seyfert 1s and NLS1s show evidence of underlying stellar population as told from the absorption features, mostly of CO, present in the H and K bands.
In contrast to Type 1 objects, the continuum of the Seyfert 2s displays a strong young stellar component. In most objects, it decreases steeply in flux with wavelength across the NIR, similar in shape to the continuum observed in the starburst galaxies NGC 3310 and NGC 7714. Mrk 1066 and NGC 2110 are somewhat peculiar as the continuum in the + first increases in flux, then becomes flat for a small wavelength interval and decreases in flux from 1.4 m redwards, resembling the continuum seen in the starburst galaxies NGC 1614 and NGC 34 . In NGC 1275, NGC 262, NGC 7674, and Mrk 1210, the continuum in the K-band rises with wavelength, suggesting the presence of hot dust. Strong absorption bands of CO were found in the H and K bands, except in the last four Seyfert 2s. The Ca ii triplet in absorption, as well as the CN band at 1.1 m are also seen in the vast majority of objects. An atlas of absorption lines and a study of the stellar populations of these galaxies will be carried out in a separate publication (Riffel et al. 2006, in preparation).
The NIR emission line spectrum varies from source to source and according to the type of activity. We found that [S iii] 9531 and He i 1.083 m are, by far, the strongest lines in the NIR. They were detected in all 51 objects of the sample. Neutral oxygen, permitted Fe ii transitions and the Ca ii triplet in emission are features seen only in Type 1 sources (Seyfert 1s, NLS1s and quasars). These lines are absent in the spectra of the Sy 2, even in those objects that display in the NIR genuine broad line components in the He i lines. It confirms previous suggestions that they are exclusive BLR features Rodríguez-Ardila et al. (2002b, and references therein). Therefore, they are useful indicators of the Seyfert type. Note, however, that the Fe ii seems to be absent or rather weak in radio-loud sources.
Molecular H2, as well as [Fe ii] lines is present in almost all targets, including quasars and Seyfert 1 galaxies. Moreover, H2 2.121 m is more intense relative to Br in Sy 2s than in starburst galaxies (see Figs. 12 and 13), suggesting that the AGN may play an important role in the excitation of the molecular gas in AGNs. Other NLR features worth mentioning are the forbidden high ionization lines, which were detected in the spectra of both Type 1 and Type 2 objects but are completely absent in the starburst galaxies. Therefore, their detection is a clear signature of AGN activity. The commonest coronal lines are [Si x] 1.43 m and [Si vi] 1.963 m. The presence of the coronal lines in the spectra of Sy 2 galaxies (i.e. Mrk 573, NGC 591, NGC 1275 and NGC 7674) suggests that the coronal line region is located very likely in the inner portion of the NLR.
We found that the ratio Pa/Br rules out Case B recombination values in some Type 1 sources and it is very close to its intrinsic value in a large fraction of these objects. This result shows that hydrogen recombination lines are not a suitable indicator of reddening for broad-line AGN. In contrast, the flux ratio between the forbidden [Fe ii] lines 1.257 m/1.644 m agrees, within errors, with the extinction measured by means of the Pa/Br in most Seyfert 2s, allowing us to conclude that the former can also be applied, with confidence, in Type 1 objects. We also found that the steepness of the continuum in Type 1 sources is not correlated with the extinction measured by means of the [Fe ii] lines. It suggest that the contribution of the BLR in the NIR continuum is still larger than initially thought. In comparison, the form of the continuum in a fraction of Seyfert 2 galaxies appears to be related to the amount of extinction measured for the NLR.
Acknowledgements.
This paper was partially supported by the Brazilian funding agency CNPq(304077/77-1) to ARA. This research made use of the NASA/IPAC Extragalactic Database (NED), which is operated by the Jet Propulsion Laboratory, California Institute of Technology, under contract with the National Aeronautics and Space Administration. The authors thank the anonymous referee for useful comments about this manuscript.References
- Alonso-Herrero et al. (2000) Alonso-Herrero, A., Rieke, M. J., Rieke, G. H., 2000, ApJ, 530, 688
- Alonso-Herrero et al. (2001) Alonso-Herrero, A., Quillen, A. C., Simpson, C., Efstathiou, A., Ward, M. J. 2001, AJ, 121, 1369.
- Alonso-Herrero et al. (2002) Alonso-Herrero, A., Rieke, G. H., Rieke, M. J., 2002, AJ, 124, 166
- Alonso-Herrero et al. (2003) Alonso-Herrero, A., Quillen, A. C., Rieke, G. H., Ivanov, V. D. & Efstathiou, A. 2003, AJ, 126, 81
- Andy et al. (2000) Andy Thean, Alan Pedlar, Marek J. Kukula, Stefi A. Baum & Christopher P. O’Dea, 2000, MNRAS, 314, 573.
- Arp (1966) Arp, H., 1966, ApJS, 14, 1
- Awaki et al. (1991) Awaki, H., Koyama, K., Inoue, H., Halpern, J. P., 1991, PASJ, 43, 195
- Barvainis (1987) Barvainis, R. 1987, ApJ, 320, 537
- Bautista & Pradhan (1998) Bautista, M. A. & Pradhan, A. K. 1998, ApJ, 492, 650
- Bergvall et al. (1986) Bergvall, N., Johansson, L., Olofsson, K., 1986, A&A, 166,92
- Boroson & Green (1992) Boroson, T. A., Green, R. F., 1996, ApJS, 80, 109
- Boisson et al. (2002) Boisson, C., Coupé, S., Cuby, J. G., Joly, M., Ward, M. J., 2002, A&A, 396, 489.
- Braatz et al. (2004) Braatz, J. A., Henkel, A., Greenhill, L. J., Moran, J. M., Wilson, A. S., 2004, ApJ, 616L, 29
- Bradt et al. (1978) Bradt, H. V., Burke, B. F., Canizares, C. R., et al., 1978, ApJL, 226, 111
- Brandl et al. (2004) Brandl, B. R., Devost, D., Higdon, S. J. U., et al., 2004, ApJS, 154, 188
- Brandt et al. (2000) Brandt, W. N., Laor, A., Wills, B. J., 2000, ApJ, 528, 637
- Brodie et al. (1987) Brodie, J., Willick, J. A., Bowyer, S., 1987, AJ, 93, 1054
- Boller et al. (1996) Boller, Th., Brandt, W. N., Fink, H., 1996, A&A, 305, 53
- Cardelli, Clayton & Mathis (1989) Cardelli, J. A., Clayton, G. C.; Mathis, J. S., 1989, ApJ, 345, 245
- Chen et al. (1989) Chen, K., Halpern, J. P., Filippenko, A. V., 1989, ApJ, 339, 742
- Crenshaw at el. (2002) Crenshaw at el. 2002, ApJ, 566, 187
- Collier et al. (2001) Collier, S., Crenshaw, D. M., Peterson, B. M., et al. 2001, ApJ, 561, 146
- Collin-Souffrin, Dumont & Tully (1982) Collin-Souffrin, S., Dumont, S.,Tully, J., 1982, A&A ,106, 362
- Contini et al. (2003) Contini, M., Rodríguez-Ardila, A., Viegas, S. M., 2003, A&A, 408, 101
- Corbbet et al. (1998) Corbett, E. A., Robinson, A., Axon, D. J., et al., 1998, MNRAS, 296, 721
- Corbin & Boroson (1996) Corbin, M. R., Boroson, T. A., 1996, ApJS, 107, 69
- Cresci et al. (2004) Cresci, G., Maiolino, R., Marconi, A., et al. 2004, A&A, 423, L13
- Crenshaw et al. (2002) Crenshaw, D. M., Kraemer, S. B., Turner, T. J., et al. 2002, ApJ, 566, 187
- Cushing, Vacca & Rayner (2004) Cushing, M. C., Vacca, W. D., & Rayner, J. T. 2004, PASP, 116, 362.
- de Grijp et al. (1992) de Grijp, M. H. K., Keel, W. C., Miley, G. K., Goudfrooij, P., Lub, J., 1992, A&AS, 96, 389
- Dudley (1999) Dudley, C. C., 1999, MNRAS, 307, 553
- Durret (1994) Durret, F., 1994, A&AS, 105, 57
- Evans et al. (2001) Evans, A. S., Frayer, D. T., Surace, J. A., et al., 2001, AJ, 121, 1893
- Falcke et al. (1998) Falcke, H., Wilson, A. S., Simpson, C., 1998, ApJ, 502, 199
- Falcke et al. (1996) Falcke, H., Wilson, A. S., Simpson, C., et al., 1996, ApJL, 470, 31
- Genzel et al. (1995) Genzel, R., Weitzel, L., Tacconi-Garman, L. E., et al., 1995, ApJ, 444, 129
- Gimeno et al. (2004) Gimeno, G. N., Diaz, R. J., Carranza, G. J., 2004, AJ, 128, 62
- Glikman et al. (2006) Glikman, E., Helfand, D. J., White, R. L., 2006, ApJ, in press, Astro-ph/0511640.
- Gondhalekar et al. (1994) Gondhalekar, P. M., Kellett, B. J., Pounds, K. A., et al., 1994, MNRAS, 268, 973
- González Delgado et al. (1995) González-Delgado, R. M., Pérez, E., Diaz, A. I., et al., 1995, ApJ, 439, 604
- González Delgado & Pérez (1996a) González Delgado, R.M., Pérez, E. 1996, MNRAS, 278, 737
- González Delgado & Pérez (1996b) González Delgado, R.M., Pérez, E. 1996, MNRAS, 281, 781
- González Delgado et al. (1997) González Delgado, R. M., Pérez, E., Tadhunter, C., et al., 1997, ApJS, 108, 155
- Goodrich (1989) Goodrich, R. W., 2004, ApJ, 342, 224
- Goodrich et al. (1994) Goodrich, R. W., Veilleux, S., Hill, G. H., 1994, ApJ, 422, 521
- Grossan et al. (1996) Grossan, B., Remillard, R. A., Bradt, H. V., et al., 1996, ApJ, 457, 199
- Grupe et al. (2004a) Grupe, D., Mathur, S., Komossa, S., 2004, AJ, 127, 3161
- Grupe et al. (2004b) Grupe, D., Wills, B. J., Leighly, K. M., et al., 2004, AJ, 127, 156
- Grupe & Thomas (2002) Grupe, D., Thomas, H. -C., 2002, A&A, 386, 854.
- Henkel et al. (2005) Henkel, C., Peck, A. B., Tarchi, A., Nagar, N. M., Braatz, J. A., et al., 2005, A&A, 436, 75
- Huchra & Burg (1992) Huchra, J., Burg, R., 1992, ApJ, 393, 90
- Hummer & Storey (1987) Hummer, D. G., & Storey, P. J. 1987, MNRAS, 224, 801
- Imanishi (2003) Imanishi, M., 2003, ApJ, 599, 918
- Imanishi & Alonso-Herrero (2004) Imanishi, M. & Alonso-Herrero, A., 2004, ApJ, 614, 122.
- Imanishi & Wada (2004) Imanishi, M., Wada, K., 2004, ApJ, 617, 214
- Ivanov et al. (2000) Ivanov, V. D., Rieke, G. H., Groppi, C. E., et al. 2000, ApJ, 545, 190
- Kaspi et al. (1996) Kaspi, S., Maoz, D., Netzer, H., et al., 1996, ApJ, 470, 336
- Keel (1983) Keel, W. C., 1983, ApJ, 269, 466
- Kinney et al. (1993) Kinney, A. L., Bohlin, R. C., Calzetti, D., et al., 1993, ApJ, 86, 5
- Kishimoto et al. (2005) Kishimoto, M., Antonucci, R., Blaes, O., 2005, MNRAS, 364, 640
- Kotilainen et al. (2000) Kotilainen, J. K., Reunanen, J., Laine, S., et al., 2000, A&A, 353, 834
- Krabbe et al. (2000) Krabbe, A., Sams, B. J. III., Genzel, R., Thatte, N., Prada, F., 2000, A&A, 354, 439
- Kukula et al. (1995) Kukula, M. J., Pedlar, A., Baum, S. A., et al., 1995, MNRAS, 276, 1262
- Kukula et al. (1998) Kukula, M. J., Dunlop, J. S., Hughes, D. H., et al. 1998, MNRAS, 297, 366
- Levenson et al. (2001) Levenson, N. A., Weaver, K. A.; Heckman, T. M., 2001, ApJS, 133, 269
- Lipari et al. (2003) Lipari, S., Terlevich, R., Diaz, R. J., et al. 2003, MNRAS, 340, 289
- Lutz et al. (2002) Lutz, D., Maiolino, R., Moorwood, A. F. M., et al. 2002, A&A, 396, 439
- Malkan et al. (1998) Malkan, M.A., Varoujian, G., Tam, R., 1998, ApJS, 117, 25
- Maoz et al., (1991) Maoz, D., Netzer, H., Mazeh, T., et al., 1991, ApJ, 367, 493
- Maraston (2005) Maraston, C., 2005, MNRAS, 362, 799
- Martini et al. (2001) Martini, P., Pogge, R. W., Ravindranath, S., & An, H. H., 2001, ApJ, 562, 139
- Mauder et al. (1994) Mauder, W., Weigelt, G., Appenzeller, I., et al., 1994, 1994A&A,285, 44
- Mazzalay & Rodríguez-Ardila (2006) Mazzalay. X., Rodríguez-Ardila, A., 2006, A&A, submitted.
- Miles et al. (1994) Miles, J. W., Houck, J. R., Hayward, T. L., 1994, ApJL, 425, 37
- Miller & Goodrich (1990) Miller, J. S., Goodrich, R. W., 1990, ApJ, 355, 456
- Mulchaey et al. (1996) Mulchaey, J. S., Wilson, A. S., Tsvetanov, Z. 1996, ApJ, 467, 197
- Mundell et al. (1995) Mundell, C. G., Holloway, A. J., Pedlar, A., et al. 1995, MNRAS, 275, 67
- Nagao et al. (2004) Nagao, T., Kawabata, K. S., Murayama, T., Ohyama, Y., Taniguchi, Y., et al., 2004, AJ, 128, 2066
- Nagar & Wilson (1999) Nagar, N. M., Wilson, A. S., ApJ, 516, 97
- Nagar et al. (1999) Nagar, N. M., Wilson, A. S., Mulchaey, J. S., Gallimore, J. F. 1999, ApJS, 120, 209
- O’Halloran et al. (2000) O’Halloran, B., Metcalfe, L., Delaney, M., et al., 2000, A&A, 360, 871
- Oliva et al. (2001) Oliva, E., et al. 2001, A&A, 369, L5
- Osterbrock & Dahari (1983) Osterbrock, D. E., Dahari, O., 1983, ApJ, 273, 478
- Osterbrock & de Roberties (1985) Osterbrock, D. E., de Roberties, M. M., 1985, PASP, 97, 1129
- Osterbrock & Pogge (1985) Osterbrock, D. E. & Pogge, R. W. 1985, ApJ, 340, 713
- Osterbrock & Pogge (1987) Osterbrock, D. E. & Pogge, R. W. 1985, ApJ, 323, 108
- Osterbrock (1989) Osterbrock, D. E., 1989, Astrophysics of Gaseous Nebulae and Galactic Nuclei. University Science Books, Mill Valey, CA.
- Penston & Pérez (1984) Penston, M. V., Pérez, E., 1984, MNRAS, 211P, 33
- Persson (1988) Persson, S. E., 1988, ApJ, 330, 751
- Pogge & Martini (2002) Pogge, R. W., Martini, P., 2002, ApJ, 569, 624
- Pogge & De Robertis (1995) Pogge, R. W., de Robertis, M. M., 1995, ApJ, 451, 585
- Pogge & Owen (1993) Pogge, R. W., & Owen, J. M. 1993, OSU Internal Report 93-01
- Quillen et al. (1999) Quillen, A. C., Alonso-Herrero, A., Rieke, M. J., et al., 1999, ApJ, 527, 696
- Rafanelli & Bonoli (1984) Rafanelli, P., Bonoli, C., 1984, A&A, 131, 186.
- Rafanelli et al. (1990) Rafanelli, P., Osterbrock, D. E., Pogge, R. W., 1990, AJ, 99, 53
- Rayner et al. (2003) Rayner, J. T., Toomey, D. W., Onaka, P. M., Denault, A. J., Stahlberger, W. E., Vacca, W. D., Cushing, M. C., & Wang, S. 2003, PASP, 155, 362
- Regan & Mulchaey (1999) Regan, M. W., Mulchaey, J. S., 1999, AJ, 117, 2676
- Rhee & Larkin (2000) Rhee, Joseph H. & Larkin, James E., 2000, ApJ, 538, 98.
- Reichart et al. (1985) Reichert, G. A., Mushotzky, R. F., Holt, S. S., et al., 1985, ApJ, 296, 69
- Reunanen et al. (2003) Reunanen, J.; Kotilainen, J. K.; Prieto, M. A., 2003, MNRAS, 343, 192.
- Reunanen et al. (2002) Reunanen, J.; Kotilainen, J. K.; Prieto, M. A., 2002, MNRAS, 331, 154.
- Rodríguez-Ardila et al. (2000) Rodríguez-Ardila, A., Pastoriza, M. G., Donzelli, C. J., 2000, ApJS, 126, 63
- Rodríguez-Ardila et al. (2002a) Rodríguez-Ardila, A., Viegas, S. M., Pastoriza, M. G., Prato, L. 2002a, ApJ, 565, 140
- Rodríguez-Ardila et al. (2002b) Rodríguez-Ardila, A., Viegas, S. M., Pastoriza, M. G., Prato, L.; Donzelli, Carlos J., 2002b, ApJ, 572, 94
- Rodríguez-Ardila et al. (2002c) Rodríguez-Ardila, A., Viegas, S. M., Pastoriza, M. G., Prato, L. 2002c, ApJ, 579, 214
- Rodríguez-Ardila et al. (2004) Rodríguez-Ardila, A.; Pastoriza, M. G.; Viegas, S.; Sigut, T. A. A.; Pradhan, A. K., 2004, A&A, 425, 457.
- Rodríguez-Ardila, Contini & Viegas (2005) Rodríguez-Ardila, A.; Contini, M.; Viegas, S. M. 2005, MNRAS, 357, 220
- Rodríguez-Ardila, Riffel & Pastoriza (2005) Rodríguez-Ardila, A., Riffel, R. & Pastoriza, M. G. 2005, MNRAS, 364, 1041
- Rodríguez-Ardila & Mazzalay (2006) Rodríguez-Ardila, A., Mazzaly, Z., 2006, MNRAS, in press, Astro-ph/0601313
- Rudy et al. (2000) Rudy, R. J., Mazuk, S., Puetter, R. C., Hamann, F. 2000, ApJ, 539, 166
- Rudy et al. (2001) Rudy, R. J., Lynch, D. K., Mazuk, S., Venturini, C. C., Puetter, R. C., Hamann, F. 2001, PASP, 113, 916
- Rush et al. (1996) Rush, B., Malkan, M., Fink, H. H., et al. 1996, ApJ, 471, 190
- Schinnerer, Eckart & Tacconi (2001) Schinnerer, E., Eckart, A., Tacconi, L. J., 2001, ApJ, 549, 254
- Schlegel et al. (1998) Schlegel, D. J., Finkbeiner, D. P., Davies, M., 1998, ApJ, 500, 525
- Schmidt & Green (1983) Schmidt, M., Green, R. F., 1983, ApJ, 269, 352
- Shemmer , Romano & Bertram (2001) Shemmer, O., Romano, P., Bertram, R., et al. 2001, ApJ 561, 162
- Sigut & Pradhan (2003) Sigut, T. A. A., Pradhan, A. K. 2003, ApJS, 145, 15
- Sigut & Pradhan (1998) Sigut, T. A. A., Pradhan, A. K. 1998, ApJ, 499, L139
- Smith et al. (1996) Smith, D. A., Neff, S. G., Bothun, G. D., et al., 1996, ApJL, 473, 21
- Smith et al. (2004) Smith, J. E., Robinson, A., Alexander, D. M., et al., 2004, MNRAS, 350, 140
- Sosa-Brito et al. (2001) Sosa-Brito, R. M.; Tacconi-Garman, L. E.; Lehnert, M. D. & Gallimore, J. F., 2001, ApJS, 136, 61.
- Storchi-Bergmann (1997) Storchi-Bergmann, T., Eracleous, M., Ruiz, M. T., Livio, M., Wilson, A. S., et al., 1997, ApJ, 489, 87
- Surace et al. (1991) Surace, J. A., Sanders, D. B., Evans, A. S., AJ, 122, 2791
- Thompson (1995) Thompson, R. I. 1995, ApJ, 445, 700
- Thompson (1996) Thompson, R. I. 1996, ApJL, 459, 61
- Tran et al. (1992) Tran, H. D., Miller, J. S., Kay, L. E., 1992, ApJ, 397, 452
- Tran (1995) Tran, H. D., 1995, ApJ, 440, 565
- Ulvestad et al. (1995) Ulvestad, J. S., Antonucci, R. R. J., Goodrich, R. W. 1995, AJ, 109, 81
- Vacca, Cushing & Rayner (2003) Vacca, W. D., Cushing, M. C., & Rayner, J. T. 2003, PASP, 155, 389
- de Vaucouleurs (1991) de Vaucouleurs, G., de Vaucouleurs, A., Corwin, H. G., et al. 1991, Third Reference Catalogue of Bright Galaxies (New York: Springer).
- Veilleux et al. (1997) Veilleux, S.; Goodrich, R. W. & Hill, G. J., 1997, ApJ, 477, 631.
- Veilleux (1991) Veilleux, S., 1991, ApJ, 75, 357
- Veron-Cetty et al. (2001) Veron-Cetty M.-P., Veron P., Gonçalves A.C., 2001, A&A, 372, 730
- Wang et al. (1996) Wang, T., Brinkmann, W., Bergeron, J., 1996, A&A, 309, 81
- Weaver et al. (1995) Weaver, K. A., Mushotzky, R. F., Serlemitsos, P. J., et al. 1995, ApJ, 442, 597
- Weaver et al. (2001) Weaver, K. A., Gelbord, J., Yaqoob, T., 2001, ApJ, 550, 261
- Weedman et al. (1981) Weedman, D. W., Feldman, F. R., Balzano, V. A., et al., 1981, ApJ, 248, 105
- Wehner & Gallagher (2005) Wehner, E. H., Gallagher, J. S. III., 2005, ApJL, 618, 21
- Wilman et al. (2005) Wilman, R. J., Edge, A. C., Jhonstone, R. M., 2005, MNRAS, 359, 755
- Wills et al. (1985) Wills, B. J., Netzer, H., Wills, D., 1985, 288, 94
- Wilson et al. (1993) Wilson, A. S., Braatz, J. A., Heckman, T. M., et al., 1993, ApJL, 419, 61
- Winge et al. (1995) Winge, C., Peterson, B. M., Horne, K., et al. 1995, ApJ, 445, 680
- Wozniak et al. (1995) Wozniak, H., Friedli, D., Martinet, L., et al. 1995, A&AS, 111, 115.
- Zink et al. (2000) Zink, E. C., Lester, D. F., Doppmann, G., Harvey, P. M., 2000, ApJS, 131, 413
[x]clcccccccc
Observation log and basic galactic properties for the sample.
E(B-V)G Date of Exposure PA r
IDGalaxy Type (mag) observation Time (s) Airmass (pc)a
(1) (2) (3) (4) (5) (6) (7) (8) (9) (10)
\endfirstheadContinued.
ID Galaxy Type z E(B-V)G Date Exp. Time Airmass PA r
\endhead\endfoot1 Mrk 334 Sy1 0.021956 0.047 2003 Oct 23 1920 1.00 303 340
2 NGC 34 SB/Sy2 0.019784 0.027 2003 Oct 24 1680 1.19 0 230
3 NGC 262 Sy2 0.015034 0.067 2003 Oct 24 1200 1.03 160 175
4 Mrk 993 Sy2 0.015537 0.060 2003 Oct 23 1920 1.03 160 241
5 NGC 591 Sy2 0.015167 0.046 2003 Oct 24 1800 1.05 160 206
6 Mrk 573 Sy2 0.017259 0.023 2003 Oct 24 1800 1.10 40 267
7 NGC 1097 Sy1 0.004253 0.027 2003 Oct 23 720 1.6 0 58
8 NGC 1144 Sy2 0.028847 0.072 2003 Oct 24 1500 1.09 27 447
9 Mrk 1066 Sy2 0.012025 0.132 2003 Oct 23 1920 1.07 146 186
10 NGC 1275 Sy2 0.017559 0.163 2003 Oct 23 1440 1.16 135 272
11 NGC 1614 SB 0.015938 0.154 2003 Oct 24 1800 1.14 0 154
12 MCG-5-13-17 Sy1 0.012642 0.017 2003 Oct 23 1440 1.65 0 196
2003 Oct 24 1200 1.69 0 196
13 NGC 2110 Sy2 0.007789 0.375 2003 Oct 23 1440 1.14 20 121
2003 Oct 24 1200 1.14 20 121
14 ESO 428-G014 Sy2 0.005664 0.197 2003 Oct 24 960 1.56 345 88
15 Mrk 1210 Sy2 0.01406 0.030 2002 Apr 25 2700 1.25 58 220
16 Mrk 124 NLS1 0.05710 0.015 2002 Apr 23 2640 1.16 10 990
17 Mrk 1239 NLS1 0.01927 0.065 2002 Apr 21 1920 1.08 0.0 335
2002 Apr 23 1920 1.15 0.0 335
18 NGC 3227 Sy1 0.00386 0.023 2002 Apr 21 720 1.00 158 67
2002 Apr 25 1080 1.02 158 67
19 H1143-192 Sy1 0.03330 0.039 2002 Apr 21 1920 1.31 45 520
20 NGC 3310 SB 0.00357 0.022 2002 Apr 21 840 1.21 158 56
21 PG1126-041 QSO 0.060000 0.055 2002 Apr 24 2160 1.12 10 1000
2002 Apr 23 1920 1.14 21 1000
22 NGC 4051 NLS1 0.00234 0.013 2002 Apr 20 1560 1.17 132 37
23 NGC 4151 Sy1 0.00345 0.028 2002 Apr 23 1800 1.10 130 58
24 Mrk 766 NLS1 0.01330 0.020 2002 Apr 21 1680 1.06 112 230
2002 Apr 25 1080 1.02 112 230
25 NGC 4748 NLS1 0.01417 0.052 2002 Apr 21 1680 1.29 36 254
2002 Apr 25 1440 1.21 36 254
26 Ton 0156 QSO 0.549000 0.015 2002 Apr 25 3600 1.06 143 1000
27 Mrk 279 NLS1 0.03068 0.016 2002 Apr 24 3600 1.54 0.0 480
28 NGC 5548 Sy1 0.01717 0.020 2002 Apr 23 1920 1.05 112 298
29 PG1415+451 QSO 0.114000 0.009 2002 Apr 24 3960 1.28 134 1000
2002 Apr 25 1440 1.14 143 1000
30 Mrk 684 Sy1 0.046079 0.021 2002 Apr 21 1440 1.02 172 980
31 Mrk 478 NLS1 0.07760 0.014 2002 Apr 20 3240 1.06 0.0 1200
32 NGC 5728 Sy2 0.01003 0.101 2002 Apr 21 960 1.31 36 160
33 PG 1448+273 QSO 0.06522 0.029 2002 Apr 24 2160 1.01 108 1020
34 Mrk 291 NLS1 0.03519 0.038 2002 Apr 21 2520 1.04 84 550
35 Mrk 493 NLS1 0.03183 0.025 2002 Apr 20 1800 1.07 0.0 500
2002 Apr 25 900 1.04 0.0 500
36 PG 1519+226 QSO 0.137000 0.043 2002 Apr 25 4000 1.14 94 1000
37 NGC 5929 Sy2 0.008312 0.024 2004 Jun 01 1680 1.38 116 193
38 NGC 5953 Sy2 0.006555 0.049 2004 Jun 02 2160 1.18 0 165
39 PG 1612+261 QSO 0.13096 0.054 2002 Apr 2 3 2520 1.10 107 2050
40 Mrk 504 NLS1 0.03629 0.050 2002 Apr 21 2100 1.04 138 570
41 3C 351 BLRG 0.371940 0.023 2002 Apr 24 3600 1.36 170 1000
42 Arp 102B Sy1 0.024167 0.024 2004 Jun 02 2880 1.22 0 700
43 1H 1934-063 NLS1 0.01059 0.293 2004 Jun 02 2160 1.13 0 349
44 Mrk 509 Sy1 0.034397 0.057 2003 Oct 23 1440 1.16 0 730
2004 Jun 01 2160 1.17 0 730
45 Mrk 896 NLS1 0.02678 0.045 2002 Apr 23 1440 1.21 150 420
2002 Apr 24 1200 1.18 150 420
2002 Apr 25 1200 1.17 150 420
46 1H2107-097 Sy1 0.026525 0.233 2003 Oct 24 1680 1.15 338 565
47 Ark 564 NLS1 0.02468 0.060 2000 Oct 10 1500 1.05 0.0 390
2003 Oct 24 2160 1.05 250 383
48 NGC 7469 Sy1 0.016317 0.069 2003 Oct 23 1920 1.03 303 253
49 NGC 7674 Sy2 0.028924 0.059 2003 Oct 23 2160 1.02 303 448
50 NGC 7682 Sy2 0.017125 0.067 2003 Oct 24 2400 1.06 314 179
51 NGC 7714 H II 0.009333 0.052 2003 Oct 24 2400 1.05 348 115
a Radius of the integrated region
| Ion | Mrk 334 | NGC 1097 | MCG -5-13-17 | Mrk 124 | Mrk 1239 | NGC 3227 | H 1143-182 | PG 1126-041 | NGC 4051 | NGC 4151 | |
|---|---|---|---|---|---|---|---|---|---|---|---|
| O i | 8446 | - | - | - | 13.591.35 | 86.616.70 | - | - | - | 79.934.61 | 130.9415.86 |
| Ca ii | 8498 | - | - | - | - | - | - | - | - | - | - |
| S iii | 9069 | 22.690.74 | 12.083.38 | 18.330.46 | 4.370.30 | 25.270.80 | 91.575.41 | 5.930.49 | 11.151.00 | 26.922.38 | 266.766.10 |
| Fe ii | 9127 | - | - | - | - | - | - | 1.520.38 | - | 6.701.67 | - |
| Fe ii | 9177 | - | - | - | 2.460.61d | - | - | 1.250.31 | - | 3.310.82 | 3.362.23k |
| Fe ii | 9202 | - | - | - | 2.300.55 | - | - | 1.130.28 | - | 10.582.64 | - |
| H i | 9230 | - | - | - | - | - | - | - | - | - | 7.492.03 |
| H i | 9230(b) | - | - | - | - | 66.212.83ah | - | 54.608.61a | 65.964.16ah | 19.894.68a | 39.717.40 |
| S iii | 9531 | 56.910.52 | - | 38.710.79 | 17.550.24 | 103.301.21 | 247.793.40 | 17.960.60 | 46.283.71 | 75.911.71 | 706.197.23 |
| C i | 9824 | 2.010.53 | - | - | - | - | - | - | 1.790.14 | - | - |
| C i | 9850 | 3.290.53 | - | 4.641.60 | 1.000.10 | - | 13.301.74 | - | 1.150.11 | 5.921.41 | 54.045.63 |
| S viii | 9910 | - | - | 6.611.54 | - | 23.791.85 | 1.971.14 | - | 2.580.21 | 13.671.97 | 40.502.08 |
| Fe ii | 9999 | 2.040.51 | - | - | 2.750.17 | - | - | - | - | 11.211.63 | - |
| H i | 10049 | 2.060.22 | - | - | - | 34.190.89 | - | 14.571.94 | - | 5.350.65 | 32.171.87 |
| H i | 10049(b) | 5.140.73 | - | - | - | 46.261.64 | 43.847.83a | 76.065.65 | 104.833.76a | 33.842.77 | 288.4614.89i |
| He ii | 10122 | 1.690.36 | - | - | - | 5.530.63 | - | - | - | 3.110.63 | 28.551.51 |
| He ii | 10122(b) | 2.790.68 | - | - | - | 59.282.85 | 12.682.22a | 3.591.52a | - | 14.252.11 | 65.577.13j |
| Fe ii | 10171 | - | - | - | - | - | - | - | - | - | - |
| S ii | 10286 | 1.220.12 | - | - | - | - | 13.282.68 | 1.140.31 | - | 1.890.60 | 28.000.28 |
| S ii | 10320 | 1.390.12 | - | - | - | - | 13.732.68 | 1.270.31 | - | 4.000.60 | 38.350.28 |
| S ii | 10336 | 0.480.12 | - | - | - | - | 13.402.68 | 0.820.31 | - | 1.410.60 | 24.080.28 |
| S ii | 10370 | 0.440.12 | - | - | - | - | 2.781.43 | - | - | - | 10.400.28 |
| N i | 10404 | 1.210.18 | - | - | - | - | 13.444.13 | - | - | 2.710.59 | 16.100.36 |
| Fe ii | 10500 | - | - | - | - | 18.660.91 | - | - | 13.042.77 | - | - |
| He i | 10830 | 30.950.70 | - | 57.801.88 | 7.660.21 | 98.381.71 | 163.981.95 | 73.861.66 | - | 75.882.31 | 685.105.21 |
| He i | 10830(b) | 33.293.83 | - | 125.5715.40 | 25.761.39 | 173.814.28 | 298.217.37 | 255.465.22 | 133.303.65a | 115.377.55 | 1470.2956.18 |
| H i | 10938 | 7.910.58 | - | 2.010.06 | 1.130.17 | 44.012.44 | 20.462.61 | 38.352.78 | - | 19.143.38 | 50.285.64 |
| H i | 10938(b) | 8.561.82 | - | 8.760.28 | 9.380.71 | 87.047.32 | 122.017.43 | 98.316.45 | 95.824.80a | 41.477.66 | 295.0250.94 |
| Fe ii | 11126 | - | - | - | - | - | - | - | - | - | - |
| O i | 11287 | 6.321.03 | - | - | 10.930.79 | 50.031.76 | - | 27.930.89 | 43.984.08 | 47.162.27 | - |
| P ii | 11460 | - | - | - | - | - | - | - | - | - | 6.251.17 |
| P ii | 11886 | 3.890.83 | - | - | - | - | 14.763.23 | - | - | - | 19.701.01 |
| S ix | 12520 | - | - | 1.970.17 | - | 15.512.84 | - | 1.020.16 | - | 11.130.77 | 39.710.91 |
| Fe ii | 12570 | 8.450.21e | - | 4.840.21e | 3.160.62c | 7.900.55c | 41.101.18c | 2.540.45c | - | 5.260.81c | 58.802.94c |
| H i | 12820 | 14.680.55e | - | 2.140.65e | - | 71.871.62 | 33.842.05 | 79.781.59 | - | 20.710.55 | 108.260.99 |
| H i | 12820(b) | 18.372.05 | - | 41.696.11 | 14.6dc | 116.254.77 | 168.7410.23 | 84.203.42 | 101.833.70ad | 66.611.67 | 712.488.77 |
| Fe ii | 13201 | - | - | - | - | - | 26.793.72 | - | - | - | 21.482.14 |
| Si x | 14300 | - | - | - | - | 26.151.85 | - | 1.620.24 | 5.121.90 | 22.191.05 | 37.731.55 |
| Fe ii | 16436 | 6.100.29e | - | - | 2.820.47c | 7.921.55c | 41.03.60c | 2.450.45c | - | 6.420.97c | 56.21.96c |
| H i | 18750 | 12.590.40 | - | - | 15.200.53 | 50.502.71 | - | 106.561.40 | - | - | - |
| H i | 18750(b) | 40.241.02 | - | - | 31.422.37 | 204.608.74 | 212.114.38ad | 138.663.05 | 139.531.84a | 111.494.27ad | 581.5012.04ad |
| H i | 19446 | - | - | - | - | - | - | 1.440.52 | - | - | 6.021.16?? |
| H i | 19446(b) | 2.030.14a | - | - | - | 31.144.07a | - | 21.381.08 | 7.582.05a | 8.520.36a | 17.924.32 |
| 19570 | 3.800.23e | 6.570.64e | 2.880.36e | 0.910.16c | - | 20.81.2c | - | 9.172.84 | 7.510.62c | 21.22.0c | |
| Si vi | 19641 | - | - | 5.690.62 | - | - | - | 3.090.36 | 1.230.37 | 12.541.19 | 68.712.05 |
| 20332 | 1.350.08e | 2.220.35e | 0.590.12e | 0.360.05c | - | 7.970.92c | - | - | 2.820.70c | 6.840.42c | |
| He i | 20580 | - | - | - | - | - | - | - | - | - | - |
| He i | 20580(b) | 2.090.02a | - | - | - | - | 5.711.43a | - | - | - | - |
| 21213 | 2.720.17e | 3.891.16e | 2.040.10e | 0.900.12c | - | 17.71.00c | - | - | 5.810.37 | 14.70.55c | |
| H i | 21654 | 4.690.15fe | - | - | - | - | 6.511.34 | 2.490.37 | - | - | 12.420.63 |
| H i | 21654(b) | - | - | 0.780.06ae | 2.490.55ca | 32.001.50ca | 21.546.31 | 22.461.02 | 13.330.73a | 13.10.84ca | 31.412.64 |
| 22230 | - | - | - | 0.280.08c | - | 3.670.66c | - | - | 1.520.40c | 5.040.62c | |
| 22470 | - | - | - | - | - | 2.320.21c | 0.240.08c | - | - | - | |
| Ca viii | 23218 | - | - | - | - | 5.661.61 | - | - | - | 2.360.44 | 15.091.02 |
| a Total Flux of the line. | |||||||||||
| b Broad Component of the line. | |||||||||||
| c Rodríguez-Ardila et al. (2004) | |||||||||||
| d Teluric absorption | |||||||||||
| e Rodríguez-Ardila, Riffel & Pastoriza (2005) | |||||||||||
| f Total flux. Line without broad component. | |||||||||||
| h Blend with Fe ii 9177 and Fe ii 9202. | |||||||||||
| i Blend with Fe ii 9999. | |||||||||||
| j Blend with Fe ii 10171. | |||||||||||
| k Blend with Fe ii 9202. | |||||||||||
| Ion | NGC 4748 | Mrk 279 | NGC 5548 | PG 1415+451 | Mrk 684 | Mrk 478 | PG 1448+273 | Mrk 291 | Mrk 493 | PG 1519+226 | |
|---|---|---|---|---|---|---|---|---|---|---|---|
| O i | 8446 | - | 32.167.67ξ | 12.521.46 | - | - | - | 17.170.80 | 1.740.26 | 20.691.18 | 14.581.58 |
| Ca ii | 8498 | - | - | 11.451.62 | - | - | - | 9.271.53 | - | 12.511.64 | 9.142.10 |
| S iii | 9069 | 30.671.50 | 7.240.85 | 12.600.51 | - | - | 5.220.37 | 4.150.40 | 6.431.04 | 4.840.60 | - |
| Fe ii | 9127 | - | - | - | - | - | - | - | 3.650.79 | - | |
| Fe ii | 9177 | 2.570.61k | - | - | - | - | - | 1.950.23 | 1.980.40 | - | |
| Fe ii | 9202 | - | - | - | - | - | - | 1.580.26 | 1.570.28 | - | |
| H i | 9230 | - | - | - | - | - | - | 2.780.29 | - | - | - |
| H i | 9230(b) | 38.418.92a | - | - | - | 19.233.06ah | 11.521.84ah | 9.770.88 | - | 21.842.45ah | 11.001.85ah |
| S iii | 9531 | 90.230.67 | 39.980.55 | 33.690.81 | - | 10.582.14 | 27.250.68 | 18.580.66 | 6.830.40 | 16.701.10 | 8.841.73d |
| C i | 9824 | - | - | - | - | - | - | 2.070.20 | - | - | 0.350.07d |
| C i | 9850 | - | 2.470.24 | - | - | - | - | 1.000.09 | - | - | 0.860.17 |
| S viii | 9910 | 8.232.52 | - | 5.990.44 | - | - | - | 0.660.06 | - | - | 0.670.12 |
| Fe ii | 9999 | 9.151.45 | 5.160.29d | - | - | 8.341.02 | 2.740.42 | 3.080.50 | - | 4.330.74 | - |
| H i | 10049 | - | - | 1.190.21 | - | - | 6.310.55 | 6.600.40 | - | 6.860.69 | - |
| H i | 10049(b) | 45.612.69a | - | 35.303.13 | - | 12.081.31a | 35.542.02 | 18.132.16 | - | 5.472.25 | 5.810.85a |
| He ii | 10122 | - | - | - | - | - | - | 1.080.28 | - | - | - |
| He ii | 10122(b) | 13.981.47a | - | 4.000.37a | - | - | - | 0.570.20 | - | - | - |
| Fe ii | 10171 | - | - | - | - | - | - | 3.110.39 | - | 1.680.08 | - |
| S ii | 10286 | - | - | 1.180.14 | - | - | - | - | - | - | - |
| S ii | 10320 | - | - | 1.720.14 | - | - | - | - | - | - | - |
| S ii | 10336 | - | - | 0.830.14 | - | - | - | - | - | - | - |
| S ii | 10370 | - | - | 0.230.14 | - | - | - | - | - | - | - |
| N i | 10404 | - | - | 1.040.21 | - | - | 2.260.17 | - | - | - | - |
| Fe ii | 10500 | - | - | - | 1.360.21 | 7.181.77 | 7.960.56 | 3.110.39 | - | 2.780.27 | 2.900.87 |
| He i | 10830 | 46.221.17 | - | 69.881.56 | - | - | 44.381.71 | 16.870.19 | 3.960.32 | 10.870.28 | 12.610.44 |
| He i | 10830(b) | 101.764.81 | 134.835.24a | 131.5111.66 | 31.771.60a | 39.462.40a | 60.575.11 | 26.740.55 | 5.632.40 | 27.310.84 | 26.341.34 |
| H i | 10938 | 20.902.22 | - | - | - | - | 18.671.57 | 12.010.22 | - | 7.410.28 | 4.910.39 |
| H i | 10938(b) | 19.892.52 | 27.053.98a | 5.571.76a | 10.191.21a | 24.962.36 | 22.723.76 | 15.570.79 | 2.340.38a | 14.580.95 | 9.651.06 |
| Fe ii | 11126 | - | - | 1.840.42 | - | - | 3.520.46 | 1.640.17 | 0.850.20 | 1.860.10 | - |
| O i | 11287 | 23.172.13 | - | - | 4.310.96 | 9.161.83 | 23.030.36 | 11.330.53 | - | 10.280.54 | 7.040.62d |
| P ii | 11460 | - | - | - | - | - | - | - | - | - | - |
| P ii | 11886 | - | - | - | - | - | - | - | - | - | - |
| S ix | 12520 | - | 1.840.48 | 2.790.37 | - | - | - | - | - | - | - |
| Fe ii | 12570 | 7.390.37c | 7.220.46c | 1.710.26c | - | - | - | - | 0.910.24c | 1.960.34c | - |
| H i | 12820 | 7.730.62 | 1.430.26 | 5.340.30 | - | 14.610.49 | - | - | 2.560.22 | 12.890.52 | 10.160.50 |
| H i | 12820(b) | 60.122.20 | 55.872.51 | 49.302.91 | 19.280.84a | 13.481.17 | 82.70cd | - | 2.760.85 | 16.101.82 | 13.061.21 |
| Fe ii | 13201 | 3.080.22 | - | - | - | - | - | - | - | - | - |
| Si x | 14300 | - | - | 5.570.38 | - | - | - | - | - | - | - |
| Fe ii | 16436 | 7.850.61c | 5.360.61c | 1.300.14c | - | - | - | - | 0.800.09c | 1.400.27c | - |
| H i | 18750 | 43.240.57 | - | - | - | 24.760.46 | 31.150.60 | 26.981.17 | 9.440.20 | 23.830.51 | 9.800.39 |
| H i | 18750(b) | 78.262.49 | 17.450.50a | 78.87ad | 21.350.73a | 17.211.46 | 55.631.70 | 2.400.10 | 4.041.25 | 14.181.71 | 17.791.06 |
| H i | 19446 | 2.240.30 | - | - | - | - | - | - | - | - | - |
| H i | 19446(b) | 8.900.99 | - | - | - | - | 7.630.63a | 2.400.10a | - | - | - |
| 19570 | 1.900.42c | 0.67cd | - | - | - | 3.730.40c | 0.930.07c | 0.300.12c | - | - | |
| Si vi | 19641 | 8.960.29 | - | 9.970.86 | - | - | - | 1.000.07 | - | - | - |
| 20332 | - | 1.040.16c | - | - | - | - | 0.370.08c | 0.220.07c | 0.320.07c | - | |
| He i | 20580 | - | - | - | - | - | - | - | - | - | - |
| He i | 20580(b) | 1.430.08a | - | - | - | - | - | 0.420.10a | 0.470.05a | - | - |
| 21213 | 1.590.20c | 1.890.23c | 0.800.11c | - | - | 1.260.15c | 0.450.08c | 0.470.10c | 1.040.20c | - | |
| H i | 21654 | 1.410.11 | 0.630.36 | - | - | 1.680.36 | 1.130.23 | 1.450.16 | 0.360.04 | 0.850.12 | - |
| H i | 21654(b) | 9.650.49 | 8.862.28 | 16.272.0ca | - | 3.661.01 | 6.290.62 | 2.630.38 | 0.910.13 | 1.770.25 | - |
| 22230 | - | 0.620.15c | - | - | - | - | - | - | - | - | |
| 22470 | 0.400.13c | 0.560.15c | - | - | - | - | - | - | - | - | |
| Ca viii | 23218 | - | - | 1.660.38 | - | - | - | - | - | - | - |
| a Total Flux of the line. | |||||||||||
| b Broad Component of the line. | |||||||||||
| c Rodríguez-Ardila et al. (2004) | |||||||||||
| d Teluric absorption | |||||||||||
| e Rodríguez-Ardila, Riffel & Pastoriza (2005) | |||||||||||
| f Total flux. Line without broad component. | |||||||||||
| Blend 8446+8498 | |||||||||||
| h Blend with Fe ii 9177 and Fe ii 9202. | |||||||||||
| k Blend with Fe ii 9202. | |||||||||||
| Ion | PG 1612+261 | Mrk 504 | Arp 102B | 1 H 1934-063 | Mrk 509 | Mrk 896 | 1 H 2107-097 | Ark 564 | NGC 7469 | |
|---|---|---|---|---|---|---|---|---|---|---|
| O i | 8446 | 16.401.20 | 4.571.24 | - | 40.571.49 | 1946.3992.08ξ | 21.782.79 | 35.164.53 | 47.351.30 | 67.803.36 |
| Ca ii | 8498 | - | - | - | 29.182.42 | - | - | 6.293.67 | 39.222.50 | - |
| S iii | 9069 | 7.860.21 | 2.970.51 | 9.491.51 | 27.250.85 | 276.4612.18 | - | - | 18.970.52 | 43.490.24 |
| Fe ii | 9127 | - | - | - | 4.070.69 | - | - | 5.630.39 | 4.230.38 | 3.430.21 |
| Fe ii | 9177 | - | - | - | 8.770.96 | - | - | 4.730.33 | 5.180.47 | 3.330.18 |
| Fe ii | 9202 | - | - | - | 3.120.34 | - | - | 16.121.13 | 5.300.48 | 3.380.19 |
| H i | 9230 | - | - | - | - | - | - | - | - | - |
| H i | 9230(b) | 13.361.40ah | - | - | 25.562.04a | 320.5912.18ah | - | 21.681.51a | 52.784.75a | 40.733.90 |
| S iii | 9531 | 26.160.92 | 7.170.45 | 16.070.68 | 82.951.18 | 379.3114.90 | 7.850.68 | 16.841.06 | 55.390.82 | 139.793.18 |
| C i | 9824 | 0.390.02 | - | 1.770.53 | - | - | - | - | - | 3.340.52 |
| C i | 9850 | 0.560.03d | 0.330.05 | 3.680.53 | 2.750.75 | - | - | - | 0.760.16 | 9.810.52 |
| S viii | 9910 | 1.080.04 | 0.590.05 | - | 9.761.10 | - | - | - | 5.940.35 | 5.620.83 |
| Fe ii | 9999 | 4.540.64 | - | - | 23.701.18 | - | 4.140.75 | - | 20.360.58 | - |
| H i | 10049 | - | 1.110.10 | - | - | - | - | - | 16.130.37 | 5.120.37 |
| H i | 10049(b) | 12.980.70a | 12.140.61 | - | 28.410.79a | - | 6.980.70a | 104.426.07a | 27.741.12 | 96.932.30 |
| He ii | 10122 | - | - | - | 18.671.24 | - | - | - | 6.940.43 | 8.720.52 |
| He ii | 10122(b) | 7.390.86a | 0.980.13a | 0.680.38a | - | - | 2.491.04a | 2.451.03a | 12.731.28 | 13.091.57 |
| Fe ii | 10171 | - | - | - | 3.940.77 | - | - | - | 3.500.58 | - |
| S ii | 10286 | 0.940.06 | - | - | 1.350.19 | - | - | - | 0.880.21 | 4.480.12 |
| S ii | 10320 | 0.850.06 | - | - | 1.610.19 | - | - | - | 1.810.21 | 4.510.12 |
| S ii | 10336 | 0.240.06 | - | - | 0.800.19 | - | - | - | 1.460.21 | 1.350.12 |
| S ii | 10370 | 0.420.06 | - | - | 0.320.19 | - | - | - | 0.920.21 | 1.240.12 |
| N i | 10404 | - | - | - | - | - | - | - | 2.540.40 | 2.820.14 |
| Fe ii | 10500 | - | - | - | - | 59.662.98 | 2.050.30 | 10.862.67 | 13.050.58 | 9.883.00 |
| He i | 10830 | 22.590.63 | 12.220.39 | 9.971.59 | 52.960.53 | - | 5.470.37 | 55.501.06 | 43.850.68 | 115.901.38 |
| He i | 10830(b) | 63.542.59 | 26.671.15 | 33.507.88 | 70.281.58 | 6355.7669.69a | 8.091.11 | 196.794.16 | 85.962.85 | 327.625.69 |
| H i | 10938 | 17.261.39 | 1.300.27 | - | 25.320.63 | - | - | - | 23.160.69 | 30.832.23 |
| H i | 10938(b) | 23.414.09 | 16.101.15 | - | 28.321.57 | 2205.0664.87a | 3.701.49a | 71.672.75a | 39.272.04 | 160.916.88 |
| Fe ii | 11126 | - | 0.980.08 | - | 3.820.76 | - | - | - | 5.570.40 | - |
| O i | 11287 | 7.080.51 | 3.390.15 | - | 26.831.24 | - | 7.490.41 | 17.321.61 | 34.660.36 | 38.870.42 |
| P ii | 11460 | - | - | - | 7.740.39 | - | - | - | - | 4.750.25 |
| P ii | 11886 | - | - | - | - | - | - | - | 1.870.29 | 7.081.03 |
| S ix | 12520 | 0.960.11 | - | - | 7.830.40 | - | - | - | 6.880.38 | 6.101.06 |
| Fe ii | 12570 | 3.560.25c | - | 9.660.81e | 3.480.23 | - | - | - | 3.870.44c | 12.440.69e |
| H i | 12820 | 10.700.56 | - | - | 43.620.61 | 1125.2630.16 | 3.430.26 | 71.661.97 | 43.160.45 | 31.661.74e |
| H i | 12820(b) | 38.321.72 | 21.81.22ca | - | 36.151.81 | 1824.6777.87 | 17.950.80 | 67.505.69 | 59.031.54 | 153.087.27 |
| Fe ii | 13201 | - | - | - | 1.350.43 | - | - | - | - | - |
| Si x | 14300 | 1.140.16 | - | - | 8.571.10 | - | - | 2.460.63 | 17.770.54 | 11.391.30 |
| Fe ii | 16436 | - | - | 7.250.41e | 5.461.12 | - | - | - | 3.900.65c | 9.870.68e |
| H i | 18750 | 13.230.23 | 9.570.37 | - | 72.880.52 | - | 2.710.26 | 90.901.82 | 55.030.86 | 25.841.55 |
| H i | 18750(b) | 63.881.05 | 16.371.00 | 7.13ad | 28.111.81 | 3721.1430.16ad | 31.381.21 | 78.764.63 | 50.742.82 | 206.4811.56 |
| H i | 19446 | 4.100.45 | - | - | - | - | - | - | 3.070.18 | 1.850.25 |
| H i | 19446(b) | - | - | - | 5.770.67a | - | - | - | 5.900.59 | 2.460.44 |
| 19570 | - | - | 1.710.20e | 3.670.78 | - | 0.41cd | - | 0.800.22c | 16.040.61e | |
| Si vi | 19641 | 3.160.20 | - | - | 7.640.61 | - | - | 1.490.61 | 6.160.30 | 12.360.46 |
| 20332 | - | 0.150.04c | 0.660.11e | - | - | 0.420.13c | - | 0.530.18c | 3.280.23e | |
| He i | 20580 | - | - | - | - | - | - | - | - | 1.420.29 |
| He i | 20580(b) | - | - | - | 2.450.33a | - | - | - | - | 4.951.78 |
| 21213 | 0.760.17c | 0.350.06c | 1.770.16e | 0.590.25 | - | 0.410.10c | - | 1.240.27 | 8.740.28e | |
| H i | 21654 | - | - | - | - | - | 0.370.09 | 14.571.16 | 4.760.16 | 4.520.28e |
| H i | 21654(b) | - | 18.060.72ca | - | 9.630.60a | 381.9633.25a | 2.780.43 | 7.933.09 | 5.700.43 | 20.661.41 |
| 22230 | - | 0.200.06c | 0.310.09e | - | - | - | - | - | 2.020.53e | |
| 22470 | - | - | - | - | - | 0.200.06c | - | - | 1.550.53e | |
| Ca viii | 23218 | - | - | - | 2.550.37 | - | - | 1.460.30 | 3.090.54 | 1.90 |
| a Total Flux of the line. | ||||||||||
| b Broad Component of the line. | ||||||||||
| c Rodríguez-Ardila et al. (2004) | ||||||||||
| d Teluric absorption | ||||||||||
| e Rodríguez-Ardila, Riffel & Pastoriza (2005) | ||||||||||
| f Total flux. Line without broad component. | ||||||||||
| h Blend with Fe ii 9177 and Fe ii 9202. | ||||||||||
| Blend 8446+8498 | ||||||||||
| Ion | NGC 34 | NGC 262 | Mrk 993 | NGC 591 | Mrk 573 | NGC 1144 | Mrk 1066 | NGC 1275 | NGC 1614 | |
|---|---|---|---|---|---|---|---|---|---|---|
| S iii] | 9069 | 16.572.90 | 47.760.68 | 7.110.98 | 34.951.05 | 38.921.09 | 3.770.23 | 65.660.52 | 72.932.39 | 100.391.57 |
| S iii] | 9531 | 18.471.01 | 128.131.20 | 16.510.07 | 92.630.95 | 108.650.69 | 7.110.16 | 178.791.02 | 188.731.55 | 278.661.22 |
| C i] | 9824 | 2.550.94 | 1.700.52 | 0.360.11 | 3.380.70 | 0.590.05 | - | 5.720.27 | 5.380.57 | - |
| C i] | 9850 | 7.400.94 | 4.130.52 | 2.100.20 | 7.230.70 | 2.571.23 | - | 12.540.27 | 17.260.59 | - |
| S viii] | 9910 | - | 2.650.59 | 0.760.17 | 2.520.23 | 6.100.10 | - | - | - | - |
| H i | 10049 | - | 2.260.52 | - | 2.540.58 | 3.270.16 | - | 9.740.30 | 13.321.08 | 17.280.67 |
| He ii | 10122 | - | 3.780.54 | - | 4.280.83 | - | - | 5.360.55 | 4.000.78 | - |
| S ii] | 10286 | - | 5.850.55 | - | 1.980.57 | 3.580.22 | - | 5.520.38 | 33.051.30 | - |
| S ii] | 10320 | - | 8.180.55 | - | 4.520.57 | 2.780.22 | - | 7.880.38 | 42.161.30 | - |
| S ii] | 10336 | - | 4.020.55 | - | 1.910.57 | 1.670.22 | - | 3.760.38 | 34.651.30 | - |
| S ii] | 10370 | - | 2.060.55 | - | 1.860.57 | 1.220.22 | - | 2.160.38 | 17.641.30 | - |
| N i] | 10404 | - | 1.940.38 | - | 1.990.73 | 1.800.44 | - | 1.540.36 | 42.821.38 | - |
| He i | 10830 | 20.711.30 | 66.980.61 | 32.411.89 | 53.200.75 | 50.950.40 | - | 102.691.39 | 588.475.14 | 238.514.60 |
| H i | 10938 | - | 5.820.62 | 15.392.46 | 5.700.56 | 6.110.41 | - | 25.531.20 | 83.534.25 | 53.674.79 |
| P ii] | 11470 | - | 1.710.36 | - | - | 2.170.19 | - | 4.510.20 | 5.210.41 | - |
| He ii | 11626 | - | 0.760.19 | - | - | 1.770.12d | - | 1.510.30 | 3.240.39 | - |
| P ii] | 11886 | 8.852.33 | 3.680.39 | - | 5.350.77 | 2.180.69d | - | 16.311.45 | 18.950.50 | - |
| S ix] | 12520 | - | 2.280.58 | - | - | 4.850.13 | - | 4.810.32 | - | - |
| Fe ii] | 12570 | 13.761.24e | 11.590.52e | 5.050.30e | 17.190.75e | 5.900.14e | 0.910.23e | 38.530.25e | 63.491.51e | 35.021.22e |
| H i | 12820 | 12.831.13e | 10.750.33e | 14.902.66e | 15.140.49e | 9.580.17e | - | 54.070.24e | 60.663.15e | 129.281.14e |
| Fe ii] | 12950 | - | 1.610.33 | - | 2.150.40 | - | - | 5.590.71 | 12.132.62 | - |
| Fe ii] | 13209 | - | 3.340.81 | - | 6.411.09 | - | - | 13.700.54 | 18.481.64 | - |
| Si x] | 14300 | - | 2.030.50 | - | 3.160.42 | 7.540.25 | - | 4.251.07 | - | - |
| Fe ii] | 15342 | - | 2.320.22 | - | - | - | - | 6.610.64 | 8.820.94 | - |
| Fe ii] | 16436 | 11.002.87e | 9.090.31e | - | 14.190.73e | 4.110.09e | - | 37.070.34e | 61.490.65e | 20.842.91e |
| Fe ii] | 16773 | - | - | - | - | - | - | 3.970.50 | 8.970.53 | - |
| H i | 16806 | - | - | - | - | - | - | 3.980.55 | - | - |
| H i | 18750 | 62.750.43 | 35.261.05 | - | 60.100.77 | 45.570.28 | - | 145.741.60 | 145.142.52 | 295.456.86 |
| H i | 19446 | - | - | - | 0.930.08 | 1.370.06 | - | 8.670.04 | 13.982.06 | 20.503.48 |
| 19570 | 12.431.02e | 2.090.18e | 1.630.10e | 6.820.63e | 1.440.17e | - | 15.170.38e | 43.150.67e | 11.183.97e | |
| Si vi] | 19641 | - | 4.430.19 | - | 8.070.76 | 10.170.18 | - | 3.530.34 | - | - |
| 20332 | 4.660.23e | 0.600.09e | 0.920.12e | 2.660.22e | 0.750.24e | 0.470.06e | 4.830.10e | 15.260.33e | - | |
| He i | 20580 | - | - | - | 1.420.19 | 0.530.06 | - | 6.830.19 | 9.621.14 | 25.990.56 |
| 21213 | 12.151.27e | 1.610.05e | 1.010.17e | 6.520.14e | 1.820.19e | 0.940.04e | 13.410.16e | 42.950.37e | 5.700.77e | |
| H i | 21654 | 7.120.13e | 1.090.11e | - | 3.550.22e | 2.770.09e | - | 14.160.22e | 9.770.41e | 42.450.74e |
| 22230 | - | - | - | 1.770.16e | - | - | 2.660.06e | 11.810.30e | - | |
| 22470 | - | - | - | 0.700.16e | - | - | 1.770.03e | 4.510.33e | - | |
| Ca viii] | 23218 | - | - | - | - | 3.180.29 | - | - | - | - |
| Table 4. continued. | ||||||||||
| Ion | NGC 2110 | ESO 428-G014 | NGC 3310 | NGC 5728 | NGC 5929 | NGC 5953 | NGC 7674 | NGC 7682 | NGC 7714 | |
| S iii] | 9069 | 50.081.63 | 143.160.89 | 35.211.82 | - | 14.701.22 | 18.212.73 | 56.851.68 | 32.271.01 | 82.462.57 |
| S iii] | 9531 | 125.390.88 | 371.272.39 | 92.451.33 | 62.150.70 | 34.320.95 | 34.852.32 | 143.235.73 | 85.250.35 | 202.451.54 |
| C i] | 9824 | 8.380.64 | 7.500.32 | - | - | - | - | - | - | 2.720.54 |
| C i] | 9850 | 20.670.64 | 12.760.32 | - | - | - | - | 6.840.64 | - | 3.180.35 |
| S viii] | 9910 | - | 6.030.31 | - | - | - | - | 4.030.98 | 1.690.71 | - |
| H i | 10049 | 3.000.27 | 9.190.63 | 3.440.51 | 5.451.42 | - | - | 8.380.67 | 1.180.18 | 11.470.63 |
| He ii | 10122 | - | 20.180.80 | 12.591.34 | 7.031.58 | - | 4.91.05 | 10.210.67 | 3.620.31 | - |
| S ii] | 10286 | 16.891.16 | 9.530.20 | - | - | - | - | 4.580.60 | 3.910.77 | - |
| S ii] | 10320 | 19.751.16 | 13.450.20 | - | - | - | - | 4.730.60 | 5.390.77 | - |
| S ii] | 10336 | 13.501.16 | 7.550.20 | - | - | - | - | 3.090.60 | 2.310.77 | - |
| S ii] | 10370 | 8.401.16 | 2.530.20 | - | - | - | - | 0.490.60 | 1.960.77 | - |
| N i] | 10404 | 25.941.65 | 0.910.12 | - | - | - | - | 6.261.45 | 2.091.00 | - |
| He i | 10830 | 102.301.00 | 178.010.90 | - | 32.691.38 | 20.700.69 | 18.731.63 | 56.480.57 | 49.091.50 | 128.832.39 |
| H i | 10938 | 12.661.03 | 31.041.15 | - | 3.801.05 | 3.790.27d | - | 13.871.31 | 4.981.12 | 26.702.12 |
| P ii] | 11470 | - | 4.550.71 | - | - | - | - | 1.520.13 | - | - |
| He ii | 11626 | - | 2.920.51 | - | - | - | - | 0.650.08 | - | - |
| P ii] | 11886 | 14.492.75 | 15.180.74 | - | - | - | - | 5.690.30 | - | - |
| S ix] | 12520 | - | 5.150.80 | - | 1.190.59 | - | - | 4.111.48 | - | - |
| Fe ii] | 12570 | 81.241.02e | 30.240.62e | 10.700.87c | 5.080.50c | 8.440.36e | 19.060.66e | 10.810.92e | 4.580.74e | 17.350.53e |
| H i | 12820 | 14.910.86e | 45.260.57e | 31.741.03c | 7.371.16c | 7.680.20e | - | 10.360.58e | 9.920.65e | 59.731.38 |
| Fe ii] | 12950 | 13.031.18 | 5.940.89 | - | - | - | - | - | - | - |
| Fe ii] | 13209 | 30.760.63 | 22.262.06 | - | - | 3.500.76 | 13.892.11 | - | - | - |
| Si x] | 14300 | - | - | - | - | - | - | 3.530.25 | - | - |
| Fe ii] | 15342 | 14.621.33 | 7.820.82 | - | - | - | - | - | - | - |
| Fe ii] | 16436 | 70.170.55e | 28.471.05e | 11.121.57c | 4.960.61c | 7.830.37e | 15.211.89e | 9.740.47e | - | 14.842.08e |
| Fe ii] | 16773 | 8.801.18 | 3.830.20 | - | - | - | - | 24.075.31 | - | - |
| H i | 16806 | - | 8.220.29 | - | - | - | - | 25.664.52 | - | - |
| H i | 18750 | 32.954.50 | 102.050.78 | 112.981.57 | 20.631.92 | - | 19.820.83 | 32.061.09 | 31.820.81 | 117.942.35 |
| H i | 19446 | - | 3.000.49 | 4.040.83 | - | - | - | 3.380.51 | - | - |
| 19570 | 11.350.28e | 8.290.55e | - | 6.040.56c | 3.070.60e | 6.671.85ed | 4.050.56e | 9.400.51e | - | |
| Si vi] | 19641 | - | 21.090.66 | - | 7.080.88 | - | - | 10.711.11 | 2.960.63 | - |
| 20332 | 4.220.21e | 3.060.27e | 1.240.25c | 2.400.20c | 1.330.23e | 2.280.72e | 1.200.23e | 3.500.22e | - | |
| He i | 20580 | 1.670.22 | 2.140.08 | 6.690.52 | - | - | - | 1.270.27 | - | 8.830.31 |
| 21213 | 8.390.19e | 8.270.12e | 1.540.32c | 6.280.12c | 2.880.22e | 3.540.51e | 2.120.12e | 9.780.14e | 3.310.43e | |
| H i | 21654 | 2.500.22e | 8.980.14e | 10.790.33c | 2.110.19c | 1.350.25e | - | 3.130.25e | 1.940.11e | 15.470.28 |
| 22230 | 2.700.36 | - | - | 1.680.20c | 0.800.26e | - | - | 2.510.30e | - | |
| 22470 | - | - | - | 0.890.20c | - | - | 0.670.11e | - | - | |
| Ca viii] | 23218 | - | - | - | - | - | - | 1.450.14 | - | - |
| a Total Flux of the line. | ||||||||||
| c Rodríguez-Ardila et al. (2004) | ||||||||||
| d Teluric absorption | ||||||||||
| e Rodríguez-Ardila, Riffel & Pastoriza (2005) | ||||||||||