THE DIPOLE ANISOTROPY OF THE 2MASS REDSHIFT SURVEY
We estimate the flux weighted acceleration on the Local Group (LG) from the near-infrared Two Micron All Sky Redshift Survey (2MRS). The near-infrared flux weighted dipoles are very robust because they closely approximate a mass weighted dipole, bypassing the effects of redshift distortions and require no preferred reference frame. We use this method with the redshift information to determine the change in dipole with distance. The LG dipole seemingly converges by 60 . Assuming convergence, the comparison of the 2MRS flux dipole and the CMB dipole provides a value for the combination of the mass density and luminosity bias parameters
.
1 Introduction
The most popular mechanism for the formation of large-scale structure and motions in the Universe is the gravitational growth of primordial density perturbations. According to this paradigm, the peculiar acceleration vector is induced by the matter distribution around position and if the density perturbations are small enough to be approximated by a linear theory, then the peculiar velocity field, , is proportional to the peculiar acceleration:
| (1) |
where = 100 is the Hubble constant and is the logarithmic derivative of the amplitude of the growing mode of the perturbations in mass with respect to the scale factor (Peebles 1980).
It is now widely accepted that the dipole anisotropy of the cosmic microwave background (CMB) is a direct and accurate measurement of the LG peculiar velocity. The LG acceleration can also be estimated using surveys of the galaxies tracing the density inhomogeneities responsible for the acceleration. If the mass can be related to light by a bias parameter, , then by comparing the CMB velocity vector with the acceleration vector obtained from the galaxy surveys, it is possible to investigate the cause of the LG motion and its cosmological implications.
Like peculiar acceleration, the flux of light received from a galaxy falls off inversely as the square of the distance. If the mass-to-light ratio is constant, we can relate the two by
| (2) | |||||
where the sum is over all galaxies in the Universe, is the average mass-to-light ratio and is the flux of galaxy . The peculiar velocity vector is derived by substituting Equation 2 into the second line of Equation 1. For a flux limited catalogue the observed LG velocity is
| (3) |
where is the luminosity bias factor introduced to account for the dark matter haloes not fully represented by 2MRS galaxies and is the weight assigned to galaxy to account for the luminosity that was not observed due to the flux limit of the survey. With the inclusion of redshift information, we can calculate Equation 3 within concentric spheres with increasing radii and thus estimate the distance at which most of the LG velocity is generated generated (the convergence depth).
2 The Two Micron All-Sky Redshift Survey
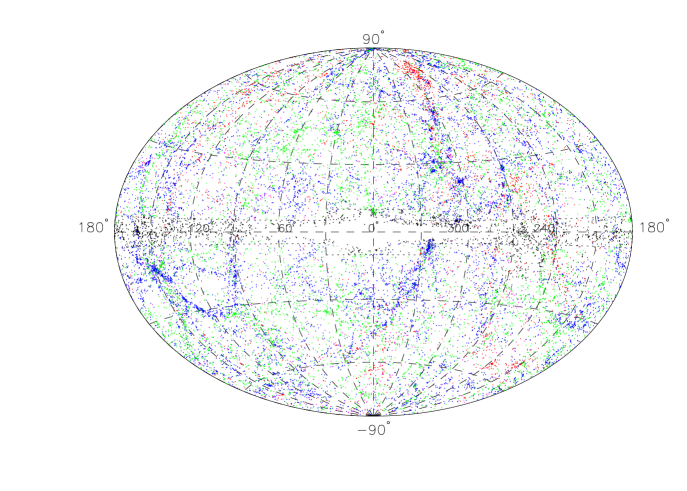
The Two Micron All-Sky Redshift Survey (Huchra et al. 2005, Erdoğdu et al. 2006) is the densest all-sky redshift survey to date. The first phase of 2MRS is now complete. In this phase we obtained redshifts for approximately 23,150 2MASS galaxies from a total sample of 24,773 galaxies with extinction corrected magnitudes (Schlegel, Finkbeiner & Davis 1998) brighter than . This magnitude limit corresponds to a median redshift of ( 6000 ). Figure 1 shows all the objects in 2MRS in Galactic Aitoff Projection. Galaxies with are plotted in red, are plotted in blue, are plotted in green and are plotted in magenta. Galaxies without measured redshifts (around 1600) are plotted in black.
The 2MRS sample has very good photometric uniformity and an unprecedented integral sky coverage. The photometric uniformity is better than over the sky including the celestial poles and the survey is essentially complete down to very low galactic latitudes (Huchra et al. 2005). In order to account for incompleteness at these galactic latitudes we fill the plane with galaxies sampled from adjacent longitude/distance bins.
3 Results
Figure 2 shows the three components and the magnitudes of the acceleration of the Local Group due to galaxies within a series of successively larger concentric spheres centred on the local group (top plot). The bottom plot shows convergence of the direction of the LG dipole where the misalignment angle is between the LG and the CMB dipoles ( , towards , , Bennett et al. 2003, Courteau & Van Den Bergh, 1999).

It is evident in the top plot that the LG velocity is dominated by structures within a distance of 6000 . The ‘tug of war’ between the Great Attractor and the Perseus-Pisces is clearly evident. The dip in the velocity vector is an indication that the local flow towards the Great Attractorbbb By ‘Great Attractor’, it is meant the entire steradian on the sky centred at (,) covering a distance of 20 Mpc to 60 Mpc. is counteracted by the Perseus-Pisces complex in the opposite direction. The dipole seems to converge by 6000 .
The misalignment angle between the LG and the CMB dipole is smallest at 5000 where it drops to 127∘ and increases slightly at larger distances presumably due to shot-noise. The direction of the flux dipole (l=25112∘,b=37 10 ∘) is in good agreement with the 2MASS dipole derived by Maller et al. (2003). The difference in results is probably due to the fact that they use a higher latitude cutoff in the mask () and exclude all galaxies below this latitude. We confirm this by changing our treatment of the Zone of Avoidance to match theirs. We find that the flux dipole is very close to their dipole direction. Their limiting Kron magnitude is which corresponds to an effective depth of 200 Mpc. As their sample is deep enough to pick out galaxies in the Shapley Supercluster, the comparison of their dipole value with our values suggests that the contribution to the LG dipole from structure further away than the maximum distance of our analysis is not significant.
Assuming convergence, we equate the velocity inferred from the CMB measurements with the value derived from a galaxy survey and obtain a value for the combination of the mass density and luminosity bias parameters: . If we adopt from the WMAP3 results (Spergel et al. 2006) we get . This suggest that the 2MRS galaxies are unbiased.
A detailed description of the analysis and results outlined in this paper can be found in Erdoğdu et al. (2006).
Acknowledgments
OL acknowledges a PPARC Senior Research Fellowship. JPH, LM, CSK, NM, and TJ are supported by NSF grant AST-0406906, and EF’s research is partially supported by the Smithsonian Institution. DHJ is supported as a Research Associate by Australian Research Council Discovery-Projects Grant (DP-0208876), administered by the Australian National University. This publication makes use of data products from the Two Micron All Sky Survey, which is a joint project of the University of Massachusetts and the Infrared Processing and Analysis Center/California Institute of Technology, funded by the National Aeronautics and Space Administration and the National Science Foundation. This research has also made use of the NASA/IPAC Extragalactic Database (NED) which is operated by the Jet Propulsion Laboratory, California Institute of Technology, under contract with the National Aeronautics and Space Administration and the SIMBAD database, operated at CDS, Strasbourg, France.
References
References
- [1] Bennett C.L., et al. , 2003, ApJS, 148, 1
- [2] Courteau S. & Van Den Bergh S., 1999, AJ, 118, 337
- [3] Erdoğdu P., et al. , 2006, MNRAS, in press (astro-ph/0507166)
- [4] Huchra J., Jarrett T.H., Skrutskie M., Cutri R., Schneider S., Macri L., Steining R., Mader J., Martimbeau N., George T., 2005, in Nearby Large-Scale Structures and the Zone of Avoidance ASP Conference Series, eds. K.P. Fairall, P.A. Woudt, 329, 135
- [5] Maller A.H., McIntosh D.H., Katz N. & Weinberg M.D., 2003, ApJ, 598, L1
- [6] Peebles P.J.E., 1980, The Large-Scale Structure of the Universe, Princeton University Press, Princeton
- [7] Schlegel D.J., Finkbeiner D.P., Davis M., 1998, ApJ, 500, 525
- [8] Spergel D.N., et al. , 2006, submitted to ApJ