Chandra Observations of the X-ray Point Source Population in NGC 4636
Abstract
We present the X-ray point source population in the nearby Virgo elliptical galaxy NGC 4636 from three Chandra X-ray observations. These observations, totaling 193 ks after time filtering, were taken with the Advanced CCD Imaging Camera (ACIS) over a three year period. Using a wavelet decomposition detection algorithm, we detect 318 individual point sources. For our analysis, we use a subset of the 277 detections with net 10 cts (a limiting luminosity of approximately erg s-1 in the 0.5 – 2 keV band, outside the central bright galaxy core). We present a radial distribution of the point sources. Between 1.5′ and 6′ from the center, 25% of our sources are likely to be background sources (AGN) and 75% are LMXBs within the galaxy, while at radial distances greater than 6′, background sources (AGN) will dominate the point sources. We explore short and long-term variability (over time scales of 1 day to 3 years) for X-ray point sources in this elliptical galaxy. Fifty-four sources (24%) in the common ACIS fields of view show significant variability between observations. Of these, 37 are detected with at least 10 net counts in only one observation and thus may be “transient”. In addition, 10% of sources in each observation show significant short term variability; we present an example light curve for a variable bright source. The cumulative luminosity function for the point sources in NGC 4636 can be represented as a power-law of slope . We do not detect, but estimate an upper limit of erg s-1 to the current X-ray luminosity of the historical supernova SN1939A. We find 77 matches between X-ray point sources and globular cluster (GC) candidates found in deep optical images of NGC 4636. In the annulus from 1.5′ to 6′ of the galaxy center, 48 of the 129 X-ray point sources (37%) with 10 net counts are matched with GC candidates. Since we expect 25% of these sources to be background AGN, the percentage matched with GCs could be as high as 50%. Of these matched sources, we find that are associated with the redder GC candidates, those that are thought to have near-solar metal abundance. The fraction of GC candidates with an X-ray point source match decreases with decreasing GC luminosity. We do not find a correlation between the X-ray luminosities of the matched point sources and the luminosity or color of the host GC candidates. The luminosity functions of the X-ray point sources matched with GCs and those that are unmatched have similar slopes over erg s erg s-1. Finally, we present a color-color diagram based on ratios of X-ray flux rather than source counts, which yields a much tighter source distribution, and shows a large population of sources which are likely LMXBs and a small population of black hole candidates.
Subject headings:
galaxies: individual (NGC 4636) — X-rays: galaxies — X-rays: binaries1. Introduction
The sub-arcsecond resolution of the Chandra Observatory has revealed the nature of X-ray emitting point sources in nearby galaxies. It is clear that almost all the very luminous ( erg s-1) point sources in galaxies belong to two distinct populations of compact binaries, their evolutionary timescales depending upon that of their donor stars: the low-mass X-ray binaries (LMXB), which are long-lived and evolve on timescales of – yr, and high-mass X-ray binaries (HMXB), which evolve on timescales of – yr. The latter population is thus an indicator of recent star formation and is not expected to be found in early-type galaxies, unless a recent merger has occurred. The LMXB population, on the other hand, has lifetimes comparable with that of the host galaxy, and their number and combined luminosity is found to correlate well with the stellar mass of galaxies (Gilfanov 2004).
In this paper, we present a Chandra view of the X-ray point source population of NGC 4636, a bright E/S0 galaxy on the southern periphery of the Virgo cluster. It has a radial velocity similar to that of Virgo, but is 10.8∘ from the center of the cluster, which corresponds to 2.8 Mpc at a distance of 15 Mpc (Tonry et al. 2001). Furthermore, the galaxy lies at the center of a poor group (Osmond & Ponman 2004; Miles et al. 2004, 2005; Baldi et al. 2008), possibly falling into the cluster. Its unusual properties have attracted detailed multiwavelength research for several decades. It has been suggested that the galaxy has an unusually large dark halo (Loewenstein & Mushotzky 2003, Schuberth et al. 2006, Chakrabarty & Raychaudhury 2008). NGC 4636 was one of the first early-type galaxies in which neutral hydrogen was detected (Knapp et al. 1978), and further radio observations (Birkinshaw & Davies 1985) revealed a weak central radio source and small-scale jets. NGC 4636 has a large population of globular clusters similar to ellipticals of comparable luminosity (Dirsch et al. 2005). Its far-infrared luminosity greatly exceeds that expected from its stellar content (Temi et al. 2003), and the luminosity in the vicinity of 100 is consistent with dust emission from a recently accreted disk galaxy. Its flattened (E4) morphology at the outer faint isophotes (Sandage 1961) indicates the presence of large-scale angular momentum, often associated with recent mergers.
NGC 4636 is one the brightest nearby early-type galaxies in X-rays, and so it has been well-studied with generations of X-ray observatories. It was first detected as an extended X-ray source by Einstein (Forman et al. 1985). ROSAT and ASCA observations found abundance and temperature gradients in its extended X-ray halo (Trinchieri et al. 1994; Matsushita et al. 1997, Buote 2000), while Chandra and XMM-Newton observations (Jones et al. 2002; O’Sullivan et al. 2005) show symmetric arm features and cavities in the extended X-ray halo, interpreted to be evidence of past AGN activity.
The resolution of the Chandra observatory has enabled the detailed study of the environment of detected point sources (e.g. Fabbiano 2006 and references therein). Many of these are associated with globular clusters. Since it has been suggested that LMXBs may be primarily formed in the cores of globular clusters (White et al. 2002), the properties of point sources, along with those of their host GCs, may yield important clues to the role played by GCs in the formation of LMXBs (e.g. Maccarone et al. 2004. Kundu et al. 2007). On the other hand, there is some evidence that a significant fraction of LMXBs may be formed in the field, and are thus not expected to be associated with GCs (Juett 2005, Irwin 2005). The collective study of X-ray detected point sources and globular cluster candidates found in optical studies can thus yield important information concerning the origin of X-ray emitting binaries in galaxies.
We introduce the observations and discuss data reduction and point source detection in §2. In §3.1, we examine the distribution of sources in NGC 4636. In §3.2, we use soft, medium, and hard band source fluxes to make an X-ray color-color diagram which is independent of any instrumental or detector effects. In §3.3, we examine the X-ray point source population to look for variable sources on both long and short timescales. In §3.4, we present the luminosity function of X-ray point sources, and in §3.5, we optically identify sources associated with globular clusters and examine their properties. In §3.6, we examine a few interesting individual sources. Finally, our analysis and results are summarized in §4.
| Date | Detector | Sequence # | Exposure Time (s) |
|---|---|---|---|
| 2000 Jan 26 | ACIS-S | 600083 | 44450 |
| 2003 Feb 14 | ACIS-I | 600300 | 74709 |
| 2003 Feb 15 | ACIS-I | 600331 | 74190 |
2. Observations, Data Processing, and Point Source Detection
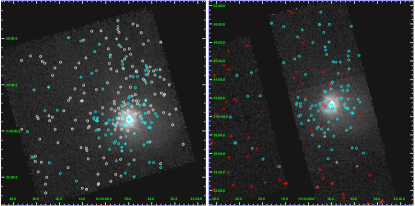
The observations presented in this paper were made with the ACIS-I and ACIS-S detectors on Chandra on three occasions spanning three years. The observations are summarized in Table 1.111We also analyzed a short (5 ks) ACIS-I observation (sequence #600084) taken in December 1999, but it yielded no sources that were not detected in the other observations, and the source counts in the few detections present were too low to allow meaningful analysis. Thus, we do not use this observation in the work discussed in the remainder of the paper. The FOV of each observation is overlaid on an optical DSS image in Figure 1.

We obtained level 1 event lists for the observations from the Chandra data archive. We filtered these event lists to include only the standard good grade set (ASCA grades 0,2,3,4 and 6) and to exclude bad pixels. The event lists were also filtered on the nominal good time intervals for each observation. Using the CIAO Contributed S-Lang Script lc_clean.sl, we did additional time filtering to remove times affected by background flaring. We set the script so as to first calculate an initial mean (3 sigma-clipped), then consider times with a count rate greater than 1.2 times this mean to be flaring. The remaining total good exposure times are listed in Table 1.
We created a 0.5 – 2 keV band image for each observation and used the wavelet decomposition algorithm wvdecomp (Vikhlinin et al. 1995) on the images to detect sources above a threshold of 4.5. With this detection threshold, and given the image sizes, we expect approximately 2 false detections per image (Vikhlinin et al. 1995). We considered a range of scales from 1 to 6 image pixels (equivalent to roughly 1 to 6 arcseconds, since 1 ACIS pixel 0.5′′ and we binned by a factor of 2). In addition, we co-added the two ACIS-I observations done sequentially in February 2003, and ran the source detection algorithm on this image. After detection, source locations were refined using a centroiding algorithm, and the 90% encircled energy radius, based on the preflight calibration model of the Chandra PSF, was determined for each source location. We manually examined the detected sources, looking at them in the ACIS images and in the individual scale wavelet decomposition images, and rejected some detections along the galaxy arms which appeared to be knots of hot gas rather than stellar point sources. We also rejected spurious detections along chip gaps.
For each observation, we constructed a 0.5 – 2 keV band background image by summing the large-scale (5 and 6) wavelet decompositions with the residual image (i.e. the image minus the total output of all scales used). For each source, we used a background region centered on the source coordinates with a radius of 1.5 times the 90% encircled count fraction radius for the source. We also made an exposure map for each observation. For each source detected in each observation, we tabulated raw and net (i.e. background-subtracted) counts, and raw and net exposure-corrected counts. We compared source positions between the observations, and matched sources whose coordinates agree within a dynamic matching radius dependent on the PSFs at the locations of the sources. This dynamic matching radius was set to be equal to the average of the 90% encircled energy radii of the two sources, or, if this quantity was smaller than 1.5 arcseconds, the matching radius was set to 1.5 arcseconds.
As a final step in the initial analysis, we calculated a counts-to-flux conversion factor for each source by computing response matrices at each source location on the appropriate ACIS chip, assuming a power-law model with (Irwin et al. 2003) and n cm-2 (Dickey & Lockman 1999). After comparing fluxes computed with conversion factors based on different values of and nH, we conclude that the choice of parameter values, within a range of and n cm-2, changes the resulting fluxes by less than 25%. To convert source fluxes to luminosities, we assume a distance of Mpc (Tonry et al. 2001). To facilitate comparison with other studies, we note that the counts-to-flux conversion factors for the 0.3-8 keV band are typically 2.2 times greater than those for the 0.5-2 keV band for the ACIS-S, and typically 2.0 times greater for the ACIS-I.
From the 0.5 – 2 keV background images, we estimate the luminosity a source would need to be detected at a given location. By looking at the maximum values of these “Smin” maps, we estimate that outside of the bright 1.5′ central core, our source detection is complete above erg s-1. Of the 277 sources that we detect with 10 net counts, 244 are above this luminosity.
A summary of X-ray point sources detected in the NGC 4636 observations with at least 10 net counts is given in Table 2.
3. Results
3.1. The radial distribution of the point sources
The distribution of the X-ray point sources as a function of distance from the center of NGC 4636 is shown in Figure 3. The radial profiles of sources in the ACIS-S and ACIS-I observations are shown separately, and are seen to have the same shape, with the deeper ACIS-I observations having a larger number of sources with greater than 10 net counts.

From point source statistics in the Chandra Deep Fields (Bauer et al. 2004), we estimate a background AGN density of arcmin-2 at our limiting flux of erg cm-2 s-1 in the 0.5 – 2 keV band (shown as a horizontal line in Figure 3). Based on this estimate, our field becomes AGN-dominated beyond of the galaxy center. Between 1.5′ and 6′, we estimate that 25% of our sources are background sources (AGN) and 75% are LMXBs within the galaxy.
3.2. Spectral Analysis
Traditionally, X-ray colors for sources are calculated as ratios of counts in different energy bands (e.g. Swartz et al. 2004; Prestwich et al. 2003). However, since we want to directly compare sources observed by X-ray detectors with different responses (i.e. the ACIS-S and ACIS-I) and on different parts of the detectors, we convert source counts to fluxes before computing X-ray colors. We define three bands: soft (S = 0.5 – 1 keV), medium (M = 1 – 2 keV), and hard (H = 2 – 8 keV), and calculate two colors as C1 = (M-S)/(S+M+H) and C2 = (H-M)/(S+M+H), as defined in Swartz et al. (2004). The resulting color-color diagram is shown in Figure 4. The plotting symbol size is proportional to the 0.5 – 2 keV band luminosity. We identify two distinct populations: a large cluster of harder, less luminous sources with power-law indices between 1 and 2, and a smaller group of softer, more luminous sources ( erg s-1) with steeper power-law indices. Points in black lie less than 6′ from the center of the galaxy and are most likely members, while points in red lie further than 6′ from the center. The source represented by a purple X is located at the galactic nucleus, and the two sources with steep spectra represented by the purple asterisk and plus sign lie within 5′′ of the nucleus. These may be signatures of black holes (see §3.6.1 and §3.6.2). The large red circle near these points is a bursting X-ray source, which we discuss further in §3.6.4. Due to its distance from the galactic center () it is most likely not a member of NGC 4636.
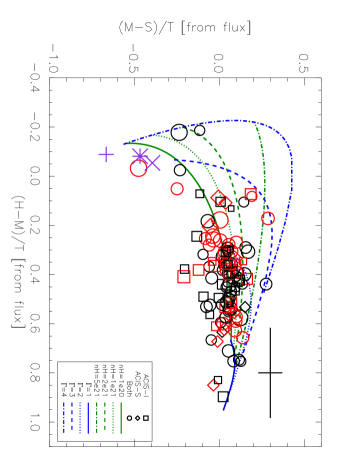
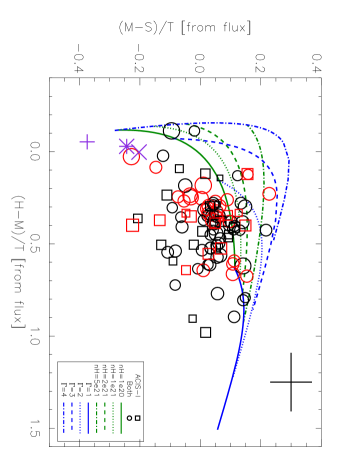
To make this flux based color-color diagram, we performed an iterative flux calculation as follows. Beginning with source counts in each band for both the ACIS-I and ACIS-S detectors, we convert to source and model flux, assuming a power-law model with slope and column density n cm-2 and computing response matrices at each location on the appropriate ACIS chip (as described in §2). We convert the model curves from counts to flux assuming the same power-law model and using response matrices calculated at the aimpoint location of each observation. Since in earlier works the color-color diagram has been based on counts, we show in Figure 5 the counts-based diagram (with model curves for the ACIS-I). We show in Figure 6 the color-color diagram from this first flux iteration. Next, we use model grids and source colors from this first iteration to determine the values of and nH closest to each source in color-color space. We then use these individual values of and nH to calculate a more accurate counts-to-flux conversion factor for the given source (again computing response matrices at each location on the appropriate ACIS chip). Note that the model grid shown in Figure 6 is a subset of the much finer grid that we use to pick the individual and nH for each source. For example, our grid has ranging from 1 to 4 in steps of 0.1, but for clarity on the plot, we only show integer values of .
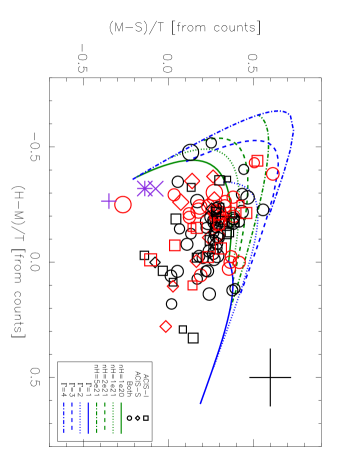
After performing this iterative flux conversion for the sources, we again calculate the colors, now comparing them to grids directly calculated from model flux values. This is shown in Figure 4. We note that this figure has much less scatter than the color-color plot based on counts for the same set of sources (Figure 5), making it easier to identify populations and trends.
3.3. Temporal Variability
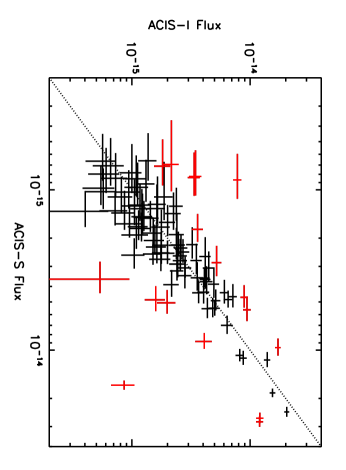
We present a comparison of source fluxes between the January 2000 ACIS-S observation and co-added February 2003 ACIS-I observations in Figure 7. To search for long-term variable sources, we determine a significance threshold as
| (1) |
where is the 0.5 - 2 keV band flux and is the flux uncertainty (dominated by the Poisson error on the number of counts – the error on the counts-to-flux conversion factor is minimal and we do not include it here). For the 228 sources in the common field of view detected with 10 net counts in at least one of the observations, we find 54 (24%) are long-term variable sources. These are marked with a “V” in the last column of Table 2. Of these 54 sources, 17 have 10 net counts in both observations. These are shown in red in Figure 7. The remaining 37 variable sources are “transient” – that is, they have 10 net counts in only one observation, and are not “reliably” detected in the other observation. Of these 37 transient sources, 31 have 20 net counts in one observation and 10 net counts in the other observation.
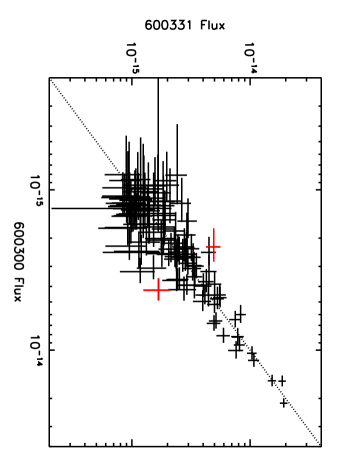
To measure variability on shorter timescales, we compare source fluxes between the two February 2003 ACIS-I observations (see Figure 8). These observations were done successively, each lasting for 75 ks (21 hrs). Of 188 sources detected in the common field of view with at least 10 net counts in one observation or the other, 9 (5%) vary significantly ( 3) between the two observations. These sources are marked “MV” in the last column of Table 2. Figure 8 shows a subset of these sources: those detected with at least 10 net counts in both observations.
For yet another look at short term variability, we use the IDL PINTofALE program timevarvk (Kashyap & Drake 2000), to search for sources which vary within the course of an observation. The timevarvk routine uses a one sample Kolmogorov-Smirnov test to compare the source lightcurve to a flat model, then calibrates the observed deviation with Monte Carlo simulations. Good time intervals are accounted for and gaps are removed. In addition, the deviations between the source lightcurve and model are averaged over a given number of photons to suppress random Poisson deviations. We ran 1000 Monte Carlo simulations per source, and averaged over 2 photons. Of 132 sources detected in the ACIS-S observation with at least 10 net counts, 17 (13%) are variable at a 3-sigma level ( 0.0027). Of 233 sources detected in the summed ACIS-I observation with at least 10 net counts, 19 (8%) are variable at a 3-sigma level. These sources are marked with “SV-I” and/or “SV-S” in the last column of Table 2.

An example of a variable lightcurve is shown in Figure 9. This source shows short term variability during both the ACIS-I and ACIS-S observations, and also shows variability between the two observations. Note the flare in the ACIS-S observation (top panel). We estimate its duration to be approximately 600 s. We discuss this bursting X-ray source further in §3.6.4.
Comparing our short and long term variability results to X-ray point source surveys of other galaxies is challenging due to the different methods and criteria used to determine and quantify variability in each case. To minimize the effects of these differences, we attempt to compare results for a subset of the brightest sources in each galaxy. For example, Kraft et al. (2000) find 35 out of 246 (14%) of X-ray point sources in Cen A to be variable with a 3 significance over a 5 month period separating the two observations. Computing the chi-square statistic for individual light curves (binsize 3600 s), they find only 2 sources with short term (within an observation - each about 36 ks) variability. Of the 17 sources with luminosity greater than erg s-1, 8 (47%) show significant long term variability. Jordán et al. (2004) search for long term variability among a subset of sources detected in two M87 observations spanning two years. Of the 23 sources with luminosity greater than erg s-1, 7 (30%) vary significantly. In NGC 4636, we find that of the 52 sources with luminosity greater than erg s-1, 21 (42%) show some type of variability: 13 (24%) long term and 12 (23%) short term. (Four of these very luminous sources show both long and short term variability.)
Loewenstein et al. (2005) find 5 transient sources out of 39 (13%) and an additional 6 (15%) highly variable sources in two observations of NGC 1399 spanning three years. Three of these 6 sources have luminosities greater than erg s-1, although since luminosities are not given for the whole source list, we have no basis for comparison with our results.
Of 126 sources with luminosity greater than 1.4 erg s-1 in NGC 4697, Sivakoff et al. (2008) find that 5 sources (4%) display short term variabilty and 16% display long term variability. Restricting our NGC 4636 population to the 157 sources lying less than 6′ from the galactic center with luminosity greater than 1.4 erg s-1, we find 16 (10%) that display short term variability and 29 (18%) that show long term variability.
3.4. Luminosity function of point sources
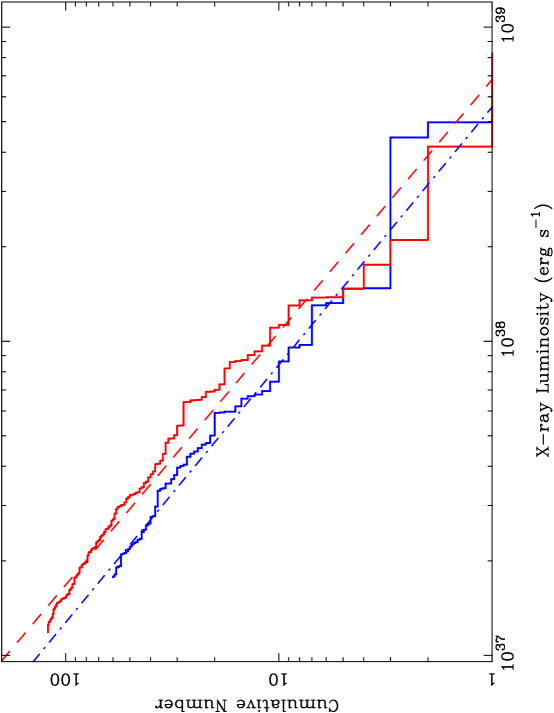
Figure 10 shows the luminosity function in the 0.5 – 2 keV band for X-ray point sources lying between 1.5′ and 6′ from the center of NGC 4636. We plot here only the sources that have 10 net counts, after subtraction of the local background, in each observation. Our requirement of having at least 10 net counts per source, leads to a different minimum luminosity for the two sets of observations ( erg s-1 and erg s-1 for ACIS-I and ACIS-S respectively). At the bright end, consistent with Irwin, Bregman & Athey (2004) and Raychaudhury et al. (2008), we do not find any ULXs ( 11039 erg s-1).
We model the luminosity function of these sources as a single power-law, since we see no evidence for a break in the luminosity function. Jordán et al. (2004) demonstrate that there is no compelling evidence for a break in the luminosity functions of the Virgo cluster galaxies M87, M49, and NGC 4697. We adopt a robust method of measuring the slope of the luminosity function, which is usually expressed in the cumulative form
| (2) |
Each of our point sources has a measured luminosity , given the adopted distance to the galaxy, and an estimated error . The probability of a point source to have a luminosity is
| (3) |
On comparison with (2), . We maximize the log likelihood function
| (4) |
where the distribution of our measured values of flux and error is given by
| (5) |
A more detailed account of this method, and its variants, can be found in Temple et al. (2005).
Assuming the errors in measuring flux and luminosity are distributed as a Gaussian, and that the minimum measured flux is the flux of the faintest source (as quoted above) in each observation, we numerically find the value of (thus ) for which in (4) is maximum, individually for both observations.
The ACIS-I data (red histogram in Figure 10) gives the slope of the cumulative luminosity function , and the ACIS-S data (blue histogram) yields , which are consistent with each other within errors. From samples of 4 and 14 early-type galaxies Gilfanov (2004) and Kim & Fabbiano (2004), respectively, found point source luminosity function slopes in the range 0.6–1.2; our values for NGC 4636 are at the higher end of this range.
3.5. Correlation with the globular cluster population
It is well-known that a significant fraction of LMXBs in the Milky Way and elsewhere is associated with globular clusters. In the Milky Way, 10% of all bright ( erg s-1) LMXBs are found in globular clusters (GCs), even though GCs account for of the stellar mass of the galaxy (e.g. Katz 1975, Clark 1975, Grindlay 1993). This has led to the suggestion that LMXBs are very close binary systems formed as a result of dissipative two-body or three-body encounters. This could be in the form of encounters between neutron stars and ordinary stars, which are more likely in the dense cluster cores (Fabian et al. 1975; Hut et al. 1992), or the exchange of a companion, where a compact object replaces a member of a binary in a three-body interaction (Clark 1975, Hills 1976). Indeed, it has been suggested that LMXBs are formed primarily in the cores of globular clusters, and some of the resulting binaries are later ejected from their host clusters (White et al. 2002). If so, one expects the LMXB population in a galaxy to be a good tracer of globular clusters. Alternatively, a significant fraction of the LMXBs could have formed in the field, possibly as part of the last major star formation episode of the galaxy (Irwin 2005, Juett 2005), in which case the populations of GCs and LMXBs need not be strongly correlated.
In early-type galaxies, Chandra observations show that there is an association of LMXBs with globular clusters. The fraction of LMXBs identified with known GCs varies from at least 20% in the Virgo elliptical NGC 4697 (Sarazin et al. 2001) to up to 70% in NGC 1399, the central galaxy of the Fornax cluster (Angelini et al. 2001). Furthermore, it is observed that the LMXBs in early-type galaxies are 3 times more likely to be in the redder globular clusters, for galaxies which exhibit bimodality in color of the GCs, e.g. M87, Jordán et al. 2004; NGC 4472, Kundu et al. 2002; more recently in ten others; Kundu et al. 2007, Sivakoff et al. 2007; Cen A (NGC 5128), Minniti et al. 2004, Jordán et al. 2007, Woodley et al. 2008; NGC 3379, Brassington et al. 2008. Since the redder GCs are relatively more metal-rich (e.g. Kundu & Zepf 2007), this can be a diagnostic of the characteristics of the compact object’s companion star in the LMXB, and its history of formation (Maccarone et al. 2004; Ivanova 2006). However, this could also result from systematic variation in the initial mass function of the GCs (Grindlay 1987), a possibility that has not been observationally explored, but could give rise to the same effect, independent of the nature of the companions.
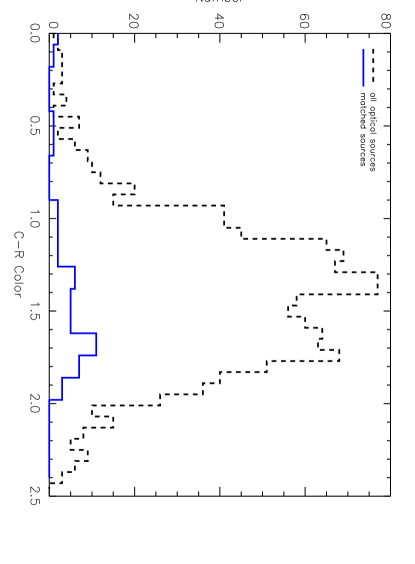
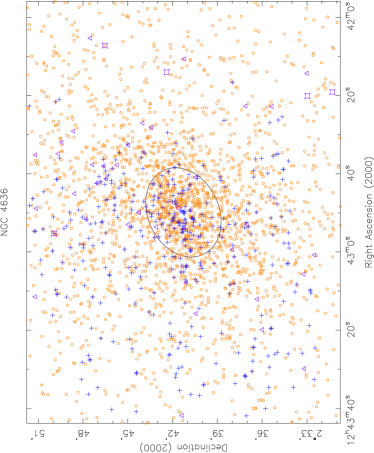
We matched our list of X-ray point sources with the list of globular cluster candidates, from the study of Dirsch et al. (2005), which uses a deep mosaic CCD observation using the CTIO Blanco telescope. The photometry is available in the Washington and Kron-Cousins system. Of the optical point sources listed in this work which extend over an area of 0.25 deg2 around the galaxy, we chose the sources with magnitude and color as globular cluster candidates. These are not spectroscopically confirmed to be globular clusters belonging to the galaxy. Figure 11 shows the distribution of both X-ray and optical point sources, together with other background sources that are known in the field. In a more recent paper, the group responsible for the original list has published spectral observations of a small subset of 200 of the original list of GC candidates (Schuberth et al. 2006). Of the sources with magnitude and color , 80% of the candidates were found to be globular clusters from measured redshift and the rest foreground stars.
The positions of both X-ray and optical sources are known to an accuracy of better than an arcsecond. We matched the two lists by taking each X-ray point source, and finding its offset from the nearest globular cluster candidate. We checked for systematic translation and rotation between the two lists by seeking to maximize the matches for small values of rotation and translation of all sources, but could not improve upon the matching done above. Based on the distribution of offsets, we chose to limit the search radius to 1.5′′. If two GC candidates fell within this radius, we assigned the X-ray source to the nearer one in angular distance. Of the 318 sources in our list, 77 were matched to globular cluster candidates. These sources are marked “GC” in the last column of Table 2 and are listed separately in Table 3. Of these 77 matched point sources, 48 lie within of the center of NGC 4636 and have more than 10 net counts in either of the ACIS-S or combined ACIS-I observations. Based on the number of X-ray sources and GC candidates in this annulus, we expect only three chance coincidences. No other known background sources from NED were matched with X-ray sources within 10′ of the center of the galaxy.
A color histogram of globular cluster candidates is shown in the top panel of Figure 12 (dashed histogram). As in many other early-type galaxies, the distribution of the colors of candidate globular clusters here is bimodel. Dirsch et al. (2005) fit a two-Gaussian model to their color distribution, and find that the two peaks are at and , with the intervening minimum occurring at . We adopt these values, and here refer to those with as the “redder” GCs, and the rest, the “bluer” ones. Of the 48 matched GCs between – of the galactic center, 13 have colors between , and 30 have colors , so 70% of the matched GCs in Figure 12 with colors between 0.8 and 2.5 are in the redder category.
The difference in color between the two populations is predominantly due to a difference in metal abundance, since for stellar populations that are more than a few Gyr old, the optical colors would be more sensitive to the [Fe/H] index than to age (e.g., Worthey 1994, Bruzual & Charlot 1993). In NGC 4636, even though bluer GCs are more abundant, a majority of the X-ray point sources (LMXBs) are associated with the redder GCs (those of near-solar abundance), as is shown by the solid histogram in the left panel of Figure 12, which represents the color distribution of the GCs matched with X-ray point sources. A similar association has been reported for other nearby early-type galaxies (Kundu et al. 2002, Jordán et al.2004, Kim et al. 2005, Kundu et al. 2007, Sivakoff et al. 2007). This is also consistent with the observation that most LMXBs associated with GCs in the Galaxy and M31 lie in those systems with a near-solar abundance (Grindlay 1993, Bellazzini et al. 1995, Bregman 2006).
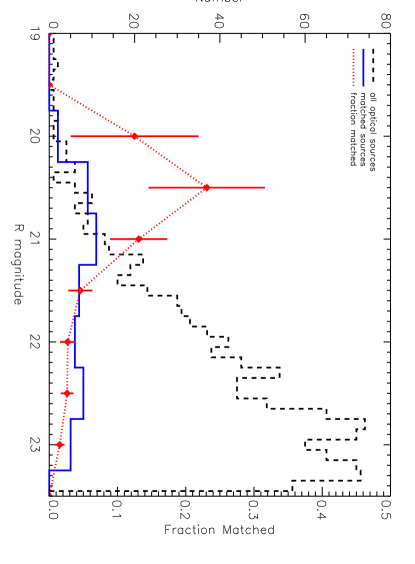
Other studies have found that X-ray point sources are preferentially found in optically more luminous globular clusters (Angelini et al. 2001, Sarazin et al. 2003, Kundu et al. 2002, Jordán et al.2004, Kim et al. 2005, Xu et al. 2005). GCs containing LMXBs also have been noted to be significantly denser in the Galaxy and in M31 (e.g. Bellazzini et al. 1995). Since the mean size of a GC does not significantly vary with luminosity (McLaughlin 2000), more luminous GCs can be expected to be denser, and such a correlation can result from the higher density of potential companion stars in such systems. In the lower panel of Figure 12, we show the distribution of all GC candidates from the center of NGC 4636 (dashed histogram), plotted along with those that match with X-ray point sources (solid histogram). The dotted line shows the ratio of matched to total GC candidates as a function of R magnitude. This ratio declines towards fainter GCs, indicating that the probability of a GC containing an LMXB is proportional to its luminosity, consistent with other studies (e.g. Sarazin et al.2003, Jordán et al. 2004, Sivakoff et al. 2007, Woodley et al. 2008).
In Figure 13, we plot the apparent magnitude and color of the host globular clusters against the X-ray luminosity of the matched X-ray point sources. These plots indicate that the X-ray luminosity of the matched point sources does not depend on the color or absolute luminosity of the host GCs, which agrees with earlier work noted above. Together with the previous observation, this should be a useful constraint on the formation process of LMXBs in globular clusters.

Finally, we compare the luminosity function (LF) of the X-ray point sources matched with globular cluster candidates to the LF of those that are not matched with any optical source. Here, we study only the point sources within of the center of NGC 4636, where the X-ray sources are not seriously contaminated by background AGN (see Figure 3). In Figure 14, we plot the LFs of GC-matched and non-GC matched X-ray point sources. The two plots represent X-ray luminosities obtained from two different epochs of observations, to account for the possible change in LF due to long term variability in these sources. The solid histogram shows the LF of the matched point sources, and the dashed histogram is the LF of all X-ray point sources that did not match a GC candidate. Note that the brightest X-ray sources are not matched with any GC candidate. In both cases, the slopes of the LFs of the GC sources and non-GC sources in the range erg s erg s-1 match within 2. For the ACIS-S observation, from a Kolmogorov-Smirnov (K-S) test, the probability that the two samples are drawn from the same population is 78%, whereas for the ACIS-I samples, the corresponding value is 50%, with the maximum deviation occurring at the faint end in both cases. We note that the K-S test underestimates this probability for discrete distributions (see, for example, Sheskin 2003). At the faint end of the luminosity function, there is emerging evidence, from nearby galaxies like Cen A (NGC 5128) where more complete samples of fainter sources can be studied, that there are fewer X-ray faint sources found in GCs than X-ray bright ones (e.g. Woodley et al. 2008). We see perhaps some evidence for a dearth of GC matches at lower luminosities in the ACIS-I LFs (Figure 14, bottom panel).


3.6. Individual Sources
3.6.1 Galactic Nucleus
We detect a soft, luminous ( erg s-1) X-ray point source at the galaxy’s nucleus, as determined from the VLA 5 GHz (Griffith et al. 1995) radio position ((J2000) = 190.7077, (J2000) = 2.6878). Loewenstein et al. (2001) do not detect nuclear activity in NGC 4636 in the 2 – 10 keV band. However, this source is very soft, and of its emission falls below the 2 – 10 keV band. This source is shown with a purple X in the color-color diagram (Figure 4) and is significantly softer than the LMXBs. The spectrum is well-fit by a power-law model with a photon index of = 2.36 (68% confidence range is 1.94 – 2.76). In fellow Virgo elliptical galaxies NGC 4472 and NGC 4649, Soldatenkov et al. (2003) detect two soft x-ray sources at the galactic nuclei with similar power law indices (2.5 0.4 and 2.2).
3.6.2 Additional Black Hole Candidates
We detected two soft, luminous ( erg s-1) sources very near the center of the galaxy (), whose soft spectra, like the source at the nucleus, may be signatures of black holes. These sources are shown by the purple asterisk and plus sign in the color-color diagram (Figure 4). McClintock & Remillard (2004) find that black hole binaries in the thermal-dominated state are well-described by a disk-blackbody model with T = 1 keV. The spectra of the two sources are very similar, so we added them before fitting with XSPEC (Arnaud 1996). With a disk-blackbody model, we find a best-fit temperature of 0.30 keV with a 68% confidence range of 0.27 – 0.33 keV. The co-added spectra are equally well-fit by a power-law model with a photon index of = 2.81 (68% confidence range 2.58 – 3.03).
Although we are prevented by the insufficient source counts from reaching a definitive conclusion, it is possible that these sources, and the one at the nucleus, are indeed signatures of black holes at the center of NGC 4636. If so, they may be massive black holes which fell to the galaxy center under dynamical friction, in which case they would have masses greater than M⊙ (Tremaine & Ostriker 1999). However, given the luminosities of these sources, it is more likely that they are remnants of merged galaxies, similar to what Komossa et al. (2003) observe in the elliptical galaxy NGC 6240.
3.6.3 SN 1939A
SN 1939A is a Type 1a supernova 0.57′ from the center of NGC 4636 ((J2000)=190.700∘, (J2000)=2.693∘ (Zwicky 1939, Giclas 1939, Tsvetkov & Bartunov 1993). We do not detect X-ray emission at this location. By generating a large number of Poisson realizations from the observed background at this location in our Chandra observations, we calculate a 3 X-ray count rate upper limit of 2.510-4 cts s-1 in the 0.5 – 2 keV band. This translates to a luminosity upper limit of erg s-1 in the same energy band.
3.6.4 Bursting X-ray Source
A light curve for the bursting X-ray source, detected at , , is shown in Figure 9. The matching source (0.8′′ away) in the 2MASS All-Sky Catalog of Point Sources, 2MASS J12433175+0237080 (, ) has J, H, and K band magnitudes of 10.139 0.032, 9.485 0.03, and 9.293 0.028, respectively (Skrutskie 2006). From the Sloan Digital Sky Survey Data Release 6, we get g and r band magnitudes of 13.92 0.01 and 14.83 0.01, respectively, for matching source SDSS J124331.75+023708.0 (, , separation=0.8′′) (Adelman-McCarthy 2008). Based on the source’s optical and infrared brightness and its large distance from the center of the galaxy (11.3′), it is most likely not a member of NGC 4636, but is probably a relatively nearby flare star in our Galaxy.
Figure 15 shows hard and soft band lightcurves for this source from the ACIS-S observation. No hard (2 – 6 keV) counts are detected above the background prior to the burst.
4. Summary and Conclusions
We have analyzed three Chandra ACIS observations, taken over three years and totaling 193 ks, of the Virgo galaxy NGC 4636, and have detected 277 X-ray point sources above a luminosity of erg s-1 in the 0.5 – 2 keV band, outside the central bright galaxy core. Based on the estimated density of AGN in the field, 123 of these are likely members of the galaxy, while the rest are likely AGN. In the region from 1.5′ to 6′ from the center of the galaxy, there are 129 X-ray point sources detected with 10 net counts, 25% of which are likely AGN.
We calculate X-ray colors from fluxes (rather than from counts, as is traditionally done), and find that this results in more clearly grouped populations on the X-ray color-color diagram. We identify a large group of LMXBs, and a small group of much softer sources, including three within 5′′ of the galactic center which may be black holes.
We find 77 matches between our X-ray point sources and potential globular cluster (GC) candidates found in deep optical images of NGC 4636. Choosing the subset of 48 matched point sources with 10 net counts that correlate with GC candidates and lie within of the center of the galaxy (out of 129 X-ray point sources in this annulus), we find that the overwhelming majority are associated with the redder GC candidates, those that are thought to have near-solar metal abundance. We find that the fraction of GC candidates with X-ray point source matches decreases with decreasing GC luminosity. The luminosity functions of the point sources matched with GCs and of those that are unmatched have similar slopes. We searched for variable sources on timescales ranging from hours to years. We find that 54 sources in the common field of view (24%) show long-term variability and vary by between the January 2000 ACIS-S observation and the February 2003 ACIS-I observations, while about 10% of sources show short-term variability within a single observation.
References
- (1)
- (2) Adelman-McCarthy J K et al 2008, ApJS, 175, 297A
- (3) Angelini L, Loewenstein M and Mushotzky R F 2001, ApJL, 557, L35
- (4) Arnaud K A 1996, Astronomical Data Analysis Software and Systems V, eds. Jacoby G and Barnes J, ASP Conf. Series vol 101
- (5) Baldi A, Forman W R, Jones C, Nulsen P E J, David L P, Kraft R P and Churazov E, 2008, HEAD, 10.2909B
- (6) Bauer F E, Alexander D M, Brandt W N, Schneider D P, Treister E, Hornschemeier A E and Garmire G P 2004, ApJ, 128, 2048.
- (7) Bellazzini M, Pasquali A, Federici L, Ferraro F R and Fusi Pecci F 1995, ApJ, 439, 687
- (8) Birkinshaw M and Davies R L 1985, ApJ, 291, 32
- (9) Brassington N J et al 2008, ApJs, 179, 142
- (10) Bregman J N, Irwin J A, Seitzer P, Flores M 2006, ApJ, 640, 282
- (11) Bruzual G A and Charlot S 1993, ApJ, 405, 538
- (12) Buote D A 2000, ApJ, 539, 172
- (13) Chakrabarty D and Raychaudhury S 2008, AJ, 135, 2350
- (14) Clark G W 1975, ApJ, 199, L143
- (15) Dickey and Lockman 1990, ARAA, 28, 215
- (16) Dirsch B, Schuberth Y, and Richtler T 2005, A&A, 433, 43
- (17) Dirsch B, Richtler T, Geisler D, Forte J C, Bassino L P and Gieren W P 2003, AJ, 125, 1908
- (18) Fabian A C, Pringle J E and Rees M J 1975, MNRAS, 172, 15P
- (19) Fabbiano G 2006, ARA&A, 44, 323
- (20) Forman W, Jones C and Tucker W 1985, ApJ, 293, 102
- (21) Giclas H L 1939, PASP, 51, 166
- (22) Gilfanov M 2004, MNRAS, 349, 146
- (23) Griffith M R, Wright A E, Burke B F and Ekers R D 1995, ApJS, 97, 347
- (24) Grindlay J E 1993, ASP Conf. Ser. 48: The Globular Cluster-Galaxy Connection, 48, 156
- (25) Grindlay J E 1987, IAU Symp. 125, Origin and Evolution of Neutron Stars, ed. D. Helfand and J. Huang (Dordrecht: Reidel), 173
- (26) Hills J G 1976, MNRAS, 175, L1
- (27) Hut P, McMillan S, Goodman J, Mateo M, Phinney E S, Pryor C, Richer H B, Verbunt F and Weinberg M 1992, PASP, 104, 981
- (28) Irwin J A 2005, ApJ, 631, 511
- (29) Irwin J A, Bregman J N and Athey A E 2004, ApJL, 601, L143
- (30) Irwin J A, Athey A and Bregman J 2003, ApJ, 587, 356
- (31) Ivanova N 2006, ApJ, 636, 979
- (32) Juett A M 2005, ApJL, 621, L25
- (33) Jones C, Forman W, Vikhlinin A, Markevitch M, David L, Warmflash A, Murray S and Nulsen P E J 2002, ApJL, 567, L115
- (34) Jordán A, Côté P, Ferrarese L, Blakeslee J P, Mei S, Merritt D, Milosavljević M, Peng E W, Tonry J L and West M J 2004, ApJ, 613, 279
- (35) Jordán A et al 2007, ApJL, 671, 117
- (36) Kashyap V and Drake J J 2000, BASI, 28, 475
- (37) Katz J I 1975, Natur., 253, 698
- (38) Knapp G R, Faber S M and Gallagher J S 1978, AJ, 83, 11
- (39) Kim D-W and Fabbiano G 2004, ApJ, 611, 846
- (40) Kim E, Kim D-W, Fabbiano G, Lee M G, Park H S, Geisler D and Dirsch B 2006, ApJ, 647, 276
- (41) Kraft R P, Kregenow J M, Forman W R, Jones C and Murray S S 2001, ApJ, 560, 675
- (42) Komossa S, Burwitz V, Hasinger G, Predehl P, Kaastra J S and Ikebe Y 2003, ApJL, 582, 15K
- (43) Kundu A, Maccarone T J and Zepf S E 2002, ApJL, 574, L5
- (44) Kundu A and Zepf S E 2007, ApJL, 660, L109
- (45) Kundu A, Maccarone T J and Zepf S E 2007, ApJ, 662, 525
- (46) Loewenstein M, Mushotzky R, Angelini L and Arnaud K 2001, ApjL, 555, L21
- (47) Loewenstein M and Mushotzky R 2003, Nuclear Physics B Proceedings Supplements, 124, 91
- (48) Loewenstein M, Angelini L and Mushotzky R F 2005, Chin. J. Astron. Astrophys. Vol. 5 Suppl., 159
- (49) McLaughlin D E 2000, ApJ, 539, 618
- (50) Maccarone T J, Kundu A and Zepf S E 2004, ApJ, 606, 430
- (51) Matsushita K, Makishima K, Rokutanda E, Yamasaki N Y and Ohashi T 1997, ApJL, 488, L125
- (52) McClintock J and Remillard R 2005, in Compact Stellar X-ray Sources, eds. Lewin W H G and van der Klis M (New York: Cambridge University Press)
- (53) Miles T A, Raychaudhury S, Forbes D A, Goudfrooij P, Ponman T J and Kozhurina-Platais V 2004, MNRAS, 355, 785
- (54) Miles T A, Raychaudhury S and Russell P A 2006, MNRAS, 373, 1461
- (55) Minniti D, Rejkuba M, Funes J G and Akiyama, S 2004, ApJ, 600, 716
- (56) O’Sullivan E, Vrtilek J M and Kempner J C 2005, ApJL, 624, L77
- (57) Osmond J P F and Ponman T J 2004, MNRAS, 350, 1511
- (58) Perryman M A C et al 1997, A&A, 323L, 49
- (59) Sheskin D, Handbook of Parametric and Nonparametric Statistical Procedures, CRC Press, 3rd ed, pp.215
- (60) Prestwich A, Irwin J, Kilgard R, Krauss M, Zezas A, Primini F, Kaarat P and Boroson B 2003, ApJ, 595, 719
- (61) Raychaudhury S, Medina I M V, Jones C, Forman W R, Vikhlinin A and Murray S S 2008, ApJ, submitted
- (62) Sandage A 1961, The Hubble Atlas of Galaxies (Washington, DC: CIW)
- (63) Sarazin C L, Irwin J A and Bregman J N 2001, ApJ, 556, 533
- (64) Sarazin C L, Kundu A, Irwin J A, Sivakoff G R, Blanton E L and Randall, S W 2003, ApJ, 595, 743
- (65) Schuberth Y, Richtler T, Dirsch B, Hilker M, Larsen S S, Kissler-Patig M and Mebold U 2006, A&A, 459, 391
- (66) Sivakoff G R, Jordán A, Juett A M, Sarazin C L and Irwin J A, 2008, ArXiv Astrophysics e-prints, arXiv:0806.0627v1
- (67) Sivakoff G R, Jordán A, Sarazin C L, Blakeslee J P, Côté P, Ferrarese L, Juett A M, Mei S and Peng E W 2007, ApJ, 660, 1246
- (68) Skrutskie M F et al 2006, AJ, 131, 1163
- (69) Soldatenkov D A, Vikhlinin A A and Pavlinsky M N 2003, AstL, 29, 298S
- (70) Swartz D A, Ghosh K K, Tennant A F and Wu K 2004, ApJS, 154, 519.
- (71) Temi P, Mathews W G, Brighenti F and Bregman J D 2003, ApJL, 585, L121
- (72) Temple R F, Raychaudhury S and Stevens I R 2005, MNRAS, 362, 581
- (73) Tonry J, Dressler A, Blakeslee J, Ajhar E, Fletcher A, Luppino G, Metzger M and Moore C 2001, ApJ, 546, 681
- (74) Tremaine S and Ostriker J P 1999, MNRAS, 306, 662T
- (75) Trinchieri G, Kim D-W, Fabbiano G and Canizares C R C 1994, ApJ, 428, 555
- (76) Tsvetkov D Y and Bartunov O S 1993, BICDS, 42, 17T
- (77) Vikhlinin A, Forman W, Jones C and Murray S 1995, ApJ, 451, 542
- (78) White R E, Sarazin C L and Kulkarni S R 2002, ApJL, 571, L23
- (79) Worthey G 1994, ApJS, 95, 107
- (80) Xu Y, Xu H, Zhang Z, Kundu A, Wang Y and Wu X-P 2005, ApJ, 631, 809
- (81) Woodley K A, Raychaudhury S, Kraft R P, Harris W E, Jordán A, Whitaker K E, Jones C, Forman W R, Murray S S 2008, ApJ, 682, 199
- (82) Zwicky F 1939, PASJ, 51, 36
- (83)
| (J2000) | (J2000) | Net CtsaaNet counts and luminosity (erg s-1) are in the 0.5 – 2 keV band. | LuminosityaaNet counts and luminosity (erg s-1) are in the 0.5 – 2 keV band. | Soft ColorbbSoft color is defined as (M-S)/(S+M+H) where S, M, and H are the fluxes in bands 0.5 – 1, 1 – 2, and 2 – 8 keV, respectively. | Hard ColorccHard color is defined as (H-M)/(S+M+H) where S, M, and H are the fluxes in bands 0.5 – 1, 1 – 2, and 2 – 8 keV, respectively. | Dist. from Center (′) | Notesdd1 means the source was detected by the ACIS-S, 2 means the source was detected by the ACIS-I, and 3 means the source was detected by both instruments. V denotes a long-term (i.e. between observations) variable and SV denotes a short-term (i.e. during a single observation, either the ACIS-S (S) or coadded ACIS-I (I)) variable. MV indicates that the source flux varies significantly between the sequential ACIS-I observations. GC indicates that the sources is matched with a globular cluster. The number following GC gives the source’s position in Table 3. |
|---|---|---|---|---|---|---|---|
| 190.7077 | 2.6878 | 202 | 2.202E+38 | -0.39 | -0.05 | 0.00 | 3 MV |
| 190.7071 | 2.6867 | 138 | 2.375E+38 | -0.67 | -0.09 | 0.08 | 3 V,MV |
| 190.7091 | 2.6876 | 157 | 1.718E+38 | -0.47 | -0.08 | 0.08 | 3 |
| 190.7066 | 2.6918 | 68 | 7.432E+37 | -0.69 | -0.11 | 0.25 | 2 V |
| 190.7016 | 2.6860 | 45 | 5.044E+37 | 0.24 | 0.28 | 0.38 | 2 |
| 190.7068 | 2.6811 | 56 | 9.761E+37 | -0.19 | -0.31 | 0.40 | 1 V |
| 190.7158 | 2.6862 | 44 | 4.774E+37 | 0.17 | 0.60 | 0.49 | 3 |
| 190.7047 | 2.6796 | 43 | 4.730E+37 | -0.23 | -0.02 | 0.52 | 3 GC 19 |
| 190.7134 | 2.6774 | 45 | 5.000E+37 | 0.09 | 0.47 | 0.71 | 2 V,GC 77 |
| 190.7195 | 2.6854 | 22 | 3.948E+37 | -0.02 | 0.33 | 0.72 | 1 GC 24 |
| 190.7198 | 2.6884 | 53 | 5.807E+37 | 0.07 | 0.39 | 0.72 | 2 V |
| 190.7180 | 2.6947 | 56 | 6.047E+37 | 0.10 | 0.41 | 0.74 | 3 |
| 190.7150 | 2.6772 | 38 | 4.210E+37 | 0.02 | 0.38 | 0.77 | 3 |
| 190.7152 | 2.6756 | 29 | 5.147E+37 | 0.06 | 0.40 | 0.86 | 3 |
| 190.6956 | 2.6975 | 48 | 5.367E+37 | 0.07 | 0.13 | 0.93 | 2 V |
| 190.7091 | 2.7035 | 36 | 3.926E+37 | 0.12 | 0.42 | 0.95 | 2 |
| 190.7254 | 2.6887 | 21 | 3.663E+37 | 0.02 | 0.63 | 1.06 | 1 |
| 190.7262 | 2.6892 | 34 | 3.676E+37 | -0.20 | 0.38 | 1.11 | 2 |
| 190.7250 | 2.6979 | 21 | 2.253E+37 | 0.02 | 0.90 | 1.20 | 2 GC 46 |
| 190.6877 | 2.6931 | 19 | 2.228E+37 | 0.45 | -0.37 | 1.24 | 2 GC 62 |
| 190.7102 | 2.6670 | 29 | 3.239E+37 | -0.11 | 0.07 | 1.26 | 2 V |
| 190.6902 | 2.6993 | 42 | 4.782E+37 | 0.05 | 0.29 | 1.26 | 3 SV-I |
| 190.6962 | 2.7055 | 27 | 4.679E+37 | 0.24 | 0.06 | 1.27 | 1 V |
| 190.7296 | 2.6897 | 71 | 7.588E+37 | 0.05 | 0.71 | 1.32 | 3 GC 26 |
| 190.7212 | 2.6696 | 13 | 1.487E+37 | -0.16 | -0.12 | 1.36 | 2 |
| 190.7295 | 2.6804 | 17 | 1.840E+37 | -0.09 | 0.49 | 1.38 | 2 |
| 190.6847 | 2.6889 | 57 | 6.500E+37 | -0.04 | 0.41 | 1.38 | 3 |
| 190.7027 | 2.7108 | 19 | 2.171E+37 | -0.00 | -0.14 | 1.41 | 2 |
| 190.6833 | 2.6826 | 36 | 4.080E+37 | 0.06 | 0.50 | 1.50 | 3 |
| 190.7194 | 2.7107 | 36 | 3.853E+37 | 0.12 | 0.75 | 1.54 | 3 GC 21 |
| 190.7315 | 2.6753 | 15 | 1.690E+37 | 0.46 | -0.37 | 1.61 | 2 |
| 190.7325 | 2.6766 | 90 | 9.686E+37 | 0.28 | 0.44 | 1.63 | 3 V |
| 190.7149 | 2.7141 | 15 | 1.686E+37 | -0.12 | -0.14 | 1.63 | 2 |
| 190.7268 | 2.7077 | 13 | 1.447E+37 | 0.09 | 0.45 | 1.65 | 2 GC 65 |
| 190.6979 | 2.6619 | 186 | 2.101E+38 | -0.12 | -0.19 | 1.66 | 3 V |
| 190.7211 | 2.7123 | 27 | 2.983E+37 | 0.09 | 0.48 | 1.68 | 3 GC 13 |
| 190.7093 | 2.7161 | 67 | 7.291E+37 | 0.06 | 0.55 | 1.70 | 3 |
| 190.7369 | 2.6863 | 60 | 6.404E+37 | 0.12 | 0.41 | 1.75 | 3 SV-S,GC 20 |
| 190.7333 | 2.7030 | 14 | 1.521E+37 | -0.05 | 0.25 | 1.78 | 2 GC 44 |
| 190.6787 | 2.6817 | 22 | 2.530E+37 | 0.03 | 0.57 | 1.78 | 3 GC 22 |
| 190.6787 | 2.6805 | 28 | 3.246E+37 | -0.08 | 0.53 | 1.80 | 3 GC 12 |
| 190.7367 | 2.6795 | 16 | 1.813E+37 | 0.08 | 0.82 | 1.81 | 2 |
| 190.6783 | 2.6982 | 79 | 9.043E+37 | 0.13 | 0.75 | 1.88 | 3 V |
| 190.7134 | 2.6567 | 20 | 3.640E+37 | 0.23 | 0.30 | 1.90 | 3 |
| 190.6927 | 2.7157 | 12 | 1.356E+37 | 0.15 | 0.09 | 1.90 | 2 GC 54 |
| 190.6880 | 2.7132 | 59 | 6.648E+37 | -0.05 | 0.52 | 1.93 | 3 |
| 190.7178 | 2.7188 | 11 | 1.252E+37 | 0.33 | 0.21 | 1.96 | 2 |
| 190.6781 | 2.7048 | 12 | 2.119E+37 | -0.13 | 0.42 | 2.05 | 1 SV-S,GC 28 |
| 190.7007 | 2.7216 | 13 | 1.429E+37 | -0.25 | 0.24 | 2.07 | 2 |
| 190.7433 | 2.6861 | 31 | 3.399E+37 | 0.07 | 0.47 | 2.13 | 3 |
| 190.6947 | 2.7209 | 14 | 1.567E+37 | 0.01 | 0.16 | 2.13 | 2 |
| 190.7095 | 2.7236 | 11 | 1.925E+37 | -0.02 | 0.52 | 2.15 | 1 |
| 190.7226 | 2.6550 | 11 | 1.308E+37 | 0.06 | 0.17 | 2.16 | 2 |
| 190.7126 | 2.7235 | 13 | 2.350E+37 | 0.05 | 0.41 | 2.16 | 1 |
| 190.7398 | 2.7059 | 23 | 2.473E+37 | 0.11 | 0.73 | 2.21 | 2 V |
| 190.6907 | 2.7206 | 13 | 1.512E+37 | 0.28 | 0.15 | 2.22 | 3 GC 37 |
| 190.6807 | 2.7141 | 19 | 2.213E+37 | -0.47 | 0.08 | 2.27 | 2 V |
| 190.7340 | 2.7155 | 23 | 2.523E+37 | 0.05 | -0.15 | 2.29 | 2 V,MV,SV-I |
| 190.7081 | 2.7260 | 14 | 1.523E+37 | 0.07 | 0.39 | 2.29 | 3 |
| 190.6797 | 2.7138 | 10 | 1.812E+37 | 0.35 | 0.10 | 2.30 | 3 GC 31 |
| 190.6718 | 2.6728 | 150 | 1.753E+38 | 0.07 | 0.36 | 2.34 | 3 |
| 190.7468 | 2.6811 | 27 | 2.927E+37 | 0.04 | 0.36 | 2.38 | 3 |
| 190.6675 | 2.6818 | 38 | 6.769E+37 | -1.26 | -0.01 | 2.44 | 3 |
| 190.7068 | 2.7288 | 34 | 3.690E+37 | 0.14 | 0.11 | 2.46 | 3 GC 14 |
| 190.6695 | 2.6725 | 94 | 1.105E+38 | -0.07 | 0.18 | 2.47 | 3 |
| 190.7400 | 2.6611 | 34 | 3.772E+37 | 0.05 | 0.43 | 2.51 | 3 |
| 190.7452 | 2.6685 | 45 | 4.901E+37 | 0.05 | 0.40 | 2.53 | 3 V |
| 190.7021 | 2.7296 | 13 | 1.475E+37 | 0.15 | 0.08 | 2.53 | 2 |
| 190.7496 | 2.6800 | 24 | 2.592E+37 | 0.26 | -0.30 | 2.55 | 2 V,GC 59 |
| 190.7145 | 2.6435 | 118 | 1.351E+38 | 0.06 | 0.44 | 2.69 | 3 GC 16 |
| 190.6774 | 2.7211 | 76 | 8.652E+37 | 0.04 | 0.31 | 2.70 | 2 V,GC 58 |
| 190.6779 | 2.7223 | 41 | 4.753E+37 | 0.04 | 0.58 | 2.74 | 3 GC 35 |
| 190.6965 | 2.7323 | 29 | 3.292E+37 | -0.06 | 0.56 | 2.75 | 2 V |
| 190.6685 | 2.7120 | 36 | 4.167E+37 | 0.09 | 0.45 | 2.77 | 2 V |
| 190.6644 | 2.7046 | 23 | 2.715E+37 | -0.00 | 0.49 | 2.79 | 2 GC 53 |
| 190.7320 | 2.6479 | 15 | 2.762E+37 | -0.05 | 0.67 | 2.80 | 3 GC 15 |
| 190.7264 | 2.6437 | 14 | 1.627E+37 | -0.10 | 0.32 | 2.88 | 3 |
| 190.7549 | 2.7000 | 25 | 4.458E+37 | 0.15 | 0.53 | 2.92 | 1 V |
| 190.6601 | 2.6978 | 27 | 3.265E+37 | 0.04 | 0.35 | 2.92 | 3 GC 8 |
| 190.7556 | 2.6970 | 50 | 5.386E+37 | 0.06 | 0.49 | 2.92 | 3 GC 36 |
| 190.7575 | 2.6918 | 12 | 2.180E+37 | 0.08 | -0.22 | 3.00 | 1 V |
| 190.7348 | 2.6449 | 11 | 2.097E+37 | -0.04 | 0.86 | 3.04 | 3 GC 32 |
| 190.7499 | 2.6594 | 247 | 4.455E+38 | 0.12 | 0.58 | 3.05 | 3 V |
| 190.6569 | 2.6927 | 26 | 3.153E+37 | 0.03 | 0.36 | 3.06 | 3 GC 5 |
| 190.7209 | 2.6372 | 98 | 1.127E+38 | -0.58 | -0.13 | 3.14 | 3 |
| 190.6809 | 2.6417 | 57 | 6.921E+37 | 0.02 | 0.33 | 3.20 | 3 GC 25 |
| 190.6740 | 2.6463 | 77 | 9.297E+37 | 0.04 | 0.45 | 3.21 | 3 V |
| 190.6699 | 2.6470 | 12 | 1.484E+37 | 0.25 | 0.59 | 3.34 | 2 GC 61 |
| 190.7042 | 2.6311 | 14 | 2.627E+37 | 0.11 | 0.30 | 3.41 | 3 |
| 190.7647 | 2.6900 | 60 | 6.485E+37 | 0.15 | 0.40 | 3.42 | 3 GC 6 |
| 190.7647 | 2.6847 | 20 | 2.191E+37 | 0.21 | 0.41 | 3.42 | 3 GC 17 |
| 190.7618 | 2.6691 | 11 | 1.280E+37 | 0.37 | 0.10 | 3.43 | 2 MV |
| 190.7055 | 2.7454 | 10 | 1.184E+37 | 0.32 | 0.27 | 3.46 | 2 |
| 190.6963 | 2.7446 | 21 | 2.329E+37 | -0.86 | 0.04 | 3.47 | 3 |
| 190.7206 | 2.6306 | 358 | 4.167E+38 | -0.24 | -0.18 | 3.52 | 3 |
| 190.7664 | 2.6852 | 16 | 1.797E+37 | 0.06 | 0.51 | 3.52 | 2 |
| 190.7227 | 2.7458 | 61 | 6.500E+37 | 0.02 | -0.14 | 3.59 | 2 |
| 190.7646 | 2.6689 | 24 | 2.688E+37 | 0.35 | 0.27 | 3.59 | 3 GC 34 |
| 190.7688 | 2.7011 | 28 | 3.068E+37 | 0.08 | 0.75 | 3.75 | 3 SV-I |
| 190.7676 | 2.6672 | 14 | 1.566E+37 | 0.06 | 0.49 | 3.80 | 3 |
| 190.7712 | 2.6908 | 12 | 1.302E+37 | 0.12 | 0.61 | 3.81 | 3 GC 3 |
| 190.7715 | 2.6879 | 33 | 3.538E+37 | 0.05 | 0.30 | 3.83 | 3 |
| 190.6451 | 2.6996 | 12 | 1.556E+37 | 0.03 | 0.48 | 3.83 | 2 |
| 190.7625 | 2.6541 | 63 | 7.007E+37 | 0.04 | 0.51 | 3.86 | 3 GC 7 |
| 190.7428 | 2.6333 | 17 | 1.960E+37 | 0.09 | 0.74 | 3.89 | 3 SV-I |
| 190.6608 | 2.7329 | 18 | 2.131E+37 | -0.21 | 0.04 | 3.91 | 2 |
| 190.7773 | 2.6984 | 16 | 1.761E+37 | 0.03 | 0.51 | 4.22 | 2 GC 51 |
| 190.6769 | 2.7526 | 120 | 1.378E+38 | 0.17 | 0.31 | 4.30 | 3 SV-I,GC 2 |
| 190.7552 | 2.7421 | 83 | 8.723E+37 | 0.16 | 0.29 | 4.32 | 3 |
| 190.7796 | 2.6748 | 16 | 1.833E+37 | 0.09 | 0.68 | 4.38 | 2 GC 66 |
| 190.7128 | 2.7613 | 12 | 1.323E+37 | 0.41 | -0.22 | 4.42 | 2 |
| 190.7231 | 2.6155 | 12 | 1.466E+37 | -0.12 | 0.86 | 4.43 | 2 GC 42 |
| 190.6344 | 2.6966 | 40 | 5.025E+37 | 0.08 | 0.62 | 4.43 | 2 |
| 190.7825 | 2.6849 | 17 | 1.905E+37 | -0.28 | 0.09 | 4.49 | 2 |
| 190.6790 | 2.7570 | 12 | 1.413E+37 | 0.06 | 0.78 | 4.50 | 2 |
| 190.6494 | 2.7349 | 26 | 3.193E+37 | 0.01 | 0.10 | 4.50 | 2 |
| 190.6447 | 2.7308 | 19 | 2.411E+37 | 0.19 | 0.12 | 4.58 | 2 GC 40 |
| 190.7469 | 2.7535 | 19 | 2.081E+37 | 0.13 | 0.39 | 4.59 | 2 |
| 190.6821 | 2.7600 | 57 | 6.509E+37 | -0.18 | -0.21 | 4.60 | 2 V |
| 190.7004 | 2.7646 | 17 | 1.952E+37 | 0.17 | 0.21 | 4.63 | 3 GC 1 |
| 190.7056 | 2.7652 | 117 | 1.300E+38 | 0.06 | 0.54 | 4.65 | 3 GC 29 |
| 190.7309 | 2.6129 | 45 | 5.396E+37 | 0.02 | 0.52 | 4.70 | 3 |
| 190.6667 | 2.7547 | 20 | 2.426E+37 | -0.45 | -0.04 | 4.71 | 2 |
| 190.6925 | 2.7648 | 29 | 3.309E+37 | 0.13 | 0.58 | 4.71 | 3 GC 11 |
| 190.6433 | 2.7329 | 12 | 1.519E+37 | -0.05 | 0.23 | 4.72 | 2 |
| 190.6289 | 2.6775 | 23 | 3.015E+37 | -0.03 | 0.43 | 4.77 | 2 GC 41 |
| 190.7080 | 2.6068 | 13 | 2.513E+37 | 0.01 | 0.60 | 4.86 | 3 SV-S,GC 30 |
| 190.7533 | 2.6181 | 12 | 1.509E+37 | 0.05 | 0.25 | 5.00 | 2 |
| 190.6708 | 2.6102 | 23 | 4.389E+37 | 0.04 | 0.51 | 5.16 | 3 GC 33 |
| 190.6772 | 2.7682 | 24 | 2.829E+37 | 0.05 | 0.40 | 5.16 | 3 |
| 190.6942 | 2.7729 | 12 | 1.402E+37 | 0.20 | -0.11 | 5.17 | 2 GC 76 |
| 190.6229 | 2.7059 | 66 | 8.587E+37 | 0.05 | 0.42 | 5.20 | 2 MV,SV-I,GC 69 |
| 190.6739 | 2.7687 | 18 | 2.169E+37 | -0.76 | -0.14 | 5.26 | 2 |
| 190.6947 | 2.7748 | 19 | 2.194E+37 | 0.24 | 0.65 | 5.28 | 2 |
| 190.7299 | 2.7745 | 31 | 3.429E+37 | 0.06 | 0.30 | 5.37 | 2 V,GC 68 |
| 190.6633 | 2.6097 | 13 | 1.776E+37 | 0.02 | 0.67 | 5.39 | 3 |
| 190.7489 | 2.6077 | 10 | 1.281E+37 | 0.22 | 0.07 | 5.40 | 2 |
| 190.7923 | 2.7210 | 126 | 1.381E+38 | 0.22 | 0.70 | 5.45 | 2 |
| 190.7172 | 2.7783 | 57 | 6.405E+37 | 0.11 | 0.43 | 5.46 | 3 SV-S |
| 190.7938 | 2.7207 | 134 | 1.468E+38 | 0.12 | 0.42 | 5.53 | 2 GC 56 |
| 190.6608 | 2.7673 | 17 | 2.131E+37 | 0.15 | 0.77 | 5.54 | 2 |
| 190.7187 | 2.7797 | 26 | 2.969E+37 | -0.13 | 0.24 | 5.55 | 2 |
| 190.6781 | 2.7758 | 59 | 6.904E+37 | 0.11 | 0.39 | 5.57 | 3 |
| 190.7851 | 2.6359 | 20 | 2.379E+37 | 0.05 | 0.19 | 5.59 | 2 GC 73 |
| 190.6721 | 2.7743 | 13 | 1.617E+37 | -0.16 | 0.44 | 5.62 | 2 |
| 190.7891 | 2.7349 | 18 | 1.978E+37 | 0.11 | 0.33 | 5.64 | 2 V |
| 190.7840 | 2.6313 | 12 | 1.490E+37 | 0.15 | 0.14 | 5.69 | 2 GC 57 |
| 190.7018 | 2.7829 | 28 | 3.237E+37 | 0.10 | 1.00 | 5.72 | 2 SV-I |
| 190.6351 | 2.7499 | 13 | 1.646E+37 | -0.15 | -0.22 | 5.74 | 2 SV-I |
| 190.6443 | 2.7595 | 39 | 4.901E+37 | 0.06 | 0.56 | 5.75 | 2 GC 63 |
| 190.7404 | 2.7782 | 75 | 8.198E+37 | 0.05 | 0.36 | 5.77 | 2 V |
| 190.8047 | 2.6861 | 17 | 1.983E+37 | -0.49 | 0.01 | 5.82 | 2 |
| 190.6633 | 2.7747 | 15 | 1.907E+37 | 0.19 | 0.25 | 5.85 | 2 |
| 190.7145 | 2.5904 | 23 | 3.006E+37 | -0.06 | 0.37 | 5.86 | 3 SV-S |
| 190.6752 | 2.7802 | 19 | 2.284E+37 | 0.19 | 0.01 | 5.88 | 2 V,GC 45 |
| 190.6507 | 2.6077 | 26 | 3.574E+37 | 0.02 | 0.44 | 5.90 | 2 V |
| 190.7191 | 2.7864 | 39 | 4.383E+37 | 0.14 | 0.44 | 5.96 | 3 SV-S |
| 190.7946 | 2.6365 | 57 | 6.682E+37 | 0.07 | 0.52 | 6.05 | 2 GC 70 |
| 190.6769 | 2.7845 | 54 | 6.464E+37 | -0.25 | 0.05 | 6.09 | 3 |
| 190.6586 | 2.7768 | 49 | 5.974E+37 | -0.70 | -0.05 | 6.10 | 3 |
| 190.6697 | 2.7822 | 15 | 1.843E+37 | -0.04 | -0.03 | 6.11 | 2 |
| 190.7817 | 2.6162 | 15 | 1.853E+37 | 0.08 | -0.02 | 6.18 | 2 |
| 190.8103 | 2.6704 | 97 | 1.108E+38 | 0.18 | 0.36 | 6.24 | 2 |
| 190.6988 | 2.5840 | 58 | 7.554E+37 | 0.03 | 0.32 | 6.25 | 3 SV-S SV-I |
| 190.6505 | 2.6007 | 14 | 2.724E+37 | 0.35 | -0.07 | 6.25 | 3 MV,GC 27 |
| 190.7200 | 2.7920 | 208 | 2.355E+38 | -0.03 | 0.26 | 6.29 | 3 GC 10 |
| 190.7666 | 2.7751 | 25 | 2.813E+37 | -0.06 | 0.28 | 6.32 | 3 |
| 190.6517 | 2.7771 | 152 | 1.885E+38 | -0.60 | -0.01 | 6.33 | 2 |
| 190.7751 | 2.7704 | 87 | 9.453E+37 | 0.14 | 0.66 | 6.39 | 3 |
| 190.6832 | 2.7927 | 23 | 2.749E+37 | 0.00 | -0.11 | 6.47 | 2 |
| 190.6098 | 2.6426 | 45 | 6.378E+37 | 0.10 | 0.23 | 6.47 | 2 |
| 190.7157 | 2.7963 | 18 | 2.057E+37 | -0.06 | -0.33 | 6.53 | 2 |
| 190.8140 | 2.7261 | 82 | 9.271E+37 | 0.01 | 0.28 | 6.78 | 2 GC 39 |
| 190.7129 | 2.8007 | 207 | 2.398E+38 | 0.03 | 0.31 | 6.78 | 3 V, SV-S |
| 190.7639 | 2.5887 | 16 | 2.085E+37 | 0.02 | 0.40 | 6.84 | 2 |
| 190.7948 | 2.7635 | 146 | 1.631E+38 | 0.06 | 0.34 | 6.92 | 3 |
| 190.7406 | 2.5758 | 16 | 2.072E+37 | 0.08 | 0.37 | 7.00 | 2 SV-I |
| 190.7421 | 2.7996 | 39 | 4.434E+37 | 0.19 | 0.08 | 7.02 | 3 GC 4 |
| 190.7293 | 2.5708 | 16 | 5.387E+37 | -0.23 | 0.23 | 7.14 | 1 V |
| 190.8258 | 2.7028 | 42 | 4.910E+37 | 0.10 | 0.62 | 7.14 | 2 GC 49 |
| 190.6624 | 2.5769 | 235 | 7.556E+38 | -0.79 | -0.10 | 7.19 | 1 SV-S |
| 190.7416 | 2.8036 | 66 | 7.575E+37 | 0.10 | 0.36 | 7.24 | 2 V |
| 190.7074 | 2.8148 | 21 | 2.517E+37 | -0.13 | -0.31 | 7.62 | 2 |
| 190.7636 | 2.5699 | 21 | 2.851E+37 | 0.14 | 0.40 | 7.83 | 2 SV-I |
| 190.8375 | 2.7038 | 49 | 5.827E+37 | 0.02 | 0.60 | 7.84 | 3 |
| 190.7223 | 2.8182 | 118 | 1.403E+38 | 0.10 | 0.27 | 7.87 | 3 V,SV-S |
| 190.7454 | 2.8145 | 24 | 2.869E+37 | 0.26 | 0.48 | 7.93 | 2 |
| 190.7236 | 2.5557 | 11 | 3.692E+37 | 0.28 | 0.67 | 7.98 | 1 SV-S |
| 190.8043 | 2.7805 | 38 | 4.426E+37 | -0.04 | 0.35 | 8.03 | 2 V,GC 74 |
| 190.7673 | 2.8081 | 39 | 1.181E+38 | 0.48 | 0.26 | 8.05 | 1 |
| 190.8414 | 2.6695 | 48 | 5.789E+37 | -0.03 | 0.36 | 8.10 | 2 |
| 190.7858 | 2.7982 | 75 | 8.635E+37 | 0.14 | 0.35 | 8.12 | 2 V,MV,SV-I |
| 190.8364 | 2.6455 | 36 | 4.456E+37 | 0.29 | 0.53 | 8.12 | 2 |
| 190.7984 | 2.7891 | 38 | 4.447E+37 | 0.09 | 0.76 | 8.16 | 2 GC 50 |
| 190.7698 | 2.8098 | 101 | 1.170E+38 | 0.01 | 0.26 | 8.21 | 3 |
| 190.6817 | 2.8229 | 28 | 3.510E+37 | 0.15 | 0.95 | 8.26 | 2 |
| 190.8465 | 2.6912 | 35 | 4.275E+37 | 0.04 | 0.53 | 8.33 | 2 MV,SV-I |
| 190.8180 | 2.6006 | 23 | 3.028E+37 | 0.16 | 1.01 | 8.43 | 2 |
| 190.7072 | 2.5458 | 98 | 3.270E+38 | -0.01 | 0.09 | 8.52 | 1 SV-S |
| 190.8513 | 2.6851 | 53 | 6.422E+37 | -0.04 | -0.16 | 8.61 | 2 V |
| 190.8526 | 2.6939 | 68 | 8.306E+37 | 0.16 | 0.42 | 8.70 | 2 V |
| 190.7123 | 2.8328 | 53 | 6.580E+37 | 0.10 | 0.57 | 8.70 | 3 SV-S |
| 190.7614 | 2.8228 | 162 | 1.924E+38 | 0.07 | 0.31 | 8.72 | 3 |
| 190.6728 | 2.8292 | 93 | 1.201E+38 | 0.10 | 0.59 | 8.74 | 3 SV-S |
| 190.8028 | 2.5764 | 35 | 1.305E+38 | 0.09 | 0.63 | 8.79 | 3 V |
| 190.7301 | 2.8325 | 452 | 5.500E+38 | 0.00 | 0.18 | 8.79 | 3 SV-S |
| 190.7847 | 2.5615 | 119 | 1.611E+38 | 0.02 | 0.33 | 8.87 | 2 MV,SV-I,GC 47 |
| 190.6504 | 2.8267 | 31 | 4.178E+37 | 0.08 | 0.35 | 9.01 | 2 SV-I |
| 190.7924 | 2.5636 | 23 | 3.164E+37 | -0.29 | 0.47 | 9.02 | 2 V |
| 190.7341 | 2.5390 | 176 | 6.143E+38 | -0.05 | 0.21 | 9.07 | 1 |
| 190.7491 | 2.8339 | 74 | 8.996E+37 | 0.07 | 0.52 | 9.11 | 2 V,GC 75 |
| 190.8599 | 2.7032 | 35 | 4.372E+37 | -0.08 | 0.25 | 9.17 | 3 |
| 190.8532 | 2.7455 | 383 | 4.630E+38 | -0.04 | 0.24 | 9.39 | 3 V,GC 38 |
| 190.6856 | 2.8437 | 34 | 4.476E+37 | 0.18 | 0.40 | 9.45 | 2 |
| 190.7259 | 2.8444 | 23 | 2.917E+37 | -0.39 | -0.24 | 9.46 | 2 GC 71 |
| 190.8321 | 2.5899 | 40 | 5.338E+37 | 0.15 | 0.55 | 9.50 | 3 V |
| 190.8461 | 2.7666 | 11 | 1.365E+37 | 0.22 | 0.82 | 9.55 | 2 |
| 190.8317 | 2.7905 | 55 | 6.692E+37 | 0.16 | 0.49 | 9.66 | 2 |
| 190.8581 | 2.6283 | 12 | 4.567E+37 | -0.08 | 0.48 | 9.70 | 1 |
| 190.6874 | 2.5266 | 12 | 4.378E+37 | -0.01 | 0.67 | 9.75 | 1 |
| 190.8418 | 2.7801 | 35 | 4.272E+37 | 0.17 | 0.37 | 9.77 | 2 GC 55 |
| 190.7280 | 2.8495 | 88 | 1.124E+38 | 0.00 | 1.52 | 9.78 | 2 |
| 190.7896 | 2.5464 | 34 | 1.304E+38 | 0.04 | 0.11 | 9.80 | 1 |
| 190.8519 | 2.6092 | 87 | 1.155E+38 | 0.10 | 0.39 | 9.85 | 3 |
| 190.8722 | 2.6888 | 42 | 5.421E+37 | -0.13 | 0.04 | 9.87 | 2 |
| 190.7901 | 2.8304 | 41 | 5.092E+37 | 0.06 | 0.40 | 9.88 | 2 |
| 190.7921 | 2.5462 | 13 | 5.127E+37 | -0.32 | -0.27 | 9.89 | 1 |
| 190.8692 | 2.6518 | 17 | 2.196E+37 | -0.43 | 1.06 | 9.92 | 2 |
| 190.7951 | 2.8287 | 79 | 9.609E+37 | 0.06 | 0.36 | 9.95 | 3 |
| 190.8739 | 2.6925 | 17 | 2.237E+37 | 0.17 | 1.16 | 9.97 | 2 |
| 190.7585 | 2.8470 | 72 | 9.015E+37 | 0.11 | 0.37 | 10.03 | 2 V |
| 190.7277 | 2.8547 | 84 | 1.087E+38 | 0.29 | 0.17 | 10.08 | 3 SV-S |
| 190.6868 | 2.5200 | 19 | 6.576E+37 | 0.06 | 0.56 | 10.15 | 1 |
| 190.6927 | 2.8563 | 37 | 5.018E+37 | 0.23 | 0.21 | 10.15 | 2 |
| 190.7751 | 2.8464 | 22 | 2.859E+37 | 0.00 | 0.46 | 10.34 | 2 |
| 190.8830 | 2.6974 | 13 | 4.634E+37 | -0.73 | -0.13 | 10.53 | 1 |
| 190.8663 | 2.6102 | 43 | 5.825E+37 | -0.10 | -0.13 | 10.59 | 2 V,GC 67 |
| 190.7279 | 2.8654 | 26 | 3.548E+37 | -0.12 | 0.38 | 10.73 | 2 SV-I |
| 190.8795 | 2.7406 | 198 | 2.536E+38 | 0.03 | 0.35 | 10.78 | 3 V,GC 9 |
| 190.8565 | 2.5832 | 25 | 3.559E+37 | 0.08 | -0.23 | 10.91 | 2 |
| 190.8772 | 2.6210 | 239 | 3.258E+38 | 0.02 | -0.34 | 10.93 | 2 V |
| 190.8600 | 2.7887 | 104 | 1.322E+38 | -0.30 | 0.76 | 10.96 | 2 V |
| 190.8168 | 2.8347 | 292 | 3.754E+38 | 0.05 | 0.38 | 10.98 | 3 |
| 190.5862 | 2.8261 | 51 | 6.021E+37 | -0.05 | 0.87 | 11.04 | 2 |
| 190.8914 | 2.6655 | 99 | 1.327E+38 | 0.06 | 0.28 | 11.10 | 3 |
| 190.5899 | 2.8305 | 119 | 1.423E+38 | 0.18 | -0.15 | 11.10 | 2 GC 64 |
| 190.8289 | 2.5477 | 19 | 7.484E+37 | -0.03 | 0.85 | 11.11 | 1 V |
| 190.8773 | 2.6116 | 51 | 7.046E+37 | -0.21 | 0.41 | 11.16 | 2 GC 60 |
| 190.8604 | 2.7946 | 6 | 2.502E+37 | -0.03 | 0.78 | 11.18 | 1 |
| 190.8825 | 2.6190 | 234 | 3.243E+38 | -0.47 | -0.03 | 11.27 | 3 V,SV-S,SV-I |
| 190.8647 | 2.7920 | 96 | 1.241E+38 | 0.24 | 0.81 | 11.30 | 2 V |
| 190.8721 | 2.5928 | 11 | 1.638E+37 | 0.10 | 1.21 | 11.39 | 2 SV-I |
| 190.6422 | 2.5087 | 102 | 3.627E+38 | -0.55 | -0.06 | 11.45 | 1 |
| 190.8904 | 2.6316 | 21 | 7.836E+37 | 0.30 | 0.63 | 11.46 | 1 V |
| 190.8589 | 2.5708 | 26 | 3.756E+37 | -0.34 | 0.59 | 11.47 | 2 |
| 190.8991 | 2.6925 | 10 | 3.637E+37 | -1.11 | 0.00 | 11.48 | 1 |
| 190.9016 | 2.6698 | 25 | 3.475E+37 | -1.14 | -0.05 | 11.68 | 2 SV-I |
| 190.6157 | 2.5160 | 202 | 7.260E+38 | -1.08 | 0.00 | 11.69 | 1 |
| 190.8678 | 2.8009 | 56 | 7.407E+37 | 0.18 | 0.07 | 11.76 | 2 |
| 190.6188 | 2.5121 | 191 | 6.864E+38 | 0.09 | 0.34 | 11.82 | 1 |
| 190.8584 | 2.5550 | 48 | 7.187E+37 | -0.02 | 0.61 | 12.05 | 2 |
| 190.5944 | 2.8600 | 133 | 1.597E+38 | -0.01 | 0.44 | 12.37 | 2 GC 48 |
| 190.8530 | 2.5411 | 14 | 5.517E+37 | 0.19 | -0.44 | 12.39 | 1 |
| 190.9025 | 2.7590 | 14 | 5.503E+37 | -1.12 | 0.00 | 12.44 | 1 |
| 190.8936 | 2.5930 | 20 | 7.532E+37 | -0.14 | 0.53 | 12.52 | 1 |
| 190.9175 | 2.6702 | 10 | 3.726E+37 | -0.02 | -0.38 | 12.63 | 1 |
| 190.8949 | 2.7845 | 11 | 4.428E+37 | 0.57 | -0.57 | 12.64 | 1 |
| 190.8860 | 2.8017 | 19 | 2.666E+37 | 0.13 | 0.89 | 12.69 | 2 |
| 190.9199 | 2.7405 | 26 | 9.712E+37 | -0.81 | 0.20 | 13.11 | 1 V |
| 190.9021 | 2.7936 | 68 | 9.648E+37 | 0.11 | 0.44 | 13.28 | 2 V |
| 190.8952 | 2.5657 | 64 | 2.467E+38 | 0.03 | 0.62 | 13.42 | 1 |
| 190.9166 | 2.7686 | 24 | 9.205E+37 | -0.17 | 1.07 | 13.44 | 1 V |
| 190.9256 | 2.6188 | 71 | 2.715E+38 | 0.09 | 0.55 | 13.71 | 1 |
| 190.6006 | 2.8907 | 74 | 9.099E+37 | 0.32 | 0.41 | 13.77 | 2 |
| 190.8863 | 2.5427 | 12 | 4.759E+37 | -0.16 | 1.76 | 13.81 | 1 |
| 190.9240 | 2.7673 | 19 | 7.399E+37 | 0.14 | 0.91 | 13.83 | 1 |
| 190.9210 | 2.5343 | 59 | 2.395E+38 | 0.06 | 0.54 | 15.77 | 1 |
| N | R.A. (X-ray) | Dec (X-ray) | Offset(′′) | CTIO IDaaDirsch et al. 2005 | R.A. (optical) | Dec (optical) | C-R color | R magnitude |
|---|---|---|---|---|---|---|---|---|
| 1 | 190.7004 | 2.7646 | 0.86 | 1065 | 190.70016 | 2.76461 | 1.33 | 22.98 |
| 2 | 190.6769 | 2.7526 | 0.08 | 953 | 190.67691 | 2.75253 | 1.51 | 22.23 |
| 3 | 190.7712 | 2.6908 | 0.92 | 1397 | 190.77124 | 2.69050 | 1.73 | 21.25 |
| 4 | 190.7421 | 2.7996 | 0.96 | 6947 | 190.74225 | 2.79939 | 1.13 | 22.29 |
| 5 | 190.6569 | 2.6927 | 0.48 | 13398 | 190.65686 | 2.69261 | 1.89 | 21.99 |
| 6 | 190.7647 | 2.6900 | 0.66 | 1372 | 190.76462 | 2.68983 | 0.53 | 20.67 |
| 7 | 190.7625 | 2.6541 | 0.55 | 1369 | 190.76241 | 2.65403 | 1.31 | 22.15 |
| 8 | 190.6601 | 2.6978 | 0.13 | 5431 | 190.66005 | 2.69781 | 1.55 | 20.95 |
| 9 | 190.8795 | 2.7406 | 1.46 | 8963 | 190.87991 | 2.74064 | 1.18 | 22.45 |
| 10 | 190.7200 | 2.7920 | 0.16 | 1150 | 190.72008 | 2.79194 | 0.50 | 19.63 |
| 11 | 190.6925 | 2.7648 | 0.13 | 1033 | 190.69255 | 2.76486 | 1.50 | 20.91 |
| 12 | 190.6787 | 2.6805 | 0.36 | 5720 | 190.67862 | 2.68039 | 1.01 | 22.72 |
| 13 | 190.7211 | 2.7123 | 0.46 | 11565 | 190.72099 | 2.71228 | 1.95 | 21.26 |
| 14 | 190.7068 | 2.7288 | 0.29 | 11489 | 190.70676 | 2.72878 | 2.01 | 20.79 |
| 15 | 190.7320 | 2.6479 | 0.65 | 6764 | 190.73192 | 2.64772 | 1.17 | 20.76 |
| 16 | 190.7145 | 2.6435 | 0.60 | 6444 | 190.71432 | 2.64339 | 1.94 | 23.02 |
| 17 | 190.7647 | 2.6847 | 0.76 | 15298 | 190.76462 | 2.68450 | 1.77 | 22.85 |
| 18 | 190.6538 | 2.6703 | 1.19 | 5310 | 190.65363 | 2.67006 | 1.09 | 22.26 |
| 19 | 190.7047 | 2.6796 | 0.79 | 13675 | 190.70488 | 2.67981 | 0.94 | 20.65 |
| 20 | 190.7369 | 2.6863 | 0.51 | 13857 | 190.73683 | 2.68619 | 1.57 | 20.87 |
| 21 | 190.7194 | 2.7107 | 0.53 | 6526 | 190.71925 | 2.71069 | 0.68 | 23.13 |
| 22 | 190.6787 | 2.6817 | 0.33 | 13510 | 190.67859 | 2.68175 | 1.02 | 23.46 |
| 23 | 190.6894 | 2.7434 | 0.24 | 5961 | 190.68933 | 2.74331 | 1.50 | 22.94 |
| 24 | 190.7195 | 2.6854 | 0.96 | 6525 | 190.71921 | 2.68525 | 1.55 | 20.41 |
| 25 | 190.6809 | 2.6417 | 0.33 | 5760 | 190.68088 | 2.64158 | 1.38 | 21.06 |
| 26 | 190.7296 | 2.6897 | 0.27 | 13824 | 190.72963 | 2.68958 | 1.45 | 23.36 |
| 27 | 190.6505 | 2.6007 | 0.87 | 15478 | 190.65050 | 2.60050 | 0.31 | 23.04 |
| 28 | 190.6781 | 2.7048 | 0.55 | 960 | 190.67825 | 2.70486 | 1.82 | 20.39 |
| 29 | 190.7056 | 2.7652 | 0.25 | 6281 | 190.70566 | 2.76522 | 1.41 | 21.28 |
| 30 | 190.7080 | 2.6068 | 1.08 | 1098 | 190.70799 | 2.60650 | 1.79 | 21.20 |
| 31 | 190.6797 | 2.7138 | 0.14 | 5739 | 190.67963 | 2.71386 | 1.45 | 20.64 |
| 32 | 190.7348 | 2.6449 | 0.66 | 13847 | 190.73462 | 2.64481 | 1.75 | 20.97 |
| 33 | 190.6708 | 2.6102 | 1.16 | 13483 | 190.67082 | 2.60986 | 0.02 | 22.70 |
| 34 | 190.7646 | 2.6689 | 0.97 | 7355 | 190.76457 | 2.66864 | 1.66 | 22.89 |
| 35 | 190.6779 | 2.7223 | 0.17 | 5705 | 190.67783 | 2.72228 | 1.35 | 22.94 |
| 36 | 190.7556 | 2.6970 | 0.64 | 7203 | 190.75549 | 2.69692 | 1.34 | 21.79 |
| 37 | 190.6907 | 2.7206 | 1.19 | 5983 | 190.69046 | 2.72042 | 1.88 | 21.07 |
| 38 | 190.8532 | 2.7455 | 0.60 | 1707 | 190.85333 | 2.74550 | 0.75 | 20.30 |
| 39 | 190.8140 | 2.7261 | 0.68 | 8118 | 190.81387 | 2.72597 | 1.30 | 22.18 |
| 40 | 190.6447 | 2.7308 | 0.23 | 5145 | 190.64467 | 2.73078 | 1.39 | 21.20 |
| 41 | 190.6289 | 2.6775 | 0.46 | 4905 | 190.62888 | 2.67739 | 1.81 | 21.81 |
| 42 | 190.7231 | 2.6155 | 0.60 | 11574 | 190.72308 | 2.61533 | 1.75 | 21.29 |
| 43 | 190.7668 | 2.7411 | 1.50 | 7388 | 190.76653 | 2.74081 | 1.66 | 20.39 |
| 44 | 190.7333 | 2.7030 | 0.84 | 11643 | 190.73305 | 2.70289 | 1.71 | 23.14 |
| 45 | 190.6752 | 2.7802 | 0.05 | 5651 | 190.67525 | 2.78025 | 1.61 | 20.24 |
| 46 | 190.7250 | 2.6979 | 0.65 | 6619 | 190.72482 | 2.69783 | 1.66 | 21.46 |
| 47 | 190.7847 | 2.5615 | 0.96 | 7666 | 190.78458 | 2.56131 | 0.03 | 22.12 |
| 48 | 190.5944 | 2.8600 | 1.26 | 4352 | 190.59471 | 2.85992 | 0.11 | 22.10 |
| 49 | 190.8258 | 2.7028 | 0.91 | 8282 | 190.82558 | 2.70283 | 0.20 | 21.40 |
| 50 | 190.7984 | 2.7891 | 1.03 | 7866 | 190.79807 | 2.78914 | 1.58 | 21.41 |
| 51 | 190.7773 | 2.6984 | 0.84 | 7545 | 190.77711 | 2.69828 | 1.78 | 22.49 |
| 52 | 190.7330 | 2.6690 | 0.72 | 6780 | 190.73286 | 2.66892 | 1.77 | 22.77 |
| 53 | 190.6644 | 2.7046 | 0.56 | 11250 | 190.66429 | 2.70456 | 1.87 | 22.06 |
| 54 | 190.6927 | 2.7157 | 0.74 | 13583 | 190.69255 | 2.71553 | 1.68 | 21.26 |
| 55 | 190.8418 | 2.7801 | 1.30 | 1655 | 190.84216 | 2.78000 | 1.07 | 19.72 |
| 56 | 190.7938 | 2.7207 | 1.00 | 1482 | 190.79353 | 2.72056 | 1.76 | 22.32 |
| 57 | 190.7840 | 2.6313 | 0.47 | 7652 | 190.78391 | 2.63119 | 1.74 | 22.34 |
| 58 | 190.6774 | 2.7211 | 0.57 | 5692 | 190.67725 | 2.72097 | 0.14 | 21.26 |
| 59 | 190.7496 | 2.6800 | 0.41 | 7081 | 190.74950 | 2.67989 | 1.57 | 22.55 |
| 60 | 190.8773 | 2.6116 | 0.93 | 8933 | 190.87746 | 2.61133 | 0.93 | 22.66 |
| 61 | 190.6699 | 2.6470 | 0.22 | 918 | 190.66991 | 2.64692 | 1.27 | 21.70 |
| 62 | 190.6877 | 2.6931 | 0.55 | 13554 | 190.68767 | 2.69294 | 1.29 | 22.87 |
| 63 | 190.6443 | 2.7595 | 0.75 | 5133 | 190.64412 | 2.75936 | 1.63 | 20.70 |
| 64 | 190.5899 | 2.8305 | 0.21 | 10851 | 190.58997 | 2.83044 | 0.92 | 21.81 |
| 65 | 190.7268 | 2.7077 | 0.71 | 6655 | 190.72670 | 2.70756 | 1.08 | 21.77 |
| 66 | 190.7796 | 2.6748 | 0.86 | 1435 | 190.77940 | 2.67458 | 1.50 | 21.37 |
| 67 | 190.8663 | 2.6102 | 0.32 | 8799 | 190.86624 | 2.61025 | 0.23 | 22.20 |
| 68 | 190.7299 | 2.7745 | 0.63 | 6707 | 190.72980 | 2.77442 | 1.86 | 21.90 |
| 69 | 190.6229 | 2.7059 | 0.66 | 4797 | 190.62283 | 2.70572 | 0.10 | 22.53 |
| 70 | 190.7946 | 2.6365 | 0.61 | 7822 | 190.79445 | 2.63642 | 1.74 | 21.86 |
| 71 | 190.7259 | 2.8444 | 0.71 | 11588 | 190.72574 | 2.84436 | 1.17 | 20.44 |
| 72 | 190.7317 | 2.5883 | 0.76 | 1215 | 190.73149 | 2.58814 | 1.61 | 20.06 |
| 73 | 190.7851 | 2.6359 | 0.66 | 7670 | 190.78496 | 2.63578 | 1.85 | 23.09 |
| 74 | 190.8043 | 2.7805 | 0.84 | 7973 | 190.80437 | 2.78031 | 0.02 | 22.51 |
| 75 | 190.7491 | 2.8339 | 0.71 | 13910 | 190.74892 | 2.83386 | 1.36 | 23.23 |
| 76 | 190.6942 | 2.7729 | 0.70 | 6052 | 190.69403 | 2.77278 | 1.73 | 21.57 |
| 77 | 190.7134 | 2.6774 | 1.01 | 15522 | 190.71320 | 2.67719 | 0.92 | 23.01 |