High spatial resolution mid-infrared spectroscopy of the starburst galaxies NGC 3256, II Zw 40 and Henize 2-10††thanks: Based on observations obtained at the European Southern Observatory, La Silla, Chile (ID 70.B-0583).
Abstract
Aims. In order to show the importance of high spatial resolution observations of extra-galactic sources when compared to observations obtained with larger apertures such as ISO, we present -band spectra (8–13 m) of some locations in three starburst galaxies. In particular, the two galactic nuclei of the spiral galaxy NGC 3256, the compact IR supernebula in the dwarf galaxy II Zw 40 and the two brightest IR knots in the central starburst of the WR galaxy He 2–10.
Methods. The spectra have been obtained with TIMMI2 on the ESO 3.6 m telescope. An inventory of the spectra in terms of atomic fine-structure lines and molecular bands is presented.
Results. We show the great value of these high spatial resolution data at constraining properties such as the extinction in the mid-IR, metallicity or stellar content (age, IMF, etc.). Regarding this, we have constrained the stellar content of the IR compact knot in II Zw 40 by using the mid-IR fine-structure lines and setting restrictions on the nebular geometry.
Considering the PAH bands, we have constructed a new mid-/far-IR diagnostic diagram based on the 11.2 m PAH and continuum, accessible to ground-based observations. We find that extra-galactic nuclei and star clusters observed at high spatial resolution (as is the case of the TIMMI2 observations) are closer in PAH/far-IR to compact H ii regions, while galaxies observed by large apertures such as ISO are closer to exposed PDRs such as Orion. This is certainly due to the aperture difference, where the much larger ISO aperture likely includes much of the surrounding PDRs while the TIMMI2 slit measures mainly the central emission of the H ii region.
Finally, we find a dependence between the presence or non-presence of PAHs and the hardness of the radiation field as measured by the [S iv]/[Ne ii] ratio. In particular, sources with PAH emission have in general a [S iv]/[Ne ii] ratio . We investigate possible origins for this relation and conclude that it does not necessarily imply PAH destruction, but could also be explained by the PAH-dust competition for FUV photons. We have also considered the scenario where the low PAH emission could just be a consequence of the relative contribution of the different phases of the interstellar medium, in particular, the presence of a pervasive and highly ionised medium.
Key Words.:
ISM: lines and bands – ISM: dust, extinction – ISM: H ii region – Galaxies: starburst – Galaxies: individual: NGC 3256, II Zw 40, He 2-10 – Infrared: galaxies1 Introduction
Mid-infrared (MIR) observations have proved to be of great value at providing spectral diagnostics to quantify massive star formation and to distinguish between stellar (starburst) and other (AGN) activity (e.g. genzel00). However, most of these diagnostics are based on “integrated spectra” which have been obtained through large apertures e.g. with the Infrared Space Observatory, ISO, with an aperture larger than 14″ for ISO/SWS (cf. schaerer99; thornley00; forster01; rigby04). Therefore, these measurements are likely to consist of contributions from numerous “knots”, the diffuse ISM, etc. rendering their interpretation difficult. Furthermore, some diagnostics (e.g. relating PAH and continuum emission, high and low excitation fine-structure lines) may originate from different spatial regions and in consequence, it is by no means clear if, and to what extent, such spatially integrated or “global” spectra can be used for various diagnostic purposes.
In this respect, it has already been demonstrated how the spatial scale of the observations greatly determine the MIR appearance of galaxies (e.g. martin:ngc5253; siebenmorgen04). This is the case of, for instance, the starburst galaxy NGC 5253, where most of the high-excitation fine-structure line fluxes measured by within ISO aperture (e.g. [S iv]) are emitted by a single knot of 01, while other sources within the aperture mainly contribute to the low-excitation line fluxes. For instance, only 20% of the [Ne ii] emission comes from the otherwise dominant compact knot (martin:ngc5253). This has important implications in the interpretation of line fluxes in terms of properties of the stellar content such as age, IMF, etc.
We have recently started gathering ground-based high spatial resolution MIR observations of several nearby starbursts using TIMMI2 on the 3.6 m telescope, which provides a slit width of 12. Our pilot work on the well studied NGC 5253 (martin:ngc5253) demonstrated the great value of these type of data at constraining properties such as the extinction in the MIR, metallicity or stellar content (age, IMF, etc.). Here we present observations of some locations in three young starburst galaxies. Two of these, the dwarf galaxy II Zw 40 and the WR galaxy He 2–10 are, together with NGC 5253, well known young starburst galaxies which possess embedded and compact knots likely representing the earliest evolutionary stages of super star clusters (SSCs) or proto-globular clusters (e.g. turner98; kobulnicky99; beck02; vacca02; johnson03). MIR images of these type of galaxies (e.g. gorjian01; beck01) confirm the cluster hypothesis and indicate that a large fraction (%) of the total IR luminosity may originate from these compact knots. The third starburst galaxy we present here is NGC 3256, a spiral galaxy which is the brightest IR source in the nearby universe. MIR images (boker97) reveal that NGC 3256 has two distinct nuclei aligned in the north-south direction and separated by 5″. The southern nucleus has no optical counterpart. Hence, our observations include the two galactic nuclei of NGC 3256, the bright and compact infrared supernebula in II Zw 40 and the two brightest infrared sources in the central starburst of He 2–10 (named A and C following the nomenclature by beck01).
The core of this paper is structured as follows. Our observations are described in Sect. 2. Immediate results from our TIMMI2 spectra are shown in Sect. 3. Here we present for each object a general description, a discussion of the content of its -band spectrum and constraints on the extinction and metallicity. Our main results are presented in Sect. LABEL:sect:discussion, where we discuss the importance of high spatial resolution observations, make a comparison between the general properties of these galaxies, examine the implications of the presence of PAH emission and constrain the stellar content of the IR supernebula in II Zw 40. The main conclusions of the paper are summarised in Sect. LABEL:sect:conclusions.
2 Observations and data reduction
Our new infrared data on NGC 3256, II Zw 40 and He 2–10 were obtained as part of a program to observe young starburst galaxies with the Thermal Infrared MultiMode Instrument (TIMMI2) on the ESO 3.6 m telescope (La Silla Observatory, Chile).
The -band spectra of the nuclear regions of these three starburst galaxies were obtained on 2003 March 20–26. We used the 10 m low-resolution grism which ranges from 7.5 to 13.9 m and has a spectral resolving power . The slit used was 1270″, with a pixel scale of 045. At the time of the observations, the slit could only be oriented in the north-south direction. It was positioned across the bright northern nucleus in the case of NGC 3256 (including as well the southern nucleus), across the bright infrared compact core in the case of II Zw 40 and across the two brightest MIR components in the case of He 2–10, A and C (we refer to Sects. 3.1.1, 3.2.1 and 3.3.1 for a detailed description of the objects). In order to correct for background emission from the sky, the observations were performed using a standard chopping/nodding technique along the slit in the north-south direction (where the object is observed at two different positions on the slit) with an amplitude of 20″ in the case of NGC 3256 and 10″ in the cases of II Zw 40 and He 2–10. Adopted calibration stars were HD 90957 for NGC 3256, HD 37160 for II Zw 40 and HD 75691 and HD 73603 for He 2–10. They were observed right before and after the targets and served as both telluric and flux standard stars. They were used as well for Point Spread Function (PSF) determination. The synthetic calibrated spectra for these standard stars are given by cohen99.
The data processing included the removal of bad frames and the co-addition of all chopping and nodding pairs. This left us with one single image with one positive and two negative long-slit spectra. These were combined with a simple shift-and-add procedure which slightly increased the signal-to-noise. For every individual observation, the spectra of the target and standard star were extracted using the optimal extraction procedure developed by horne86, ideal for unresolved or compact sources. This procedure applies non-uniform pixel weights in the extraction sum in order to reduce the statistical noise in the extracted spectrum to a minimum while preserving its photometric accuracy. The calibration of the spectroscopic data included 1) the removal of the telluric features, which was done by dividing by the spectrum of the standard star; 2) the removal of the spectral features of the standard star; and 3) the absolute flux calibration. These last two steps were achieved by multiplying by the synthetic spectrum of the standard star. We propagate the uncertainty for each pixel, dominated by variations of the sky transparency, along each step of the processing.
Wavelength calibration is straight forward since a table with the pixel-to-wavelength correspondence is provided by the TIMMI2 webpage111www.ls.eso.org/lasilla/sciops/timmi.
We obtained two spectra of NGC 3256, three of II Zw 40, two of He 2–10 A and three of the weaker He 2–10 C. Each spectrum was obtained after a total exposure time (on source) of min. The spectra of each source were combined to obtain one final spectrum.
We compared the full-width-at-half-maximum (FWHM) measured along the spatial direction for each object with the MIR seeing (derived from the spatial FWHM of the calibration star) in order to account for possible slit losses.
The FWHM along the spatial direction measured for the southern nucleus (S) of NGC 3256 is 1002, which is of the order of the MIR seeing (FWHM095–111) and smaller than the slit width (12). Hence, slit losses towards NGC 3256 S are negligible. However, the northern nucleus (NGC 3256 N) is slightly resolved with a FWHM along the spatial direction of 155005. Assuming that the source is Gaussian and that the slit is perfectly centred on the source peak, it implies that the slit might be registering about 68% of the total emission of the N nucleus.
Regarding the three long-slit spectra obtained of II Zw 40, the FWHM’s measured along the spatial direction give values of 167, 103 and 122, somewhat larger than the average MIR seeing at the time of the observation (111, 091 and 096, respectively). II Zw 40 is then marginally resolved but the slit is wide enough (12) to ensure that practically all the MIR flux emitted is registered. This is so since in the last two cases the FWHM is similar to or smaller than the width of the slit and the flux level of all three spectra agrees well within the errors.
For He 2–10 A, the FWHM’s of the two spectra which were obtained are 183 and 137, larger than the respective MIR seeings (077 and 083) and the slit width. Assuming that the source is Gaussian and that the slit is perfectly centred on the source peak, it implies that the slit might be registering about 60–75% of the total flux emitted by component A. In the case of He 2–10 C, the three individual observations obtained give FWHM’s of 122, 113 and 147, being the respective MIR seeings 10, 088 and 119. This source is then only slightly resolved. As for II Zw 40, we are confident that the slit is registering most of the MIR flux emitted by component C in all three cases.
The spectra were extracted through apertures of about centred on the peak positions.
Line fluxes were measured by fitting a Gaussian and their quoted uncertainties (of the order of 5–20%) include the statistical error associated to each point at a given wavelength. Upper limits are defined as the flux of a feature with a peak flux three times the continuum rms noise and a width equal to the instrumental resolution element.
3 Results
Here we present our high spatial resolution spectroscopy data using TIMMI2. First, a general description of every object is provided, followed by a description of the spectra in terms of general shape and line and molecular content. Our data is compared with observations reported in the literature.
A variety of fine-structure lines and broad-band dust features fall within the -band spectroscopic range. The most relevant lines are [Ar iii] at 9.0 m, [S iv] at 10.5 m and [Ne ii] at 12.8 m. These lines require hard radiation with energies between 21 and 35 eV, and the most likely explanation for their excitation mechanism is photoionisation by hot stars. In terms of molecular features, the MIR spectra of many starbursts are dominated by the well known emission features at 8.6, 11.2 and 12.7 m, commonly called the unidentified infrared (UIR) bands and now generally attributed to vibrational emission of Polycyclic Aromatic Hydrocarbons (PAHs) containing carbon atoms (e.g. allamandola89; puget89; peeters04:review). A silicate band centred around 9.7 m can also be present.
3.1 NGC 3256
3.1.1 General description
The galaxy is a peculiar spiral galaxy located at a distance of 37 Mpc (lipari00). The angular scale at this distance is 1″= 179 pc. This galaxy consists of a main body of about 60″, two extended tidal tails that can be traced as far as 8′ and two faint external loops (lipari00). The central (30″) region shows a knotty structure with a very unusual triple asymmetrical spiral arm morphology. The double tidal tails are characteristic of an interaction between two spiral galaxies of comparable mass (e.g. deVaucouleurs61).
High spatial resolution near-IR (e.g. moorwood94; kotilainen96), MIR (boker97) and radio observations (e.g. norris95; neff03) reveal two distinct nuclei aligned in the north-south direction and separated by 5″. The southern nucleus has no optical counterpart due to the high extinction in this region. The presence of these two nuclei, which at radio wavelengths have approximately similar size, brightness and spectral index, suggests that the merger is not yet completed. This is supported by the surface brightness profile over the central 15 kpc (14), which is clearly not that of a galaxy that has already relaxed sufficiently to be classified as elliptical (moorwood94). The radio spectral indices obtained for both nuclei (; norris95) are quite steep and indicate that the radio emission is dominated by synchrotron radiation from cosmic-ray electrons accelerated by supernovae and that the contribution to the radio emission from H ii regions is negligible.
The starburst nature of the northern nucleus of NGC 3256 is indicated by different authors : 1) The 10 m emission extends over a region kpc (22″) across with most of it originating outside the central kpc (56) (graham84). 2) glass85 show that the colours of the galaxy are indicative of a young starburst. 3) NGC 3256 is located in the same region as starburst galaxies in IR diagnostic diagrams which use PAH emission features as a diagnostic tool for the ultimate physical processes powering Galactic nuclei (AGN versus starburst), indicating that at MIR wavelengths starburst activity is the dominant energy source (peeters04). 4) NGC 3256 also presents a prominent 3.3 m PAH feature (moorwood86) with an equivalent width typical of starburst galaxies. 5) rowan-robinson89 modelled the IRAS 12, 25, 60 and 100 m fluxes and obtained that the contribution of a hidden AGN is %. 6) The specific search for the [Si vi] 1.96 m coronal line emission from a possibly obscured AGN proved negative (moorwood94). 7) The central 3″ of the nuclear region show strong recombination lines of hydrogen and helium and a prominent CO band absorption at 2.3 m (doyon94). These features provide further evidence for starburst activity since it implies the existence of a large number of OB stars and a young population of red supergiants. 8) The SWS spectrum of NGC 3256 shows no signatures of high-excitation lines common in galaxies powered by AGNs (rigopoulou96). This is confirmed by the high spatial resolution spectrum of the northern nucleus obtained by siebenmorgen04. The nature of the southern nucleus remains, however, unclear.
High spatial resolution (06) Chandra observations (lira02) find several (14) discrete sources embedded in a complex diffuse emission which contribute % of the total X-ray emission in the 0.5–10 keV energy range. Two of these discrete sources are coincident with the two nuclei, with the northern nucleus corresponding to the brightest X-ray source. These authors find no evidence for the presence of an AGN in the southern nucleus. However, based on the ratio of 6 cm radio emission to 2–10 keV X-ray emission, neff03 suggest the possibility that both nuclei might harbour low-luminosity AGNs generated in or fuelled by the galaxy merger. Nevertheless, based on HST STIS long-slit spectra of the northern nucleus, lipari04 suggest that the shape of the rotation curve and the emission-line profile can be explained by the presence of young star clusters with outflow in the core, and that most probably the associated compact X-ray emission and radio emission are the result of a few recent supernovae remnants.
3.1.2 N-band spectra
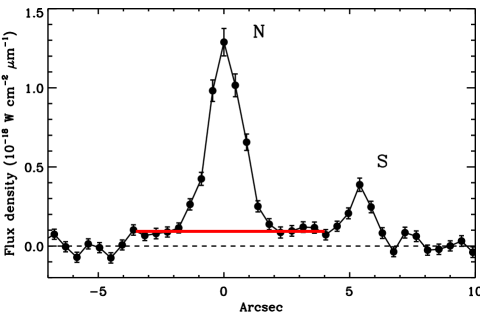
The spectral observations towards the nuclear region of NGC 3256 registered both the northern (N) and southern (S) nuclei previously imaged at MIR wavelengths by boker97. Fig. 1 shows the variation of the [Ne ii] 12.8 m line peak flux across the slit from north to south. The northern nucleus has a peak flux of W cm m. The southern nucleus is much weaker, with a peak flux of W cm m. Faint [Ne ii] emission was also detected extending about 4″ around the peak of NGC 3256 N. This faint emission appears as an emission plateau with an average flux level of ( W cm m. This plateau coincides with a small spiral disc, at face-on position, which is a continuation of one of the spiral arms of the galaxy and reaches the very northern nucleus (lipari00).
The fact that NGC 3256 N is slightly resolved (see Sect. 2) allows for a comparison of the spatial variation of the [Ne ii] line peak and other features such as the 11.2 m PAH peak emission and the continuum at 12 m. No differences are evident, indicating that either the PDR and dust shell form a thin layer around the N nucleus or we are simply not resolving the emission.
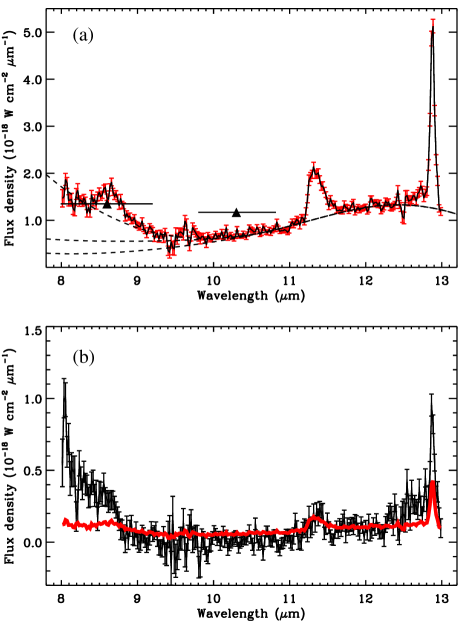
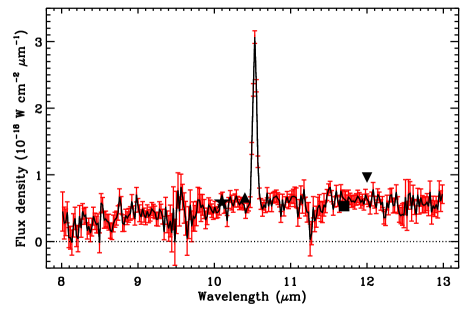
Fig. 2 a shows the spectrum of NGC 3256 N. Only the valid range between 8 and 13 m is plotted. The spectrum is characterised by a continuum due to warm dust, the 8.6, 11.2 and possibly also the 12.7 m PAH emission bands, and the atomic fine-structure line of [Ne ii] at 12.8 m. siebenmorgen04 have previously imaged the N nucleus at 8.6 and 10.4 m and obtained a TIMMI2 spectrum of this nucleus with a 3″ slit. Their narrow-band filter photometry agrees well with the flux level of our spectrum (cf. Fig. 2 a). A comparison between the spectrum obtained by siebenmorgen04 and ours in terms of line and PAH band fluxes is done in Sects 3.1.3 and 3.1.4.
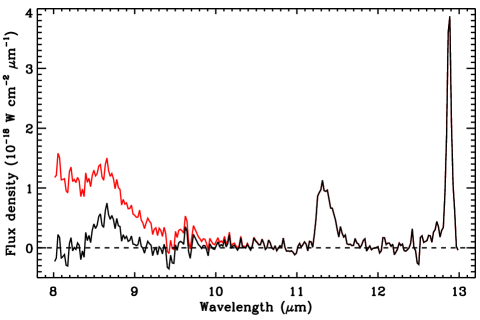
Emission towards the southern nucleus was only detected shortwards of m and beyond 11 m. The spectrum of NGC 3256 S is shown in Fig. 2b. Like NGC3256 N, the spectrum shows the 11.2 m PAH emission band, possibly also the 8.6 and 12.7 PAH bands, and the atomic fine-structure line of [Ne ii] at 12.8 m. A comparison with the spectrum of the N nucleus is also shown. Both spectra are similar, although with noticeable differences in the emission shortwards of m and beyond 12 m.
graham84 measured a 10 m flux of W cm m in a 15″ aperture, about 8 times larger than the flux we obtain at this wavelength towards the N nucleus, indicating that diffuse MIR emission exists around the two nuclei (cf. Sect. 3.1.1).
3.1.3 Line fluxes
Line fluxes towards NGC 3256 N and S are listed in Table 1. Only the line of [Ne ii] at 12.8 m was detected. Upper limits to the fluxes of the [Ar iii] 9.0 and [S iv] 10.5 m lines are also given. Considering the slit losses that might be affecting the [Ne ii] line flux emitted by NGC 3256 N (about 32%, see Sect. 3.1.2), the total [Ne ii] line flux would be W cm.
Table 1 compares the fluxes observed towards the N and S nuclei with those observed by the large ISO/SWS beam and other apertures/slits. The ISO/SWS aperture is approximately 14″20″ up to 12 m and 14″27″ between 12 and 19.6 m. The [Ar iii] line flux measured by ISO is approximately 4 times larger than our upper limit, while the ISO [S iv] flux is too small to be detected by TIMMI2. Finally, the ISO [Ne ii] line flux is about 3 times larger than the combined flux emitted by the N and S nuclei. This indicates that other objects besides the two nuclei must contribute strongly to the [Ar iii] and [Ne ii] line fluxes measured by ISO.
siebenmorgen04 only present the spectrum of the northern nucleus and do not comment on the detection of the southern one, probably due to the use of a wider slit (3″). Their published spectrum most likely includes the contributions of both nuclei. They estimate a [Ne ii] line flux of W cm, in good agreement with the value we obtain when the fluxes of both nuclei are added together and slit losses are considered. Integrated over an aperture of 42, roche91 measured a [Ne ii] line flux of W cm, only slightly higher than the TIMMI2 line flux.
3.1.4 PAH bands
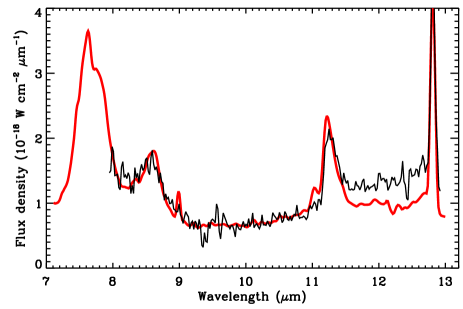
Both nuclei exhibit PAH emission features (see Fig. 2). The northern nucleus clearly shows the 8.6 and 11.2 m PAH bands, possibly the 12.7 m PAH band, the red wing of the 7.7 m PAH complex and that of the broad emission plateau underlying both the 7.7 m complex and the 8.6 m band, clearly seen shortwards of 9 m (see Fig. 4 for a comparison with the ISO/SWS spectrum of the Galactic H ii region IRAS 231336050 and e.g. the review by peeters04:review). The southern nucleus shows the 11.2 m band and possibly also the 8.6 and 12.7 m PAH bands.
| Line | North | South | Aperture | Ref. | |
|---|---|---|---|---|---|
| (m) | ( W cm) | (″) | |||
| [Ar iii] | 9.0 | 1.2 | 1 | ||
| [S iv] | 10.5 | 1.2 | 1 | ||
| [Ne ii] | 12.8 | 1.2 | 1 | ||
| [S iv] | 10.5 | 3 | 2 | ||
| [Ne ii] | 12.8 | 3 | 2 | ||
| [Ne ii] | 12.8 | 4.2 | 3 | ||
| [Ar iii] | 9.0 | 4 | |||
| [S iv] | 10.5 | 4 | |||
| [Ne ii] | 12.8 | 4 | |||
When correcting for slit losses, we obtain a total line flux of about
W cm (cf. Sect. 3.1.2).
This observation is probably centred on the N nucleus.
The ISO/SWS aperture includes both N and S nuclei and any other possible mid-IR emitters. Errors are calculated from the
typical ISO/SWS absolute flux accuracy (peeters:catalogue).
REFERENCES:
(1) This work;
(2) siebenmorgen04;
(3) roche91;
(4) verma03.
| PAH band | North | South | Aperture | Ref. |
| ( W cm) | (″) | |||
| 8.6 | – | 1.2 | 1 | |
| 11.2 | 1.2 | 1 | ||
| 12.7 | 1.2 | 1 | ||
| 11.2 | 30 | – | 3 | 2 |
| 11.2 | 32 | – | 4.2 | 3 |
| 11.2 | 107 | 24 | 2 | |
Although it is not indicated by the authors, we assume that these observations are centred on the N nucleus.
The ISOPHOT aperture includes both N and S nuclei and any other possible mid-IR emitters.
REFERENCES:
(1) This work;
(2) siebenmorgen04;
(3) roche91.
The PAH fluxes are determined by subtracting a local spline continuum (e.g. Fig. 2) and are given in Table 2. The presence of the 12.7 m band is highly dependent on the choice of the continuum which, in turn, is influenced by the flux level at the longest wavelengths (around 13 m). Therefore, its detection is merely tentative and thus we simply give an upper limit.
The 11.2 PAH flux we obtain towards the N nucleus agrees well with those obtained through slightly larger apertures (3″– 4″, see Table 2). However, when compared with the 11.2 PAH flux measured by the large ISOPHOT aperture, the combined flux of both the N and S nuclei accounts only for 30% of the total. This is roughly the same contribution of the [Ne ii] flux emitted by both nuclei to the total ISO/SWS [Ne ii] flux. This suggests that this non-nuclear emission comes from H ii regions and their associated PDRs.
The comparison of the PAH emission bands in both nuclei (see Fig. 2) reveals large differences in both the relative strength of the 11.2/12.7 PAH band ratio (assuming for the moment a positive detection of the 12.7 m band in both nuclei) and the plateau/11.2 ratio. In both cases, the southern nucleus has a stronger 12.7 PAH band and a stronger plateau both relative to the 11.2 m PAH band compared to that of the northern nucleus. Possible origins for this are the following. (i) A different PAH charge balance in both nuclei. Indeed, a larger fraction of ionic PAHs give rise to stronger emission in the 5-10 m region (e.g. Peeters02) and hence might explain the difference in plateau/11.2 ratio. For the 12.7 m PAH, it is unclear at this moment whether it is due to neutral or cationic PAHs (hony01). (ii) The 12.7/11.2 ratio is a tracer of the PAH molecular edge structure (hony01). In this case, the S nucleus should have more irregular PAHs (hony01) likely due to a stronger radiation field and lower density. Molecular edge structure has little influence on the CC stretching and CH in-plane-bending modes emitting in the 6-9 m region. (iii) The underlying plateau is believed to arise from larger PAH-related molecules or complexes (allamandola89) indicating that both nuclei might have a different PAH size distribution. As with the other two possibilities, it cannot explain at once the relative intensities of all PAH ratios.
3.1.5 Extinction
The extinction suffered by the line emission from NGC 3256 N has been estimated by doyon94 using two different methods: 1) the ratio of Pa to Br, which gives an absolute extinction at 2.2 m of mag; and 2) the ratio of [Fe ii] 1.257 to [Fe ii] 1.644 m, which implies mag. kotilainen96 proposed a third method, which assumes the correlation between 6 cm radio and [Fe ii] luminosities established by forbes93. They obtain an extinction of for the N nucleus and of for the S nucleus. For the N nucleus, the average of the three methods gives . These values of the extinction in the near-IR, i.e. (N) and (S), translates into and 10.2 mag for the N and S nuclei, respectively, assuming (mathis90). Based on the colours, lipari00 find (N) and (S) mag.
The extrapolation of these values of the extinction in the optical and near-IR to the MIR regime is not direct unless the exact shape and depth of the silicate absorption feature at 9.7 m is known. This could be done by fitting the dust continuum (cf. martin:ngc5253). However, the presence of the strong PAH bands hampers this task considerably. By simply assuming that the extinction law in the MIR can be described by the commonly used “astronomical silicate” (cf. draine84; draine85), we obtain that (martin:atca:gal), where is the extinction at the [Ne ii] line central wavelength and is the extinction at the peak of the silicate absorption. Assuming a ratio , found by roche84 for the local diffuse interstellar medium, we obtain (N) and (S) mag when the values above mentioned for the V-extinction towards the N and S nuclei (5.6 and 10.2) are used. Hence, we obtain (N) and (S) mag. These values are to be considered as only rough estimates of the extinction affecting the [Ne ii] line. When applying these extinction values to the [Ne ii] line fluxes measured for both nuclei, we obtain and W cm, respectively. These fluxes are still within the 2 error bars of the observed fluxes. Even in the case of a larger extinction towards the S nucleus (16 mag, see above), the [Ne ii] extinction corrected flux will be , only 30% larger than the observed flux.
3.1.6 Ionic abundances
Ionic abundances can be determined from the measured strengths of the fine-structure and H i recombination lines. The ionic abundance of a certain ion with respect to hydrogen () can be determined using the following expression (e.g. rubin88):
| (1) |
where and are the extinction-corrected fluxes of any line produced by and H i, and and are their respective emission coefficients. This expression assumes that 1) the nebula is homogeneous with constant electron temperature and density; 2) all the line photons emitted in the nebula escape without absorption and therefore without causing further upward transitions; and 3) the volume occupied by and H is the same. The fine-structure line emission coefficients depend on the electron temperature (), density () and relevant atomic parameters (cf. martin:paperii). The H i emission coefficients can be derived by using the program intrat by storey95.
In the case of NGC 3256, we can determine the abundance of Ne with respect to H. Adopting K (aguero91; storchi95; lipari00) and cm (lipari00) for both the N and S nuclei, we obtain and erg cm s. kotilainen96 measured the Br flux within 3″ apertures centred on both nuclei. They obtain de-reddened fluxes of and W cm respectively for the N and S nuclei. We note that the Br line fluxes measured by doyon94, integrated over a square aperture of 3535, are roughly twice those obtained by kotilainen96. However, we consider here the fluxes by kotilainen96 since their Br flux towards the N nucleus predicts well the extinction corrected H flux measured by lipari00. We will consider a standard 20% uncertainty for these line fluxes.
Using the [Ne ii] line fluxes listed in Table 1, we obtain Ne/H(N) and Ne/H(S), where the values in brackets are obtained by using the extinction-corrected [Ne ii] line fluxes given in Sect. 3.1.5. The use of the Br flux measured by doyon94 will give Ne abundances twice as large. There also exists the fact that the [Ne ii] and Br lines are not measured on the same aperture. In principle, one could be over/underestimating the Br flux associated to the MIR sources. This uncertainty is, however, difficult to quantify.
Formally, the above computed Ne abundances are lower limits to the Ne abundance: Ne/H(N)[Ne/H] and Ne/H(S)[Ne/H]. These limits agree with previous optical determinations (lipari00; aguero91; moran99) which, using different calibrations, find oxygen abundances of 1.3 solar or even 2.6–3 times solar (assuming (O/H), allende01). However, several uncertainties affect the oxygen abundances derived from emission lines using the ”strong line method” especially at high metallicity (e.g. pilyugin01; stasinska05). Furthermore, if the latest upward revision of the solar Ne abundance by 0.4–0.5 dex suggested from helioseismology (antia05; bahcall05) and from solar type stars (drake05) is confirmed, our Ne abundance estimate could well be compatible with solar or even slightly sub-solar.
3.2 II Zw 40
3.2.1 General description
II Zw 40 is at a distance of 9.2 Mpc (vacca92). This distance accounts for Galactic rotation but no Virgocentric flow, and assumes km s Mpc. At this distance, 1″ corresponds to 44.6 pc.
This compact galaxy consists of a bright core only 3″5″ in size with two faint and diffuse tails extending about 30″ to the south-east (sargent70). baldwin82 carried out an emission-line optical study of the morphology and kinematics of II Zw 40. They considered that the two tails are reminiscent of interacting galaxies and suggested a possible collision between two small systems as the source of the present starburst.
II Zw 40 is one of the prototype of the class of dwarf galaxies known as “detached extra-galactic H ii regions” (sargent70). These systems are characterised by emission-line spectra (e.g. walsh93) similar to those of individual giant H ii regions superimposed on a continuum which appears to be mainly due to O stars. The presence of about 200 WR stars is inferred from the flux of the He ii 4684 Å line (cf. vacca92).
| Line | Line Flux | Aperture | Ref. | |
|---|---|---|---|---|
| (m) | ( W cm) | (″) | ||
| [Ar iii] | 9.0 | 1.2 | 1 | |
| [S iv] | 10.5 | 1.2 | 1 | |
| [Ne ii] | 12.8 | 1.2 | 1 | |
| [Ar iii] | 9.0 | 2 | ||
| [S iv] | 10.5 | 2 | ||
| [Ne ii] | 12.8 | 2 |
REFERECES: (1) This work; (2) verma03.
The radio continuum emission of II Zw 40 is relatively compact and coincides with the optical bright core (e.g. wynn86; sramek86; klein91; deeg93; beck02). The spectral index of the overall radio emission has been discussed at length. It seems that the total cm-wave emission of II Zw 40 is mostly thermal, with at most 30% of the total radio emission attributed to non-thermal processes (e.g. sramek86; joy88). Within the central 6″, the observed spectral index equals or exceeds the value for optically thin free-free emission (, with ), indicating no evidence for non-thermal emission from supernovae events and remnants. Further evidence of this lack of supernovae comes from the faintness of the [Fe ii] line emission at 1.644 m (e.g. vanzi96), which is more likely to be produced in shocks than in photoionised gas. High-spatial resolution ( 01) imaging at 2 cm reveals a complex of smaller nebulae within the bright radio core (beck02).
II Zw 40 was first detected at 10 m by rieke72. Later observations by wynn86 reveal that most of the 10 m emission arises from a region less than 4″ in diameter, more compact than the near-IR and optical emission. Recently, Keck MIR imaging has shown a bright source with a diameter (FWHM) of about 05 coincident with the radio compact emission (beck02).
3.2.2 N-band spectrum
Fig. 5 shows the spectrum of the infrared nebula in II Zw 40. Only the valid range between 8 and 13 m is plotted. The spectrum of II Zw 40 is characterised by a rather flat continuum and a strong [S iv] line at 10.4 m.
II Zw 40 has been previously observed at MIR wavelengths using a wide range of apertures: at 10.1 m in a 77 aperture (wynn86); at 10.4 m in a 6″ aperture; at 11.7 m, with a spatial resolution of 03–05; and at 12 m with IRAS (vader93). These various photometric fluxes are indicated in Fig. 5 and show a perfect agreement with the spectrum we have obtained, even in the case of the IRAS 12 m flux measured with a beam that includes the entirely galaxy. This suggests that the MIR flux of the galaxy is confined to the compact (05) infrared source we have observed with TIMMI2.
3.2.3 Line fluxes
Towards II Zw 40, only the [S iv] line is detected. Its line flux and the upper limits of the non-detected lines are measured as described above (cf. Sect. 3.1.3) and listed in Table 3
Table 3 compares the fluxes observed by TIMMI2 towards the infrared nebula in II Zw 40 with those observed by the large ISO/SWS aperture. The upper limits to the [Ar iii] and [Ne ii] line fluxes are consistent with the ISO values. Regarding [S iv], the ISO flux is only 1.3 times larger than the TIMMI2 value. Hence, it seems valid to consider (as it has been stated in the previous section) that practically all of the mid-infrared line emission emitted by the galaxy comes from this compact nebula.
3.2.4 Extinction
The analysis of the extinction towards II Zw 40 is complicated by the low galactic latitude of the galaxy, which implies some foreground extinction. Values of the extinction based on a foreground screen model and derived from the H/H, H/Br or H/Br line ratios are in the range mag (e.g. sargent70; wynn86; vanzi96; joy88; davies98). walsh93 present a map of the total (Galactic + extra-galactic) derived from the H/H ratio. The map contains values of as large as 4.5 mag, found preferentially in the northern half of the bright optical core of II Zw 40 with a general decrease to the south-east. However, non optical studies obtain much larger visual extinctions. Near-IR observations of II Zw 40 give Br fluxes of W cm measured in apertures between 3″and 9″(joy88; ho90; vanzi96; davies98; coziol01). Using this range in the observed Br flux, beck02 estimated an extinction of based on their 2 cm free-free flux from a region ″. A similar value for the visual extinction ( mag) is found by verma03 based on ISO H i recombination lines. Other authors also argue (though from modelling of the SED) for a very high extinction () for this object (hunt05). Such a high extinction should lead to a significant silicate absorption band, which is not seen in the TIMMI2 spectrum (Fig. 5). Hence, unless the dust is very deficient in silicate, we do not favor such a high . jaffe78 propose a mixture of foreground and internal extinction and reproduce the Balmer decrement with foreground and internal extinctions of 0.8 and 8 mag respectively.
The extrapolation of the extinction in the optical and near-IR to the MIR regime is not direct. We can, however, estimate upper limits to the extinction that affects the MIR lines observed in II Zw 40 by adopting mag (, rieke85 rieke85) and the method described in Sect. 3.1.5, i.e. using an extinction law defined by the ”astronomical silicate” with . We obtain , , , , and mag, where these are, respectively, the extinction at the central wavelengths of the [Ar iii] 9.0, [S iv] 10.5, [Ne ii] 12.8, [Ne iii] 15.5, [S iii] 18.7 and [O iv] 25.9 m lines (cf. martin:atca:gal). The extinction affecting the [Ar ii] 7.0 m is obtained by simply extrapolating the value in the -band considering a power law . We obtain mag.
These values of the extinction have to be considered as simply rough estimates and will be later considered in Sect. LABEL:sect:cloudy, where the stellar content of II Zw 40 will be discussed. Moreover, we might be overestimating the extinction for the lines around 10 and 18 m since, as we mention above, the TIMMI2 spectrum does not show evidence for silicate absorption.
3.2.5 Ionic abundances
Following Sect. 3.1.6, we can determine the ionic abundance of S with respect to H. beck02 predict an unextincted Br flux of W cm based on radio continuum observations (see previous section). We will use this value hereafter and consider a standard 20% uncertainty.
Adopting K (vacca92; walsh93; perez03) and cm (see Table LABEL:table:prop), we obtain and erg cm s. The resulting S/H is , where the value in brackets corresponds to the abundance obtained by using the extinction corrected [S iv] line flux (cf. Sect. 3.2.4).
Measurements of the oxygen abundance towards II Zw 40 (e.g vacca92; pagel92b; walsh93; masegosa94; guseva00; perez03) give an average value O/HO/H. The value we obtain for S/H is only about 20% of the sulphur abundance expected for a nebula with a metallicity 1/3 of the solar metallicity. Most of the sulphur must be either in the form of S or S.
Since it has been proven that practically all of the infrared emission of II Zw 40 comes from this compact core (e.g. beck02), we can estimate the amount of sulphur locked in the form of S by using the [S iii] 18.7 m line flux measured by ISO ( W cm; cf. verma03). Adopting the above values for the electron temperature and density, we obtain erg cm s. The resulting S/H is , where, again, the value in brackets is obtained by adopting the extinction estimated in the previous section. Hence, S and S account for less than 40% of the expected sulphur abundance. The rest must be in the form of S, which needs energies around 47 eV in order to be produced. Unfortunately, lines of S are not present in the infrared to prove this result but the line of [O iv] at 25.9 m has been observed by ISO (and the ionisation edge for the creation of this ion is 54.9 eV, even higher).
Larger values of the density will give larger S/H and S/H abundances because collisional de-excitation begins to play an important role. However, densities much larger than cm (we note that the critical densities of the [S iii] 18.7 and [S iv] 10.5 m lines are, respectively, and cm; see martin:paperii martin:paperii) are necessary in order to produce an important increase in these abundances. Such high densities are not probable in H ii regions, even in ultracompact ones (e.g. wood89; kurtz94).
3.3 Henize 2-10
3.3.1 General description
The radial velocity of He 2–10 ( km s) yields a distance anywhere from 6 to 14 Mpc depending on the chosen value of and assumptions on the Virgocentric flow. As done by other authors (e.g. vacca92), we adopt a reasonable compromise of 9 Mpc, which accounts for Galactic rotation but no Virgocentric flow, and assumes km s Mpc. At this distance, 1″ corresponds to 43.6 pc.
He 2–10 was the first emission-line galaxy to exhibit evidence for WR stars (allen76) and it is considered the prototype for WR galaxies (conti91). High-resolution observations in the optical and near-IR (see cabanac05) show a bright central nucleus, generally refered to as region A, resolved into several UV-bright super star clusters which lie in an arc of about 2″ (conti94). This central nucleus is surrounded by two presumably older star-forming regions, named B and C. Region B, to the east, shows a mixed population of blue and red clusters (only detected at wavelenghts longer than 2.2 m). Region C, on the northwest side, has a long tail containing bright red clusters as well.
VLA radio continuum imaging (kobulnicky99; johnson03) reveals 5 compact mJy radio sources in the central region aligned in a east-west orientation. These radio sources are labeled 1 to 5 from west to east. While the global radio spectral index is highly nonthermal (, with ) and consistent with synchrotron radiation produced in supernova explosions, these compact radio sources have positive () spectral indices suggesting an optically thick thermal bremsstrahlung origin, consistent with unusually dense H ii regions.
The presence and importance of dust in the central region was confirmed by high spatial resolution mid-infrared (MIR) images (sauvage97; beck01; vacca02). The spatial distribution of the IR emission (which extends less than 5″) agrees strikingly with that of the radio continuum. In fact, the subarsecond resolution observations by vacca02 using the Gemini North Telescope were able to detect 4 of the 5 radio knots observed by kobulnicky99. These MIR nebulae provide at least 80% of the total flux seen by IRAS at 12 m with a beam that included the entirely galaxy (beck01).
Recent high resolution observations in (2.2 m), (3.8 m) and (4.8 m) bands by cabanac05 have provided a detailed explanation of the multiwavelength appearance of He 2–10 from the optical to the radio. Contrary to what it was thought previously, these authors show that practically all the radio knots can be associated with - and -emitting regions which implies a revision of their physical nature. These authors tentatively review the classification of the radio knots and only classify knots 1+2 and 5 as bona fide ultradense H ii regions. They have counterparts in the NIR but not in the visible which implies a significant optical depth (typically ) and thus a young age although possibly not as young as previoulsy postulated. Regarding knots 3 and 4, they propose that they are supernova remnants mixed with normal H ii regions.
3.3.2 N-band spectrum
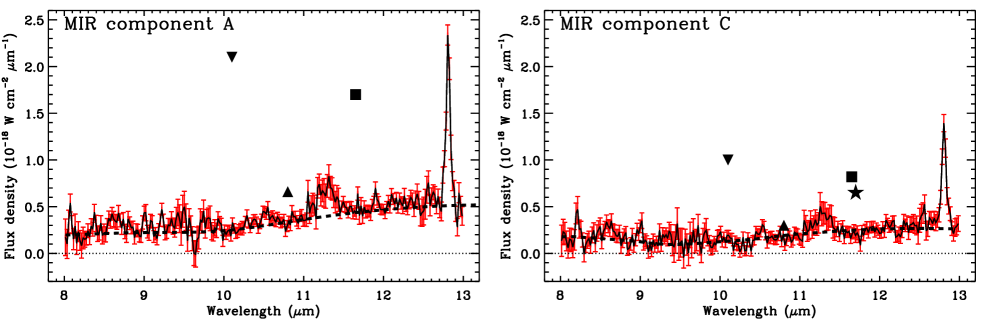
Our MIR observations were centred on the positions of the MIR counterparts to the radio knots 4 and 1+2, named A and C respectively following the nomenclature by beck01 (see Sect. 3.3.1). These MIR regions A and C should not be mistaken with the equally named optical components (see previous section). Fig. 6 shows the spectra of He 2–10 A and C. They show PAH emission bands at 8.6 and 11.2 m and the line of [Ne ii] at 12.8 m, while the presence of silicate in absorption is not clear. The presence of this feature in absorption is however more evident in the MIR spectrum of phillips84 obtained within a beam of 59.
High spatial observations of He 2–10 have been done at 10.1 and 11.65 m by sauvage97, at 11.7 m by beck01 and at 10.8 m by vacca02. The photometric fluxes these authors have obtained are indicated in Fig. 6. While there is a huge discrepancy between our spectra and the fluxes obtained by sauvage97 and beck01, they agree rather well with those of vacca02. Possible discrepancies between these photometric measurements are largely discussed by vacca02. They could be due to differences in the -band filter transmission profiles and central wavelengths, the use of a wrong colour term in the photometric calibration, non-photometric conditions during the observations or to a wrong background correction beneath the knots.
In the case of He 2–10 A, we have compared the spatial distribution of the [Ne ii] and 11.2 m peaks with that of the continuum at 12 m. No differences are evident, consistent with the fact that the emission is only slightly resolved.
3.3.3 Line fluxes
We detect the [Ne ii] line towards He 2–10 A and C. [Ne ii] line fluxes and upper limits of the non-detected lines are measured as described in Sect. 3.1.3 and listed in Table 4.
| Line | He 2–10 A | He 2–10 C | Aperture | Ref. | |
|---|---|---|---|---|---|
| (m) | (10 W cm) | (″) | |||
| [Ar iii] | 9.0 | 1.2 | 1 | ||
| [S iv] | 10.5 | 1.2 | 1 | ||
| [Ne ii] | 12.8 | 1.2 | 1 | ||
| [Ne ii] | 12.8 | 5.9 | 2 | ||
| [Ne ii] | 12.8 | 20 | 5.9 | 3 | |
| [Ar iii] | 9.0 | – | 2.0 EW | 4 | |
| [S iv] | 10.5 | – | 1.6 EW | 4 | |
| [Ne ii] | 12.8 | – | 2.0 NS | 4 | |
| [Ne ii] | 12.8 | – | 1.6 EW | 4 | |
When correcting for slit losses, we obtain a total line flux of about W cm (cf. Sect. 3.3.3).
REFERENCES:
(1) This work;
(2) phillips84;
(3) roche91;
(4) beck97.
| Component | 8.6 m | 11.2 m | Aperture (″) | Ref. |
|---|---|---|---|---|
| A | 1.2 | 1 | ||
| C | 1.2 | 1 | ||
| ? | – | 5.9 | 2 |
Given as an upper limit due to the large error bars
(see Fig. 6).
The central position of this observation is uncertain. It is likely centred on
component A.
REFERENCES:
(1) This work;
(2) phillips84.