]Received February 28 2006
Black hole mass and accretion rate of Active Galactic Nuclei
Abstract
The determination of the central black hole mass is crucial to the understanding of AGN physics. In this paper we briefly review some methods that are currently used to estimate the black hole mass of AGNs. Particularly we demonstrate the importance of two correlations: one between the black hole mass and the stellar velocity dispersion and another one between the broad line region size and the optical continuum luminosity. Besides applying these relations in deriving black hole masses of various types of AGNs, we also employed the fundamental plane of elliptical galaxies to estimate the central velocity dispersions of AGN host galaxies, and then the black hole masses of AGNs including BL Lac objects. In addition, we derived another empirical relation between the BLR size and Hβ emission line luminosity from AGNs with the BLR size measured by reverberation mapping studies, and argued that more accurate black hole masses of extremely radio-loud AGNs could be obtained with it than using the usual relation because of the jet contribution to the optical continuum. Finally we pointed out that black hole mass estimation is very much helpful to determine the accretion rate and understand the accretion process in AGNs.
pacs:
04.70.-s; 97.60.Lf; 98.54.Aj; 98.54.CmI INTRODUCTION
As we know, mass is the most important physics parameter of a black hole. Many other properties of the black hole are directly related to its mass. Currently astrophysical black holes can be divided into three categories: the primordial black holes with the mass of about existed only in the early universe, the stellar-mass black holes with the mass of about 10 solar masses () existed in some X-ray binaries and the supermassive black holes with the mass of to existed in the center of normal and active galaxies. In addition, recently there were also some indications of the possible existence of the intermediate-mass black holes (with the mass of to ) in some ultra-luminous X-ray sources, but this is still under debate. Black holes were also suggested to exist in gamma-ray bursts and a magnetized accretion disk around the black hole may contribute significantly to the energy output of them (Lee & Kim 2002; Kim & Lee 2003). In this paper we mainly focus on the supermassive black holes in Active Galactic Nuclei (AGNs), which consist of many powerful extragalactic sources including quasars, radio galaxies, Seyfert galaxies, BL Lacertae objects, LINERs, etc. Supermassive black holes (hereafter SMBHs) have been suggested to exist in the center of AGNs in order to account for the huge power of these energetic extragalactic objects (Lynden-Bell 1969; Rees 1984).
In the last two decades, SMBHs have been found in the center of about 40 nearby galaxies (including our Milky Way) as well, especially with the Hubble Space Telescope and other giant ground-based telescopes (See Kormendy & Gebhardt 2001 for a recent review). These discoveries were made by three dynamical methods, involving the studies on the dynamics of stars, gas and extragalactic water masers respectively. However, these direct methods for black hole mass measurements can not be applied to most of AGNs because (1) AGNs are so bright to outshine the stars, and (2) only in several nearby AGNs we can observed the circular motions of their central gas and water masers. Previously, some indirect methods, such as fitting the observed UV/topical ’Big Blue Bump’ and the X-ray ion line in the spectra of AGNs using the accretion disk models, have been adopted to estimate the central black hole mass of AGNs. But these estimates are highly uncertain because they depends on our knowledge of the disk inclination, accretion rate and radiation emissivity law, and all of them are poorly known. Probably the most reliable current method for AGN black hole mass estimation is the reverberation mapping. Using this technique, the size of the broad line region (BLR) can be measured using the time lag between the variabilities of continuum and emission line fluxes. The black hole mass can be then estimated from the BLR size and the characteristic velocity (determined by the full width at half-maximum (FWHM) of the emission line) using the virial dynamics. So far, reverberation mapping studies have yielded black hole masses of about 20 Seyfert 1 galaxies and 17 nearby bright quasars (Wandel et al. 1999; Ho 1999; Kaspi et al. 2000; Peterson et al. 2004). However, even for the reverberation mapping study, there are also some uncertainties of the results mainly due to the unknown BLR dynamics and geometry (Krolik 2001; Wu & Han 2001a).
With the estimated black hole masses, a tight correlation between black hole mass and bulge velocity dispersion () has been found for nearby galaxies (Tremaine et al. 2002) and for a few Seyfert galaxies as well (Ferrarese et al. 2001). This implies that the MBH- relation is probably universal for both active and inactive galaxies. Such a tight relation suggests an interesting possibility to estimate the central black hole masses for galaxies using the measured values of bulge velocity dispersions. This straightforward method is particularly important for AGNs. Especially BL Lacertae objects, the reverberation mapping technique cannot be applied because they have no or only very weak emission lines in their optical spectra. Using the MBH- relation may be the only possible way to derive the black hole masses for them.
An empirical relation between the BLR size () and the optical continuum luminosity at 5100 () has been derived by Kaspi et al. (2000) using the observed data of 34 nearby AGNs in the reverberation mapping studies. This relation has been frequently adopted to estimate the BLR size and then derive the black hole masses for large samples of AGNs, including radio-loud quasars (Gu, Cao & Jiang 2001; Oshlack, Webster & Whiting 2001). However, the optical luminosity of some radio-loud AGNs may not be a good indicator of ionizing luminosity, which is usually related to the UV/optical radiation from the accretion disk around the central black hole. The powerful jets of blazar-type AGNs may significantly contribute to the optical luminosity. This has been confirmed by the discovery of optical jets in AGNs by HST (Scarpa et al. 1999), and the detected optical synchrotron radiation in many other radio-loud AGNs (Whiting, Webster & Francis 2001). Therefore, using the empirical relation, which was obtained based on the sample of mostly radio-quiet AGNs, one would significantly overestimate the actual BLR size and hence the black hole mass of radio-loud AGNs. Oshlack et al. (2002) have shown that their estimated black hole masses would be lower if the synchrotron contribution to the optical flux is subtracted.
In this paper, we will present some results in using the empirical relations ( MBH- relation and relation) to estimate the SMBH masses of different types of AGNs. We will also report some other progress, including using the fundamental plane relation of the elliptical host galaxies and a new empirical relation to estimate the black hole masses of radio-loud AGNs. In addition, based on the obtained black hole mass we will study the accretion rate of some AGNs and discuss the accretion physics around black holes.
II Applications of the - relation
II.1 Black hole masses of Seyfert galaxies and their relation with bulge masses
Nelson & Whittle (1995) have compiled the measurements of nuclear velocity dispersions of about 70 Seyfert galaxies. After excluding some LINERs and normal galaxies, we got a sample of 33 Seyfert 1s and 32 Seyfert 2s (Wu & Han 2001b). We estimated the SMBH masses of these Seyfert galaxies directly using the - relation given by Gebhardt et al. (2000). The V-band bulge absolute magnitude was estimated from the B-band bulge absolute magnitude in Nelson & Whittle (1995) by assuming the B-V color of the bulge being the same as the total B-V color of Seyfert galaxy.
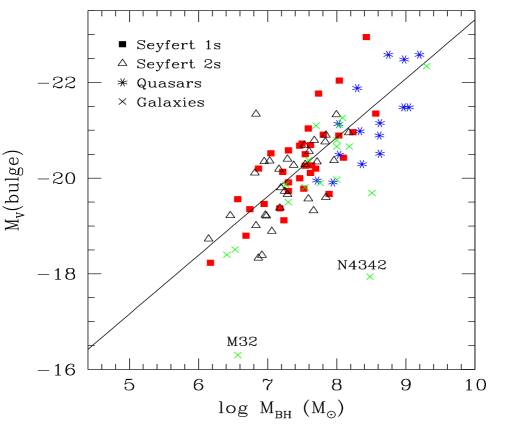
The relation between V-band bulge luminosities and SMBH masses for 33 Seyfert 1s and 32 Seyfert 2s is shown in Figure 1. The black hole masses of Seyfert galaxies are mostly in the range of to . In Figure 1 we can clearly observe a significant universal relation between the V-band bulge luminosities and SMBH masses for both Seyfert galaxies and quasars, as well as for nearby galaxies. For comparison, the SMBH masses of 15 quasars and the absolute V magnitudes of their inner host were taken from Laor (2001). The SMBH masses determined by stellar dynamics for 16 nearby galaxies were taken from G00 and their absolute bulge V magnitudes were taken from Laor (2001). Adopting the ‘typical’ uncertainties of and , the least-squares fit for all objects gives,
| (1) |
The Spearman rank-order correlation coefficient is , which has a probability of to occur by chance. Adopting the standard relation and the relation between the bulge mass and luminosity (Magorrian et al. 1998), from eq. (2) we get, . Laor (2001) found for a sample of objects including 9 Seyfert galaxies and 15 quasars. Our result shows that this nonlinear relation is more evident from a larger sample including more Seyfert galaxies. Using another well-selected sample including 22 Seyfert 1s and 15 Seyfert 2s (Wu & Han 2001b), we also found . Therefore, the nonlinear - relation is confirmed by our studies.
II.2 Fundamental plane relation and black hole masses of BL Lac objects, radio galaxies and quasars
AGNs usually have very bright nuclear emission, which makes it difficult to measure their stellar velocity dispersions with the spectroscopic method. It is well known for ellipticals that three observables, namely the effective radius, the corresponding average surface brightness and the central velocity dispersion, follow a surprisingly tight relation (so-called the fundamental plane). Some studies have shown that the elliptical hosts of radio galaxies follow the same fundamental plane as normal ellipticals (Bettoni et al. 2001). For about 300 normal ellipticals and radio galaxies, Bettoni et al. (2001) found that the fundamental plane can be robustly described as
| (2) |
where is the effective radius in , is the central velocity dispersion in , and is the average surface brightness in R-band. Because the fundamental plane probably exists also for the elliptical hosts of AGNs, this provides a possible way to estimate the central velocity dispersions and then the SMBH masses of AGNs.

The BL Lac snapshot survey using the HST has obtained images for 110 BL Lac objects (Scarpa et al. 1999). Urry et al. (2000) has obtained host galaxy parameters for 72 of these BL lacs. Among them, 63 objects have measured redshifts. 51 of them are classified as high-frequency peaked BL Lacs (HBL) and 12 of them as low-frequency peaked BL Lacs (LBL). Figure 2 shows the histograms of our derived black hole masses based on the fundamental plane and the MBH- relation for HBLs and LBLs (Wu, Liu & Zhang 2002). It is clear that there is no significant difference in the black hole masses between HBLs and LBLs. Most BL Lacs have black hole masses in the range of to .

A deep HST imaging study of the host galaxies of a sample of 10 radio galaxies (RGs), 10 radio-loud quasars (RLQs) and 13 radio-quiet quasars (RQQs) has been performed (McLure et al. 1999). The hosts of both radio-loud AGNs and bright radio-quiet AGNs were found to be virtually all massive ellipticals. Therefore, we can also derive the central velocity dispersions and black hole masses for these AGNs based on the morphology parameters of their host galaxies (Wu et al. 2002). Figure 3 shows the histograms of the derived black hole masses for these AGNs. It is clear that there are no significant differences in the SMBH masses among RGs, RLQs and RQQs. Most of these AGNs have black hole masses in the range of to . Our results indicate that there is no difference in SMBH masses of BL Lacs, RGs and RLQs. Different from some previous claims that RLQs have more massive SMBHs than RQQs (Laor 2000), our result shows that there is only a weak difference in our derived SMBH masses for RQQs and RLQs in this sample if their host galaxies are ellipticals.
Using the same method, we also estimate the primary black hole mass of another well-known BL Lac object OJ 287 (Liu & Wu 2002). Our result gives the mass about , which is consistent with the upper limit () obtained by Valtaoja et al. (2000) based on a new binary black hole model for OJ 287.
III Application of the relation
Reverberation mapping studies of 34 AGNs revealed a significant correlation between the broad line region (BLR) size and the optical continuum luminosity (Kaspi et al. 2000), namely,
| (3) |
This empirical relation provides a possible way to estimate the black hole mass of an AGN from a single optical spectrum, from which the continuum luminosity can be easily measured. On the other hand, the width (FWHM) of Balmer lines, which can be used to estimate the velocity dispersion of the BLR. Therefore, The virial mass of the central black hole can be estimated with
| (4) |
where is the FWHM value of Balmer emission lines.
Here we show some of our results in estimating the black hole mass of double-peaked broad line AGNs using the relation (Wu & Liu 2004). These AGNs represent only a small fraction of AGNs and the double-peaked emission lines are usually attributed to the line emission from accretion disks. So far about 150 double-peaked broad emission line AGNs have been discovered. In a completed survey, Eracleous & Halpern (1994, 2003) have found 26 radio-loud double-peaked broad emission line AGNs. Recently Strateva et al. (2003) presented a new sample of 116 double-peaked Balmer line AGNs selected from the Sloan Digital Sky Survey (SDSS). In addition, double-peaked broad emission lines have been also found in some nearby galaxies, including NGC 1097, M81, NGC 4450, and NGC 4203. These objects are all classified spectroscopically as Type 1 LINERs with very smaller nuclear luminosity () and very lower Eddington ratios ()(Ho et al. 2000).
Strateva et al. (2003) have given the magnitudes (Galactic extinction corrected), redshifts and FWHM values of the double-peaked Hα line for 109 SDSS AGNs (7 objects have no FWHM values among 116 AGNs in their table 3). From the and magnitudes of these AGNs (available in Tables 1 and 2 in Strateva et al. (2003)), we can estimate the rest frame luminosity at 5100. Using the conversion formula between the FWHM values of Hα and Hα lines,, we can estimate the black hole masses of the double-peaked SDSS AGNs with Eqs (3) and (4). The same method can be applied to 26 double-peaked AGNs found from a survey of radio-loud emission line AGNs (Eracleous & Halpern 1994, 2003). The Eddington ratios (, where is the bolometric luminosity and is the Eddington luminosity) of these AGNs can be also derived if we adopted (Kaspi et al. 2000). For 109 SDSS double-peaked AGNs, the black hole masses of are in the range from to , and the Eddington ratios are between 0.002 and 0.2. The average black hole mass of these AGNs is and the average Eddington ratio is . For the 26 radio-loud double-peaked AGNs, the black hole masses are from to and the Eddington ratios are between 0.001 and 0.08, The average black hole mass of these 26 double-peaked AGNs is and the average Eddington ratio is , both being similar as those obtained for the double-peaked SDSS AGNs. Figure 4 summarized our results. Clearly, our derived Eddington ratios for the SDSS and radio-loud double-peaked AGNs are larger than the LINER-type double-peaked sources, which may reflect the difference in the accretion process for these AGNs (see section V for discussions).

IV Black hole masses derived from the BLR size and Hβ luminosity relation
IV.1 The relation

Using the available data of BLR sizes and Hβ fluxes for 34 AGNs in the reverberation mapping studies, we can investigate the relation between the BLR size and the Hβ emission line luminosity (Wu et al. 2004). The Hβ flux data were available for 16 PG quasars and 17 Seyfert 1 galaxies. Because there is no available data of Hβ flux for PG 1351+640 (Kaspi et al. 2000), we exclude this object from our investigation. In addition, we add another Seyfert galaxy Mrk 279 in our sample because both the BLR size and the Hβ flux have been measured recently (Santos-Lleo et al. 2001). All Hβ luminosity data have been corrected for Galactic extinction using the values from NED. With these data, we derive an empirical relation between the BLR size and Hβ luminosity:
| (5) |
The Spearman’s rank correlation coefficient of our relation is 0.91, slightly higher than 0.83 for the relation (Kaspi et al. 2000).
In Fig. 5 we show the dependence of the BLR size on and . Obviously these two relations are similar, which means that the relation can be an alternative of the relation in estimating the BLR size for radio-quiet AGNs.
IV.2 Comparison of black hole mass estimation of AGNs from two R-L relations
Since the relation obtained by Kaspi et al. (2000) has been frequently used to estimate the BLR size and the black hole mass of both radio-quiet and radio-loud AGNs, it is important to investigate the applicability of such an approach for radio-loud objects.

Brotherton (1996) studied the emission line properties of 59 radio-loud quasars. We adopted his published values of absolute V-band magnitude, equivalent width and FWHM of emission line. The continuum luminosity at 5100 and the luminosity were calculated after considering the Galactic extinction and K-correction (optical spectral index was assumed to be 0.3). We then estimated the BLR size using both and relations and derived the black hole mass with the formula (here we assume the BLR velocity as did by Kaspi et al. 2000). With these two relations, we also estimated the black hole masses of another 27 radio-loud quasars with available data of both the equivalent width and FWHM of emission line in the Parkes Half-Jansky flat-spectrum Sample (PHFS) (Drinkwater et al. 1997; Francis, Whiting & Webster 2000; Oshlack et al. 2001). We compared the black hole masses obtained with the and relations in Figure 6. Evidently the masses obtained with the relation are systematically lower that those obtained with the relation for some extremely radio-loud quasars. In Figure 6 we also show how the difference of black hole masses varies with the radio-loudness for these two samples of radio-loud quasars. It is clear that the difference of black hole masses is smaller when the radio-loudness is small but becomes larger as the radio-loudness increases. For some individual quasars with higher radio-loudness, the black hole mass estimated with the relation can be 310 times larger than that estimated with the relation. For radio-quiet AGNs, however, both the optical continuum and emission line luminosities are probably free from the jet contributions and therefore both can be good tracers of photo-ionization luminosity. Using these two relations will give almost identical results.
More recently Kong et al. (2006) extended such a study to the broad UV emission lines MgII and CIV. Their results confirm again that the relation between the BLR size and broad emission line luminosity can be used to derive more accurate black hole mass for extremely radio-loud AGNs.
V Discussions
We have presented some applications of using the empirical and relations to estimate the black hole mass of various types of AGNs and reported some progress in improving these studies by using the fundamental plane of the elliptical host galaxies of AGNs and the relation between the BLR size and broad emission line luminosity. Although there are still some uncertainties, these multiple methods can give consistent results on the black hole mass of most AGNs and have been used to reliably estimate the black hole mass of larger samples of AGNs.

Knowing black hole mass is important to study AGN physics. One of such examples is to use the black hole mass to estimate the Eddington ratio (, which usually defines the dimensionless accretion rate of AGNs. From the accretion disk physics, we know that at different accretion rate, the accretion flow may have different accretion modes (Abramowicz et al. 1995). Therefore, different Eddington ratios of AGNs may reflect different accretion physics. Fig. 7 shows the dependence of the broad band spectral index on the Eddington ratios for double peaked broad line AGNs with different luminosity. Clearly, the AGNs at higher accretion rate have different spectral shape in the overall spectral energy distributions (SED) from those at lower accretion rate. Wu & Liu (2004) has demonstrated that the objects with higher values display big blue bumps in the optical/UV bands, which is widely believed to be from the thermal radiation of an optically thick accretion disk (Shakura & Sunyaev 1973). On the contrary, the objects with smaller values (usually with smaller Eddington ratios) may host an optically thin, radiatively inefficient advection dominated accretion flow (Narayan & Yi 1994). Therefore, our knowledge of the accretion rate based on the black hole mass estimates is crucial to understand the accretion physics.
Acknowledgements.
XBW thanks the organizers for kind invitation and Prof. Heon-Young Chang, Prof. Myeong-Gu Park and the staffs in APCTP for hard works during the winter school. We are also grateful to Mr. Lei Qian and Mr. Bingxiao Xu for helpful discussions on black holes and accretion physics. This work is supported by the NSFC Grants (No. 10473001 & No. 10525313), the RFDP Grant (No. 20050001026) and the Key Grant Project of Chinese Ministry of Education (No. 305001).References
- (1) Abramowicz, M., Chen, X., Kato, S. et al. 1995, ApJ, 438, L37
- (2) Bettoni, D., Falomo, R., Fasano, G., et al. 2001, A&A, 380, 471
- (3) Brotherton, M.S. 1996, ApJS, 102, 1
- (4) Drinkwater, M.J., etal. 1997, MNRAS, 284, 85
- (5) Eracleous, M. & Halpern, J.P. 1994, ApJS, 90, 1
- (6) Eracleous, M. & Halpern, J.P. 2003, ApJ, 599, 886
- (7) Ferrarese, L., et al. 2001, ApJ, 555, L79
- (8) Francis, P.J., Whiting, M.T., Webster, R.L. 2000, PASA, 17, 56
- (9) Gebhardt, K. et al. 2000, ApJ, 539, L13 (
- (10) Gu, M., Cao, X., Jiang, D.R. 2001, MNRAS, 327, 1111
- (11) Ho, L.C. 1999, in Observational Evidence for Black Holes in the Universe, ed. S.K. Charkrabarti (Dordrecht: Kluwer), 157
- (12) Ho, L. C., et al. 2000, ApJ, 541, 120
- (13) Jorgensen, I., Frank, M., Kjaergaard, P. 1996, MNRAS, 280, 167
- (14) Kaspi, S., Smith, P.S., Netzer, H., Maoz, D., Jannuzi, B.T., & Giveon, U. 2000, ApJ, 533, 631
- (15) Kim, H.-K., & Lee, H. K. 2003, JKPS, 42, S40
- (16) Kong, M.Z., Wu, X.-B., Wang, R., Han, J.L. 2006, Chin. J. Astron. Astrophys. in press
- (17) Kormendy, J., Gebhardt, K. 2001, in AIP conference proceedings, Vol. 586. Edited by J. Craig Wheeler and Hugo Martel. ISBN 0735400261, p.363
- (18) Krolik, J.H., 2001, ApJ, 551, 72
- (19) Laor, A. 2000, ApJ, 543, L111
- (20) Laor, A. 2001, ApJ, 553, 677
- (21) Lee, H. K., & Kim, H.-K. 2002, JKPS, 40, 524
- (22) Liu, F.K., & Wu, X.-B., 2002, A&A, 388, L48
- (23) Lyden-Bell, D., 1969, Nature, 223, 690
- (24) Magorrian, J., Tremaine, S. Richstone, D., et al. 1998, AJ, 115, 2285
- (25) McLure, R.J, Kukula, M.J., Dunlop, J.S., Baum, S.A., O’Dea, C.P., & Hughes, D.H. 1999, MNRAS, 308, 377
- (26) Narayan, R., & Yi, I. 1994, ApJ, 428, L13
- (27) Nelson, C.H., & Whittle, M. 1995, ApJS, 99, 67
- (28) Oshlack, A. Y. K. N., Webster, R. L., Whiting, M. T. 2002, ApJ, 576, 81
- (29) Peterson, B.M. Ferrarese, L., Gilbert, K. M., et al. 2004, ApJ, 613, 682
- (30) Rees M.J., ARA&A, 1984, 22 471
- (31) Scarpa, R., Urry, C.M., Falomo, R., et al. 1999, ApJ, 521, 134
- (32) Santos-Lleo, M., et al. 2001, A&A, 369, 57
- (33) Scarpa, R., Urry, C. M., Falomo, R., Treves, A. 1999, ApJ, 526,643
- (34) Shakura, N.I. & Sunyaev, R.A. 1973, A&A, 24, 337
- (35) Strateva I., et al. 2003, AJ, 126 1720
- (36) Tremaine, S. et al. 2002, ApJ, 574, 740
- (37) Urry, C.M., Scarpa, R., O’Dowd, M. et al. 2000, ApJ, 532, 816
- (38) Valtaoja, E. et al. . 2000, ApJ, 531, 744
- (39) Wandel, A., Peterson, B.M., & Malkan, M.A. 1999, ApJ, 526, 579
- (40) Whiting, M.T., Webster, R.L., Francis, P.J. 2001, MNRAS, 323, 718
- (41) Wu, X.-B., Han, J.L., 2001a, ApJ, 561, L59
- (42) Wu, X.-B., Han, J.L., 2001b, A&A, 380, 31
- (43) Wu, X.-B., & Liu, F.K. 2004, ApJ, 614, 91
- (44) Wu, X.-B., Liu, F.K., Zhang, T.Z. 2002, A&A, 389, 742
- (45) Wu, X.-B., Wang, R., Kong, M.Z., Liu, F.K., Han, J.L., 2004, A&A, 424, 793