22institutetext: Sternberg Astronomical Institute, Moscow State University, Moscow, Russia
33institutetext: Institute of Astronomy & Astrophysics, National Observatory of Athens, I.Metaxa & B.Pavlou, P.Penteli 152 36, Athens, Greece, e-mail:mplionis@inaoep.mx
Physical Properties of Hickson Compact Groups and of the Loose Groups within which they are Embedded
Abstract
Using new data and an enlarged group sample we verify some of our previously published results and present a number of new facts that suggest that the compact groups could be casual concentrations in prolate-like looser groups and thus the nature of compact and ordinary poor groups should probably be the same.
To this end we use the Sloan Digital Sky Survey (SDSS) redshift catalogue to look for galaxies with accordant redshifts in the nearby environment (up to 2 Mpc) of 15 Hickson Compact Groups (HCG). We also use known member redshifts of looser groups in the environment of 7 other HCGs. Using this sample of 22 HCGs we find that: (a) HCG’s tend to be aligned with the overall galaxy distribution in their 1 Mpc environment, (b) the well-established orientation effect by which the group velocity dispersion, , correlates with group axial ratio , is present and particularly strong also in the HCG+environment systems, (c) the radial velocity dispersion of the HCG+environment systems as well as of ordinary poor groups only weakly depends on the group richness, i.e. on the mass, (d) the mean absolute magnitude of E/S0 galaxies in HCGs is similar to the corresponding one in ordinary poor groups, and is brighter than that of isolated E/S0’s, indicating that they were formed by the merging of two galaxies of similar luminosity, (e) the fraction of E/S0 galaxies in these HCGs depends, albeit weakly, on the group richness and on , (f) the fraction of AGNs is similar in the HCGs and their close environment, while the fraction of starburst galaxies is significantly higher in the HCGs, (g) the fraction of active galaxies (AGNs and starbursts) is anti-correlated with the velocity dispersion of the HCG+environment systems.
The combination of all the above facts constitutes a picture in which compact groups are condensations within looser prolate-like elongated systems and they appear as compact when their member galaxies, moving in radial orbits along the group elongation, happen to come close to each other (in which case dynamical interactions among these galaxies become even more probable) or when the group is oriented close to the line of sight, so that many of its members are projected over a small solid angle. The probability of either case is small and therefore the number of CGs should be much smaller than that of ordinary groups, as it is observed.
Furthermore, the observed fractions of early-type and active galaxies as well as their correlations with the group velocity dispersion suggests a picture by which nuclear activity and galaxy transformation by merging is instigated by effective gravitational interactions in the low-velocity dispersion groups, which then dynamically evolve via virialization processes to higher velocity dispersion groups, which thus have a higher fraction of early-type galaxies.
Key Words.:
galaxies: groups: general – dynamics: galaxies – morphology: galaxies – evolution1 Introduction
Compact Groups are environments with high surface galaxy density and relatively low radial velocity dispersion, . In recent decades several lists of CGs have been compiled (see the review by Hickson 1997; Focardi & Kelm 2002; Iovino et al. 2003; Lee et al. 2004; de Carvalho et al. 2005) but still the most extensively studied sample of CGs, is that of Hickson Compact Groups (HCGs) (Hickson 1982). N-body simulations have showed that strong galaxy interactions and merging should occur frequently in such systems, and CGs should eventually evolve to form a single elliptical galaxy on a time scale of a few orbital periods (Barnes 1985, 1989, 1990; Mamon 1987; Bode et al. 1993). For this reason the very existence of CGs has been questioned and debated. To explain the existence of CGs it has been suggested that field galaxies fall from time to time onto CGs, thus keeping the number of groups approximately constant (Diaferio et al. 1994, 1995; Governato et al. 1996; Ribeiro et al. 1998). However, observational estimates (Zepf et al. 1991; Moles et al. 1994, Zepf 1993; Mendes de Oliveira & Hickson 1994; Coziol, Brinks & Bravo-Alfaro 2004) suggest relatively low merger rates. To explain these observations Coziol, Brinks & Bravo-Alfaro (2004) put forward two hypotheses: either the evolution of galaxies accelerates in richer systems, or CG’s form earlier in massive structures than in lower mass systems. Solutions to the problem come also (a) from the fact that CGs are small subsystems in larger ordinary (hereafter, loose) groups (LGs) (Rose 1977, Sulentic 1987; Rood & Williams 1989; West 1989; Mamon 1990; Vennik et al. 1993; Diaferio et al. 1994; Rood and Struble 1994; Tovmassian & Chavushyan 2000; Tovmassian 2001; Tovmassian, Yam, & Tiersch 2001) and (b) from a sufficiently high formation rate, so that despite their short merging times they are still abundant enough to be observed at the present numbers (e.g. Mamon 2000). Ramella et al. (1994) concluded that we see HCGs because they are being continually formed in collapsing LGs, as it was predicted by some N-body simulations of rich groups of galaxies (eg. Diaferio et al. 1995).
It has been shown that HCGs, Shakhbazian Compact Groups (Shakhbazian 1973; Baier & Tiersch 1979 and references therein) as well as poor groups have a prolate-like shape (Malykh & Orlov 1986; Oleak et al. 1995; Orlov et al. 2001; Plionis, Basilakos & Tovmassian 2004). Tovmassian, Martinez, & Tiersch (1999), showed that for HCGs the velocity dispersion correlates with the group projected shape: the lower the group projected axial ratio the smaller its velocity dispersion. They concluded that member galaxies move in radial orbits predominantly along the group elongation. Furthermore, Tovmassian (2001), Tovmassian, Yam, & Tiersch (2001), Tovmassian, & Tiersch (2001) showed that members of LGs in the environment of CGs are distributed in narrow strips of a couple of hundred kpc width, and of about 1 Mpc length while the projected position angle of the LG generally coincides with that of the CG. Using galaxy redshifts in the environments of 6 HCGs of de Carvalho et al. (1994) and Zabludoff & Mulchaey (1998), Tovmassian & Chavushyan (2000) showed that accordant redshift galaxies in the environments of these HCGs and poor groups obey even more strongly the dependence of the projected shape on the of the whole system. It follows that members of LGs should be gravitationally bound with CGs and have quasi-regular movement predominantly along the elongation of the whole system. Tovmassian & Chavushyan (2000), Tovmassian (2002) put forward the idea that CGs are ordinary poor groups in which the brighter members happen to be close to each other by chance during the orbital movement around the centre of gravity, or if the groups are seen end-on and most of its members are projected near to each other on the sky.
In this paper we present indications for a possible common nature of compact and loose groups of galaxies. We show that CGs are condensations in LGs and that the HCG+environment systems obey similar correlations as loose groups.
2 The sample
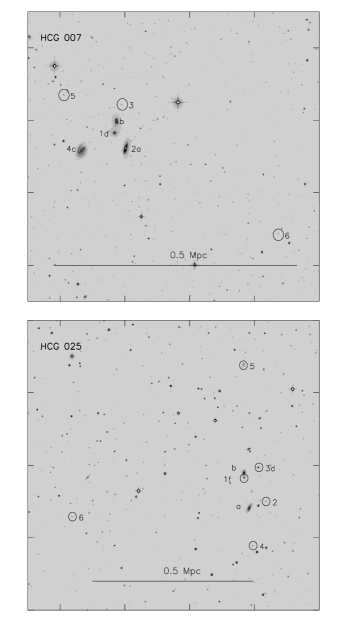
In order to study the dynamics of HCG+environment systems we analyse a sample of 22 HCGs. Since the projected mean length of poor groups is generally less than 1 Mpc111Throughout this paper we use km s-1 Mpc-1 (e.g. see Plionis, Basilakos, & Tovmassian 2004), we look for accordant redshift galaxies up to a distance of 2 Mpc from the original HCGs. We use mainly the SDSS (Abazajian et al. 2005) to search for galaxies with redshift separation from the centre of the corresponding HCG of km s-1 and within a circle of projected radius 2 Mpc radius. In the area covered by the SDSS we find 22 HCGs out of which 15 ( 7, 25, 35, 43, 45, 49, 50, 56, 58, 60, 66, 68, 82, 88 and 98) are sampled out to the projected separation limit discussed previously, while the other 7 are located near the SDSS survey limits and thus are not sampled adequately. Accordant redshift galaxies were found in the environment of 14 of these 15 groups (see Fig. 1). We have noted that in most cases the magnitude distribution of the accordant redshift galaxies does not differ from that of the HCG galaxies.
Furthermore, the environment of 6 other HCGs (HCG 40, HCG 63, HCG 64, HCG 67, HCG 87 and HCG 97) have been studied spectroscopically up to sufficiently large projected distances from their centre (de Carvalho et al. 1997; Zabludoff & Mulchaey 1998). The environment of one more group, HCG 92 (the well known Stephan Quintet), has been studied in HI emission by Shostak, Sullivan III, & Allen (1984) who detected 5 accordant redshift galaxies, and by Williams, Yun & Verdes-Montenegro (2002) who detected one more accordant redshift galaxy (last image in Fig 1). We assume that the discordant redshift galaxy NGC 7320 is not a member of the group.
![[Uncaptioned image]](/html/astro-ph/0605144/assets/x2.png)
Fig. 1. – Continuation
![[Uncaptioned image]](/html/astro-ph/0605144/assets/x3.png)
Fig. 1. – Continuation
![[Uncaptioned image]](/html/astro-ph/0605144/assets/x4.png)
Fig. 1. – Continuation
We found that the velocity dispersions of a few HCG+environment systems are higher than those of loose groups which generally do not exceed 400 km s-1. Unusually high are the ’s of groups HCG 50 and HCG 82: 546 km s-1 and 468 km s-1, respectively. Note that using the original four members of HCG 82 we obtain an even larger value: km s-1. This leads us to the suspicion that they could be the result of projection effects. The group HCG 50 could well be the superposition of two independent groups. The original four galaxies, , , and (Hickson designations) of this group could compose two groups. One with km s-1 and =263 km s-1 (HCG 50a), and one with km s-1 and km s-1 (HCG 50b). The radial velocities of the two subgroups differ by km s-1, which if viewed as a radial separation corresponds to a distance between two subgroups of about 13 Mpc. Regarding the group HCG 82, we assume that it consists of 6 accordant redshift galaxies, , , and the SDSS galaxies 3, 4, 5 and 6 with km s-1 and =233 km s-1. We suppose that two galaxies, and , with mean km s-1 and km s-1, are background galaxies either completely unrelated to the group or they are infalling to the group. The radial velocity difference between the group and the possible background double is again km s-1, with corresponding possible radial separation of 13 Mpc222Note that including the original groups in our list change only slightly the results of the forthcoming analysis (see Fig. 3)..
Our final sample consists of 23 groups (since HCG 50 is split into 2 groups) which almost all have in their environment accordant redshift galaxies. The groups HCG 35, HCG 58, HCG 60 and HCG 68 seem to be condensations within relatively rich groups consisting of 21, 15, 16 and 15 members respectively. Accordant redshift galaxies were not found in the environment of only one group, HCG 43. Note also that accordant redshift galaxies were found by de Carvalho et al. (1997) and Zabludoff & Mulchaey (1998) in the nearest environment of 15 more HCGs. Thus, most of HGGs, together with the accordant redshift galaxies in their near environment, contain between 4 and galaxies, while their projected length reaches 1-2 Mpc.
3 HCG and Loose Group association
3.1 Alignment of the HCG with its environment
We find that the projected distribution of the accordant redshift galaxies lie in most cases along the position angle defined by the original HCG galaxies. In Figure 2 we present the distribution of relative position angles, , between the original HCG position angle and that of the environment galaxies (in which case the original HCG is weighted only by its centre of mass). Similar alignment effects have been found between neighboring clusters (e.g. Binggeli 1982, Plionis 1994) as well as between the major axis of the brightest clusters galaxies and that of the parent cluster itself (e.g. Plionis et al. 2003 and references therein). It is evident that accordant redshift galaxies are distributed preferentially along the elongation of the HCG (see also Tovmassian & Tiersch 2001; Tovmassian 2001), implying group formation by infall and accretion along large-scale filaments.
The significance of the observed alignment signal is estimated by applying a Monte-Carlo procedure by which we ask what is the probability that at least half of the 16 values, randomly selected between 0 and 90 degrees, will have , as it observed in Figure 2. We find that this probability is only 0.025.

This probability is also corroborated by estimating the first moment of the fourier transfrom of the distribution and comparing it with the expected random moment distribution. This approach gives a random probability of , in rough agreement with our Monte-Carlo procedure.
3.2 Velocity dispersion and the shape of HCGs and their environment
In Table 1 we present the different parameters of the original HCGs and the corresponding values of the HCG+environment systems. We determined the axial ratio using the moment of inertia method (cf. Basilakos et al. 2000 and references therein; Plionis, Basilakos & Tovmassian 2004). The HCG+environment systems with have , similar to the mean elongation found by Plionis Basilakos, & Tovmassian (2004) for the corresponding UZC-SSRS2 group catalogue (USGC; Ramella et al 2002) which is based on the Updated Zwicky Catalogue (UZC; Falco et al. 1999) and the Southern Sky Redshift Survey (SSRS2; da Costa et al 1998). Hence, we may assume that similar to poor groups they have a prolate-like shape (see also Malykh & Orlov 1986).
Inspecting Table 1 we see that the velocity dispersion of HCG+environment systems does not differ significantly from that of the original HCGs. In some HCG+environment systems their is even smaller than that of the original CGs, supporting the suggestion (Tovmassian & Chavushyan 2000, Tovmassian 2002) that LG members are gravitationally bound to corresponding CGs. Thus, HCGs appear to be condensations in richer and gravitationally bound galaxy aggregates.
We also compare the mean axial ratio for all the HCG+environment systems (which is ) with that of the USGC groups. Due to the possible intrinsic correlation of the group elongation with group membership, we weight the original USGC values such that they respect the membership distribution of the HCG+environment systems. Doing so we find a USGC group axial ratio of which is in complete agreement with that of the HCG+environment systems.
| HCG | /km s-1 | /km s-1 | |||
|---|---|---|---|---|---|
| HCG | HCG+environment | ||||
| 7 | 4 | 89 | 7 | 89 | 0.22 |
| 25 | 4 | 61 | 8 | 97 | 0.18 |
| 35 | 6 | 350 | 21 | 306 | 0.63 |
| 40 | 5 | 149 | 6 | 296 | 0.55 |
| 43 | 5 | 222 | 5 | 222 | 0.61 |
| 45 | 4 | 234 | 10 | 381 | 0.66 |
| 49 | 4 | 34 | 9 | 60 | 0.19 |
| 50 | 5 | 472 | 8 | 546 | - |
| 50a | - | 4 | 266 | 0.45 | |
| 50b | - | 4 | 96 | 0.16 | |
| 56 | 5 | 170 | 6 | 126 | 0.29 |
| 58 | 5 | 162 | 15 | 140 | 0.46 |
| 60 | 4 | 427 | 16 | 472 | 0.60 |
| 63 | 3 | 132 | 7 | 188 | 0.21 |
| 64 | 3 | 214 | 6 | 239 | 0.26 |
| 66 | 4 | 306 | 9 | 414 | 0.78 |
| 67 | 4 | 211 | 14 | 339 | 0.73 |
| 68 | 5 | 172 | 15 | 155 | 0.65 |
| 82 | 4 | 620 | 6 | 233 | 0.22 |
| 87 | 3 | 121 | 6 | 215 | 0.19 |
| 88 | 4 | 27 | 6 | 76 | 0.39 |
| 92 | 4 | 390 | 10 | 337 | 0.53 |
| 97 | 5 | 370 | 14 | 402 | 0.66 |
| 98 | 3 | 120 | 8 | 238 | 0.30 |
3.3 Correlation of velocity dispersion, number of group members and shape
Compact groups as well as poor groups of galaxies have been shown to have prolate-like shapes (Malykh & Orlov 1986; Orlov et al. 2001; Oleak et al. 1995; Plionis et al. 2004), while their observed appears to depend on the orientation of the group with respect to the observer (e.g. Tovmassian, Martinez, & Tiersch 1999). The similarity of the axial ratio distribution and its mean value between the original HCGs and the sample of HCG+environment systems studied here and in the work of Tovmassian & Chavushyan (2000) suggests that the HCG+environment systems also have a prolate-like shape.

Therefore, if galaxies move in radial orbits along the major axis of these highly elongated groups, one should expect on the basis of projection effects a correlation between the velocity dispersion of the groups and their axial ratio, by which groups oriented close to the orthogonal to the line of sight will have relatively small projected and small while groups oriented close to the line of sight will have larger ’s and larger ’s.
Indeed, for the considered HCG+environment systems we find a strong () and significant () correlation between and (left panel of Fig. 3) with:
This effect can also be seen if we divide the groups into those with km/sec (13 groups) and those with km/sec (10 groups) which have median -value and 67% and 33% quantile limits of and , respectively.
However, beyond the orientation effect discussed, another effect could contribute or even dominate the observed correlation. This is related to the possible different evolutionary stage of groups with different values of . Richer systems (with larger ) will be relatively more virialized, having a higher value of , and will therefore have a higher value of , since virialization tends to sphericalize dynamical systems. The central panel of Fig. 3 shows that groups with larger indeed have a higher axial ratio , with quite a strong correlation (, ). Since is also only weakly (, ) correlated with (lower right panel of Fig. 3), different stages of virilization cannot be the sole reason for the correlation and thus the orientation effect should be a major contributer.
As a further test of the relative strength of the two effects (orientation and virialization) we study the corresponding correlation of the 17 groups with , which are relatively poor and thus are not expected to be at a very different dynamical stage. Indeed, as can be seen in Fig.4 (lower left and right panels) for these groups we find no or correlations ( and for both), while we do find a strong correlation (upper panel of Fig.4) with and .

However, we would like to caution the reader that it is also possible that groups of even equal mass could be at different dynamical stage, depending on the environment in which they are located. Indeed, Ragone & Plionis (2006, in preparation), using large cosmological N-body simulations, have found that there is a significant correlation between the velocity dispersion and the group elongation (in 3D space but which survives also in projection) for equal mass group halos.
Finally, we investigate whether discreteness effects can introduce a bias in the correlations discussed so far. Tracing ellipsoids with a discrete distribution of particles can bias the intrinsic shape of the parent structure (e.g. Paz et al. 2006). Projection from three to two dimensions also alters the intrinsic axial ratio distribution (cf. Hubble 1926; Carter & Metcalfe 1982) with the projected structures appearing more spherical and typically smaller than the three dimensional ones. We have investigated the coupling of the two effects by Monte-Carlo simulations. We trace a 3 dimensional prolate spheroid of predetermined axial ratio and size with a variable number of particles. We then project the distribution of particles in the three Cartesian planes after randomly orienting the spheroids with respect to a predetermined line of sight.
.
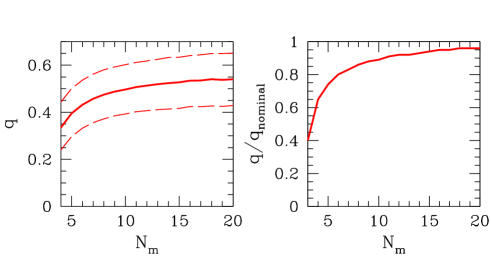
In the left panel of Figure 5 we present the median projected values together with the 67% and 33% quantile limits, derived from our Monte-Carlo analysis, as a function of the number of points used to sample the 3D prolate spheroid. We have used an intrinsic axial ratio for the 3D prolate spheroid of which provides a projected axial ratio of , near the value of our best sampled (richer) HCG+environment groups.
It is evident that there is a trend of decreasing sphericity with decreasing group galaxy membership as in the observed group case. In the right panel of Fig.5 we show the fractional decrease of the nominal projected group axial ratio, which in turn provide us with a multiplicative correction factor by which we can attempt to crudely correct the observed group values for the effect of discreteness. Note that small variations in the input nominal group -value changes insignificantly the fractional correction factor.
We quantify again the previous correlations but using now the corrected group values and we find that the correlation remains mostly unaltered and significant ( and ), while the correlation, which could be viewed as that resulting from the different virialization stages of groups of different richness, becomes weak and completely insignificant ( and ).
These results indicate that the orientation effect could be the dominant one in shaping the correlation. As a final point we note that the dynamical properties and correlations of HCG+environment systems do not differ from those of poor groups.
3.4 The magnitudes of E,S0 galaxies in HCGs
Tovmassian, Plionis, & Andernach (2005 hereafter TPA) found that the mean K-band absolute magnitude, , of E/S0 galaxies in USGC poor groups, located at distances km s-1, is equal to . This is on average brighter by than that of isolated E/S0 galaxies and of spiral galaxies (Sa and later) either in groups or in the field (in the same redshift range and within the same - within 0.2 mags - apparent magnitude limit). Furthermore, the values of isolated E/S0 and spiral galaxies practically do not differ from each other. This fact allowed TPA to conclude that E/S0’s in groups are formed as the result of the merging of two galaxies of comparable luminosity and thus mass (if we assume the same ).
In order to perform a similar study using Compact Groups, we have selected all HCGs that lie in the previously mentioned redshift range, and we determined absolute K-band magnitudes, as in TPA, by using the magnitudes from (see Jarrett et al. 2000; http://www.ipac.caltech.edu/2mass), corrected for Galactic extinction according to Schlegel, Finkbeiner, & Davis (1998). Furthermore, the group radial velocities were corrected for the peculiar velocity of the Local Group and a local velocity field that contains a Virgo-centric infall component and a bulk flow given by the expectations of linear theory (see Branchini, Plionis, & Sciama 1996).
Note that we do not restrict our HCGs sample to that of Table 1 because most of these HCGs have redshifts outside the range of interest. We extend our sample to include all HCGs that fall within this range (in total 20 groups) and therefore in the estimation of the mean absolute galaxy luminosities we use only HCG galaxies and not accordant redshift galaxies of the environment (which we have identified only for the HCGs which fall within the SDSS survey limits).
It is important to note that the magnitude limits of the galaxy samples from which the USGC and HCG groups have been selected, are different ( and , respectively). This implies that the two galaxy samples will trace a different fraction of intrinsically faint and bright galaxies. The HCG galaxies being drawn from a fainter sample than the USGC sample will contain a larger fraction of nearby faint galaxies. However, we can overcome the bias introduced by: (a) excluding from our comparison the HCG galaxies with apparent magnitudes larger than the USGC limit () and (b) limiting our analysis to the same redshift range and requiring that the two samples have statistically compatible redshift distributions.
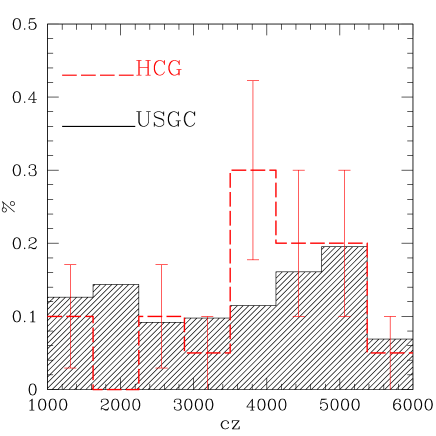
In Figure 6 we present the two group redshift distributions and indeed, we verify that this is the case since the KS two-sampled test shows that the probability of the two redshift distributions been drawn from the same parent distribution is 0.15.
In Table 2 we compare the values for the USGC and HCG groups within the same radial velocity limits and with . It is evident that the corresponding average absolute magnitudes of early type galaxies between the USGC and HCG groups are almost identical (), from which we infer that in both HCG and USGC groups, the E/S0 galaxies are formed similarly by the merging of two spiral galaxies of roughly the same luminosity (see TPA).
| E/S0 | Spirals | |
|---|---|---|
| USGC | (156) | (310) |
| HCG | (24) | (24) |
We note that a more complete study of the possible luminosity differences of the two group samples would entail the derivation of their respective luminosity functions (eg. Mendes de Oliveira & Hickson 1991; Kelm & Focardi 2004), which is however out of the scope of the present study.
3.5 The fraction of E/S0 galaxies
TPA also found that the mean fraction of E/S0 galaxies of poor USGC groups with is , significantly higher than that of the Karachentseva, Lebedev & Shcherbanovskij (1986) sample of isolated galaxies, which is equal to . They also showed that very weakly depends on the group richness, while a significant, although weak, correlation exists between the group and velocity dispersion.
In this work we use the morphological classification of HCG member galaxies from Hickson (1994). Note that we have no such classification for the accordant redshift galaxies. Therefore we will only consider the HCG galaxies in this section. We caution the reader that this may not properly represent the morphological content of the whole HCG+environment system.
The mean fractions of E/S0 galaxies in the HCG groups is (with the corresponding median of 0.4) which is about twice the value of the USGC poor groups, which in turn is 65% higher than that of isolated galaxies (Tovmassian, Plionis & Andernach 2004). Kelm & Focardi (2004) have also found that the UZC compact groups have a higher content of E/S0’s than that found among isolated galaxies. They also showed that the fraction of E/S0’s among close neighbours of compact groups is intermediate between that of CGs and isolated galaxies.
Furthermore, we find a weak correlation between HCG+environment richness () and (with and random probability ; see left panel of Fig.8). For example, the median value of groups with is equal to while the corresponding value of the groups with is . This correlation, albeit weak, seems to be in agreement with the well-established morphology-density relation (e.g. Dressler 1980; Goto et al. 2003; Helsdon & Ponman 2003).
We also find a weak correlation between and with and (see right panel of Fig.8). For example, dividing the HCG+environment groups in two subsamples based on their velocity dispersion we find, for those with km s-1 a value of and for those with km s-1, .
Using the sample of richer LGs in the environment of some poor groups and HCGs, Zabludoff & Mulchaey (1998) also found that is definitely correlated with .

In order to explain the correlation they suggested that either galaxy morphology is set by the size of the local potential at the time of galaxy formation (Hickson, Kindl & Huchra 1988) and/or that and increase as a group evolves (Diaferio, Geller, & Ramella 1995). The correlation, albeit weak, between and the HCG X-ray luminosity (Ponman et al. 1996) also suggest that groups with high values of are dynamically more evolved, possibly virialized systems.
In line with this model, Tovmassian, Plionis, & Andernach (2004) suggested that in elongated prolate-like groups, in which members move predominantly along the group elongation, the probability of encounter and merging, and thus formation of E/S0 galaxies, is quite higher than in a spherical overdensity of the same major axis size in which galaxy orbits are “chaotic”. In effect what we suggest is that in such highly elongated groups, and prior to virialization, galaxies move along the group elongation in semi-regular orbits, as expected during the anisotropic infall of galaxies in groups/clusters along filaments. During this phase and due to the initially lower velocity dispersion of these unrelaxed systems, many interactions and merging takes place (from which the higher fraction of E/S0 emerges). Subsequently, the velocity dispersion of these systems increase due to virialization processes which also results in heating the intergalactic gas, which then emits in X-rays.
3.6 The fraction of active galaxies
The high density environment of the HCGs in combination with their relative low velocity dispersion constitutes these environments as probable sites of strong galaxy interactions, suggested also by their higher fraction of E/S0 galaxies. If the AGN fueling mechanism is triggered by such interactions one would expect to see a different fraction of AGNs with respect to the field. Kelm et al. (1998) find that of HCG members are Seyferts, while if one includes LINERs this fraction increases to 18% (Coziol et al 2000). Furthermore, the latter authors showed that including low-luminosity systems this fraction increases even further to %, in agreement with Ho et al. (1997).
For our sample of 14 HCGs we have spectral classification for 32 HCG galaxies and 87 close environment galaxies. Since we do not have the spectral classification of all the galaxies in the HCGs and their environment, we stack together all the available data in two samples (HCG and close environment galaxies). Furthermore, the different distances of the HCGs analysed in this work, produce a variable sampling of the individual luminosity function of the different HCG and their environment. Therefore, the following analysis is mostly valid as a comparison between the activity in HCGs and their close environment.
It is interesting that no Seyfert 1 spectra was identified, in agreement with the analysis of Coziol et al. (2000) of the Southern CG sample (Iovino 2002). However, in our case, we cannot exclude that small number statistics could be the cause of such a paucity. Most importantly, we find 31% () and 13% () of AGNs and starburst galaxies, respectively, in the HCGs, while these fractions are 29% () and 4.6% () for the close environment galaxies. If we restrict our analysis to Seyfert type AGNs (excluding LINERs) we find that their fractions are 6.5% and 8% respectively between the HCGs and their close environment. These fractions are in general agreement with Coziol et al (2000) but the Seyfert fraction appears to be higher than that of Kelm et al. (2004).
The most important results of this analysis is that
-
•
the fraction of AGNs (being Seyferts or LINERs) does not vary significantly between the HCGs and the looser groups within which they are embedded (see also Shimada et al. 2000), and
-
•
what varies at a significant level appear to be the fraction of starbursting galaxies, which is quite higher in the dense environment of the HCGs.
The former could be the result of perturbations caused on disk galaxies by the HCG tidal field, even before close galaxy encounters and interactions take place in the HCG centres. Such perturbations can cause an inflow of gas towards the disk centre, triggering bursts of star formation and possibly feeding the AGN (e.g. Byrd & Valtonen 1990, Fujita 1998). This could explain why the fraction of AGNs is the same in the HCGs and in their close environment, implying that the AGNs are well in place already in the looser groups. The higher fraction of starbursting galaxies in the HCGs with respect to their close environment, then implies that only starburst activity is enhanced by the close encounters and interactions that take place in the dense HCGs.

Furthermore, Focardi & Kelm (2002) and Coziol et al. (2004) have found a correlation between the dynamics of the CG and the galaxy member activity, with galaxies being more active and dominated by late-type morphologies in lower velocity dispersion systems. We verify their result also in our the HCG+environment systems, as can be seen in Figure 9, were we correlate the fraction of active galaxies (AGNs and starbursts) with the HCG+environment velocity dispersion. An anti-correlation is present with Spearman correlation coefficient of and the probability of random correlation being . This anti-correlation is robust to the exclusion of individual groups.
So a possible overall picture emerges in which high velocity dispersion compact groups, which are also X-ray luminous (e.g. Ponman et al 1996), are dynamically more evolved and their late-type galaxy members had enough time to interact, merge and evolve into earlier types. The low-velocity dispersion CGs, are dynamically younger, richer in late-type and in active galaxies, yet unevolved.
4 Conclusions
Using SDSS spectroscopic data we have searched the close environment of 22 HCGs and found that the large majority is embedded in galaxy overdensities that extend up to 1 Mpc around the HCG centre. A wealth of indications point in the direction that HCGs are condensations within looser prolate-like groups of galaxies with dynamical and morphological characteristics similar to those of poor groups (like the USGC groups studied by Plionis et al. 2004).
For example, (a) the HCG+environment elongation is similar to that of the USGC groups, (b) the HCG+environment groups show the same axial ratio - velocity dispersion correlation as the USGC groups, a correlation which, as we have shown, could be due to an orientation effect of intrinsically prolate-like groups, (c) the mean K-band absolute magnitude of E/S0 galaxies in HCGs is about the same as that in poor USGC groups, which is brighter by than that of isolated E/S0’s and group or isolated spiral galaxies, showing that E/S0’s in CGs, as in USGC groups, could be formed as the result of the merging of two galaxies of similar luminosity, (d) the mean fraction of early type galaxies in HCGs is higher than in the field but also twice as high as in poor USGC groups, indicating enhanced merging in the central compact condensations of poor groups, (e) the fraction depends weakly on the richness and the velocity dispersion of the HCG+environment groups (f) the fraction of AGNs is similar between members of HCGs and their close environment galaxies, while the fraction of starburst galaxies is significantly higher in the HCGs, (g) the fraction of active galaxies (AGNs and starbursts) is anti-correlated with the velocity dispersion of the HCG+environment systems.
These results could be explained by noting that groups are very elongated prolate-like structures (e.g. Plionis, Basilakos & Tovmassian 2004) in which galaxies should move in radial orbits around the group gravitational centre. Thus we expect that in many occasions what appears to be a compact group is just an ordinary group, or part of it, observed either when some of its member galaxies happen to be close to each other, during their radial orbits along the group elongation, or if the group is oriented close to the line of sight, and all its members are projected over a small solid angle. Of course in the former case gravity will play its role in inducing interactions, the results of which will depend on a multitude of initial conditions (relative galaxy velocities, orbit trajectories, local background density, galaxy morphology and gas content, etc). Our results indicate that the main outcome of such interactions, in the compact group centre, is an enhanced starburst activity but not necessarily the triggering of an AGN.
Furthermore, our results show that the members of groups with high velocity dispersion are predominantly early-type non-active galaxies while members of presently low-velocity groups (probably indicating their earlier evolutionary stage) are predominantly late-type active galaxies. These findings are in good agreement with Coziol, Brinks & Bravo-Alfaro (2004) and suggest an evolutionary sequence by which initially late-type galaxies, in an initially low velocity dispersion group (indicating either a low-mass system or a dynamically unevolved more massive system), interact with the group tidal field - by which both the AGN and starburst activity is triggered - then virialization processes, which increase the group velocity dispersion and X-ray emission, and galaxy merging will result into a high velocity dispersion, X-ray luminous, group with a higher fraction of early-type galaxies. Note also, that numerical simulations (Gómez-Flechoso & Dominguez-Tenreiro 2001) have shown that there is a lack of enhanced merger activity in the quiescent virialized CG halos suggesting that early-type galaxies form in the initial group formation stage, when the CG velocity dispersion is still low.
Acknowledgements.
HMT and MP acknowledge funding by the Mexican Government grants SEP-2003-C02-44376/A-1 and CONACyT-2002-C01-39679, respectively. We thank the referee, Gary Mamon, for many useful comments and suggestions.References
- (1) Abazajian, K. et al., 2005, AJ, 129, 1755
- (2) Baier, F. W., Tiersch, H., 1979, Astrofizika, 15, 33
- (3) Barnes J. 1985, MNRAS 215, 517
- (4) Barnes J. 1989, Nat 338, 123
- (5) Barnes J. 1990, in Dynamics and Interaction of Galaxies, ed. Weilen (Springer–Verlag, Heidelberg), 186
- (6) Basilakos, S., Plionis, M., & Maddox, S. J. 2000, MNRAS, 316, 779
- (7) Binggeli, B., 1982, A&A, 107, 338
- (8) Bode, P.W., Cohn, H.N., Lugger, P.M., 1993, ApJ, 416, 17
- (9) Branchini, E., Plionis, M., Sciama, D.W., 1993, ApJ, 461, L17
- (10) Byrd, G., Valtonen, M., 1990, ApJ, 350, 89
- (11) Carter, D. & Metcalfe, N., 1980, MNRAS, 191, 325
- (12) Coziol, R., Brinks, E., & Bravo-Alfaro, H. 2004, AJ, 128, 68 [CBBA]
- (13) Coziol, R., Iovino, A., de Carvalho, R.R., 2000, AJ, 120, 47
- (14) Paz, D. J.; Lambas, D. G.; Padilla, N.; Merch n, M., 2006, MNRAS, 366, 1503
- (15) de Carvalho, R. R., Ribeiro, A. L. B., Capelato, H.V., & Zepf, S. E. 1997, ApJSS, 110, 1
- (16) da Costa, L.N., et al., 1998, AJ, 116, 1
- (17) de Carvalho, R. R., Ribeiro, A. L. B., & Zepf, S. E. 1994, ApJS, 93, 47
- (18) de Carvalho, R.R., Gon alves, T.S., Iovino, A., Kohl-Moreira, J.L., Gal, R.R., Djorgovski, S.G., 2005, AJ, 130, 425
- (19) Diafero A., Geller M.J., & Ramella M. 1994, AJ, 107, 868
- (20) Diafero A., Geller M.J., & Ramella M. 1995, AJ, 109, 2293
- (21) Dressler, A., 1980, ApJ, 236, 351
- (22) Falco, E.E., et al., 1999, PASP, 111,438
- (23) Focardi,B., Kelm, B., 2002, A&A, 391, 35
- (24) Fujita, Y., 1998, ApJ, 509, 587
- (25) Gómez-Flechoso, M. A., & Dominguez-Tenreiro, R. 2001, ApJ, 549, L187
- (26) Goto, T. et al., 2003, MNRAS, 346, 601
- (27) Governato F., Tozzi P., & Cavaliere A. 1996, ApJ, 458, 18
- (28) Hubble, E.P., 1926, ApJ, 64, 321
- (29) Jarrett, T. H., Chester, T., Cutri, R, Schneider, S., Skrutskie, M., & Huchra, J. P. 2000, AJ, 119, 2498
- (30) Hickson, P., 1982, ApJ, 255, 382
- (31) Hickson, P., Huchra, L., & Kindl, E. 1988, ApJ, 331, 64
- (32) Hickson, P., 1994, Atlas of Compact Groups of Galaxies, Gordon and Breach, New York
- (33) Hickson P., 1997, ARA&A, 35, 360
- (34) Hickson, P., Mendes de Oliveira, C., Huchra, J.P., & Palumbo, G.G.C. 1992 ApJ, 399, 353
- (35) Hickson P., Ninkov Z., Huchra P., Mamon G. A. 1984, in Clusters and Groups of Galaxies, Mardirossian F., Guiricin G., Mezzetti . (eds.), 367
- (36) Ho, L.C., Filippenko, A.V., Sargent, W.L.W., 1997, ApJ, 487, 568
- (37) Iovino, A., 2002, AJ, 124, 2471 Paz, D. J.; Lambas, D. G.; Padilla, N.; Merch n, M.
- (38) Iovino, A., de Carvalho, R.R., Gal, R.R., Odewahn, S.C., Lopes, P.A.A., Mahabal, A, Djorgovski, S.G., 2003, AJ, 125, 1660
- (39) Karachentseva, V. E. Comm. Spec. Ap. Obs. USSR, 8, 1
- (40) Kelm, B., Focardi, P., Palumbo, G.G.C., 1998, A&A, 335, 912
- (41) Kelm, B., Focardi, P., Zitelli, V., 2004, A&A, 418, 25
- (42) Kelm, B., Focardi, P., 2004, A&A, 418, 937
- (43) Kuntschner, H., Smith, R. J., Colles, M., Davies. R. L., Kaldare, R., & Vazdekis, A. 2002, MNRAS, 337, 172
- (44) Lee, B.C., et al., 2004, AJ, 127, 1811
- (45) Malykh, S. A., Orlov, V. V. 1986, Astofizika 24, 445
- (46) Mamon G.A. 1987, ApJ 321, 622
- (47) Mamon G.A. 1990, IAU colloquim 124, p.609
- (48) Mamon G.A. 1992, ApJ, 401, L3
- (49) Mamon G.A. 2000, IAU 174 on Small Galaxy Groups, ed. M. Valtonen & C. Flynn, ASP series 209, p.217
- (50) Marzke, R.O., Geller, M.J., Huchra, J.P., Corwin, H.G.Jr., 1994, AJ, 108, 437
- (51) Mendes de Oliveira, C. & Hickson, P. 1994, ApJ, 427, 684
- (52) Mendes de Oliveira, C. & Hickson, P. 1991, ApJ, 380, 30
- (53) Moles, M., del Olmo, A., Perea, Masegosa, J., Marquez, I, & Costa V. 1994, A&A, 285, 404
- (54) Oleak H., Stoll D., Tiersch H., MacGillivray H. T. 1995, AJ, 109, 1485
- (55) Paz, D.J., Lambas, D.G., Padilla, N., Merch n, M., 2006, MNRAS, in press
- (56) Orlov, V.V., Petrova, A.V., Tarantaev, V.G., 2001, MNRAS, 325, 133
- (57) Plionis, M., 1994, ApJS, 95, 401
- (58) Plionis,M., Benoist, C., Maurogordato, S., Ferrari, C., Basilakos, S., 2003, ApJ, 594, 144
- (59) Plionis, M., Basilakos, S. & Tovmassian, H.M. 2004, MNRAS, 352, 1323
- (60) Ponman, T.J., Bourner, P.D.J., Ebeling, H., Bohringer, H., 1996, MNRAS, 283, 690
- (61) Ramella, M., Diaferio, A., Geller, M. J., & Huchra, J.P. 1994, AJ, 107, 1623
- (62) Ramella, M., Geller, M. J., Pisani, A., & da Costa, L. N. 2002, AJ, 2976, 123
- (63) Ribeiro A.L.B., de Carvalho R.R., Capelato H.V., & Zepf S.E. 1998, ApJ, 497, 72
- (64) Rose, J. A., 1977, ApJ, 211, 1927
- (65) Rood H.J. 1979, ApJ 233, 21
- (66) Rood, H.J., & Struble, M. F., 1994, PASP, 106, 416
- (67) Rood, H.J., & Williams, B.A., 1989, ApJ, 339, 772
- (68) Schlegel, D. J., Finkbeiner, D. P., & Davis, M. 1998, ApJ, 500, 525
- (69) Shakhbazian, R. K., 1973, Astrofizika, 9, 495
- (70) Shimada, M., Ohyama, Y., Nishiura, S., et al., 2000, AJ, 119, 2664
- (71) Shostak, G. S., Sullivan III, W. T., & Allen, R. J. 1984, A&A, 139, 15
- (72) Sulentic, J.W., 1987, ApJ, 322, 605
- (73) Tovmassian, H. M. 2001, PASP, 113, 543
- (74) Tovmassian, H. M. 2002, AN, 323, 488
- (75) Tovmassian, H. M., & Chavushyan, V. H., 2000, AJ, 119, 1687
- (76) Tovmassian, H. M., Martinez, O., & Tiersch, H., 1999, A&A, 348, 693
- (77) Tovmassian, H. M., & Tiersch, H., 2001, A&A, 378, 740
- (78) Tovmassian, H. M., Yam, O., Tiersch, H. 2001, Rev. Mex. A&A, 37, 173
- (79) Tovmassian, H. M., Plionis, M. & Andernach, H. 2004, ApJL, 617, L111 [TPA]
- (80) West, M. J. 1989, ApJ, 344, 535
- (81) Zabludoff, A. I., & Mulchaey, J. S. 1998, ApJ, 496, 39
- (82) Zepf, S. E., Whitmore, B. C., & Levison, H. F., 1991, ApJ, 383, 524
- (83) Zepf, S. E. 1993, ApJ, 418, 72
- (84) Vennik, J., Richter, G. M., & Longo, G., 1993, AN, 314, 393
- (85) Williams, B. A., Yun, M. S., & Verdes-Montenegro, L. 2002, AJ, 123, 2417