Dynamical evidence of the age–metallicity relation in the Milky Way disk††thanks: This paper is based on data collected at the Observatório do Pico dos Dias, operated by Laboratório Nacional de Astrofísica, MCT, Brazil.
Abstract
Aims. We studied the relationship between the average stellar abundance of several elements and the orbital evolution of stars in the neighbourhood of the Sun.
Methods. We used both observational data for 325 late-type dwarfs in a volume-complete sample and simulations of the orbital diffusion. Metallicities, ages, and initial position and velocities for the simulated stars are sampled from empirical distributions of these quantities in the Milky Way.
Results. We found that that there is a relationship between the average stellar abundance of Fe, Na, Si, Ca, Ni, and Ba and the mean orbital radius of stars currently passing through the solar neighbourhood. The greater the difference between the mean orbital radius and the solar Galactocentric distance, the more deficient the star is, on average, in these chemical species.
Conclusions. The stars that take a longer time to come from their birthplaces to arrive in the present solar neighbourhood are more likely to be more metal-poor than those that were born here. This result is a direct, independent indication that a tightly defined Galactic age-metallicity relation exists.
Key Words.:
Galaxy: evolution – stars: late-type – solar neighbourhood1 Introduction
Although one of the core consequences of the chemical evolution theory is the gradual increase in the metal content of the interstellar medium (ISM) and the progressive enrichment of subsequent stellar generations, some authours have found little, if any, indication that an age–metallicity relation (AMR) exists amongst solar neighbourhood late-type stars (Feltzing et al. 2001; Nordström et al. 2004). None of these papers question the predictions of the chemical evolution theory concerning the enrichment of the ISM. The discrepancy between theory and data is usually interpreted as a result of an inefficient mix of the stellar ejecta into the surrounding medium, in spite of the growing evidence that the present dispersion in the ISM over distances of 1 kpc is very small (Scalo & Elmegreen, 2004). However, other authors have found a much tighter relationship between age and metallicity (see Rocha-Pinto et al. 2000).
A way out of this deadlock was recently proposed by Pont & Eyer (2004), who showed that the non-linear separation of the isochrones in the HR diagram can introduce a statistical bias in the isochrone age measurement, artificially assigning a greater isochrone age to the stars. Pont & Eyer (2004) showed that if a proper statistical method is used to correct for this bias, a tight AMR can be found from the same data used by some of the ‘loose’ AMR proponents. On the other hand, it is true that chromospheric ages also suffer from their own biases and cannot be considered perfect age estimators (Donahue, 1998; Pace & Paquini, 2004). Since much of the problem stems from the drawbacks of age determination methods, the existence of an AMR can be tested with the use of an age-related quantity that is independent of any age determination method. In this Letter, we show that the mean orbital radius of stars presently passing through the solar neighbourhood, , is mildly related to the stellar age and that it can provide this independent test of the existence of the AMR.
2 Sample selection and observations
Our sample consists of stars from the Hipparcos catalogue (ESA, 1997) that also have uvby indices measured by Olsen (1983, 1993, 1994) or compiled by Hauck & Mermilliod (1998) and which could be observed from the southern hemisphere. A heliocentric distance cut of 25 pc was used in order to have a sample of nearly 300 stars, so it would be possible to complete the programme within a few observation nights at a small telescope. Our final sample has 325 stars.
The observations were carried out at the Laboratório Nacional de Astrofísica, as part of a survey of the chemical abundances of late-type dwarfs, during 15 nights between July 1999 and October 2001. The coudé spectrograph of the 1.60m telescope was used with the 1800 l/mm grating and a 1024-pixel CCD, pixel size being 24. The spectra were centred at , covered about 150 , and had a nominal resolution of 0.3 , with an average S/N ratio of 100 to 200. All spectra were reduced in the standard way; continuum normalization was performed homogeneously for all spectra. The spectral range contains a number of moderately strong, unblended transitions: 2 for Na I, 3 for Si I, 3 for Ca I, 10 for Fe I, 2 for Fe II, 5 for Ni I, and one for Ba II. The equivalent widths (EWs) of the metal lines were converted to elemental abundances using the MARCS model atmospheres described by Edvardsson et al. (1993), in a differential analysis with the Sun as standard star. Solar values were derived by forcing EWs measured off Moon spectra, obtained in the same conditions as the stellar spectra, to reproduce the standard solar abundances. Effective temperatures for the program stars were derived from , and calibrations described by del Peloso et al. (2005). Surface gravities were obtained from the ionization equilibrium of the Fe I and Fe II lines. A full description of the abundance analysis will be presented elsewhere. The internal uncertainty of the [X/H] abundances is 0.1 dex, except for Ba II, which has more uncertain abundances, with only one spectral line measured.
Radial velocities () for most of the 325 observed stars were calculated from Th-Ar comparison spectra. For a few of them, comparison spectra could not be obtained, and their were taken from the SIMBAD database. We calculated the , , and components of the spatial velocity around the Galactic centre, from the , Hipparcos parallaxes and proper motions. Thereafter, the orbital parameters (mean orbital galactocentric radius, eccentricity, maximum height above the plane) for each star were calculated as described in Rocha-Pinto et al. (2004, hereafter, R04). In this paper, we have adopted the present solar Galactocentric radius, , as 8.0 kpc.
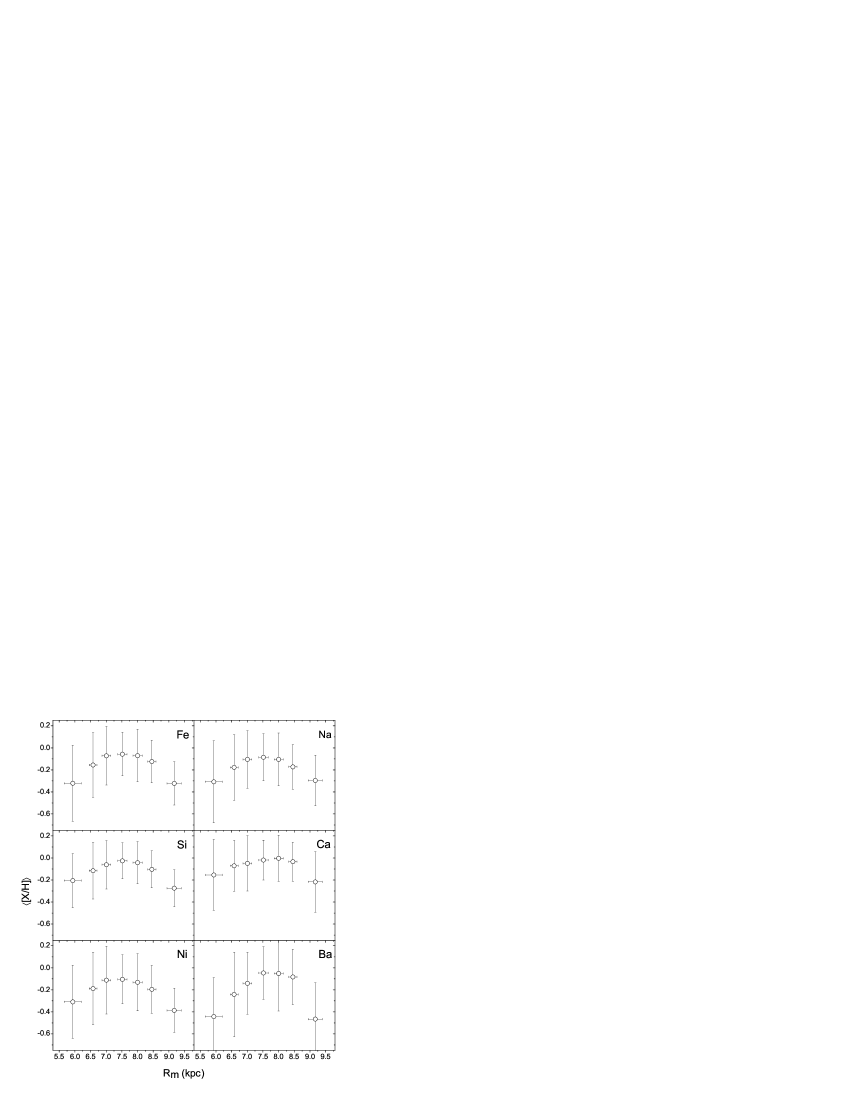
A full chemokinematical analysis of this data sample will be presented elsewhere, but here, we are interested in an apparent trend between and the stellar abundances. Figure 1 shows plots of average elemental abundance, [X/H], averaged over several bins, for Fe, Na, Si, Ca, Ni, and Ba. According to Grenon (1987) and Edvardsson et al. (1993), can be taken as an indicator of the stellar Galactocentric birth radius, . Wielen et al. (1996) have shown that this relation between age and can only be considered in a statistical sense. However, R04 found a correlation between the age and range for the stars presently crossing the solar neighbourhood: younger stellar generations have near , while the older generations have the broader distributions typical of stars coming from different parts of the Galaxy into the solar neighbourhood. This finding is consistent with Grenon’s proposition that stays more or less close to and reinforces previous claims that can be used to estimate .
In Fig. 1, we show that the average abundances for stars presently crossing the solar neighbourhood also differ as a function of . The stars with have near-solar , while stars supposedly born farther and farther from the solar neighbourhood (i.e., those with larger ) have progressively decreasing . This decrease can be as high as 0.3 dex for Fe and 0.4 dex for Ba, between and kpc.
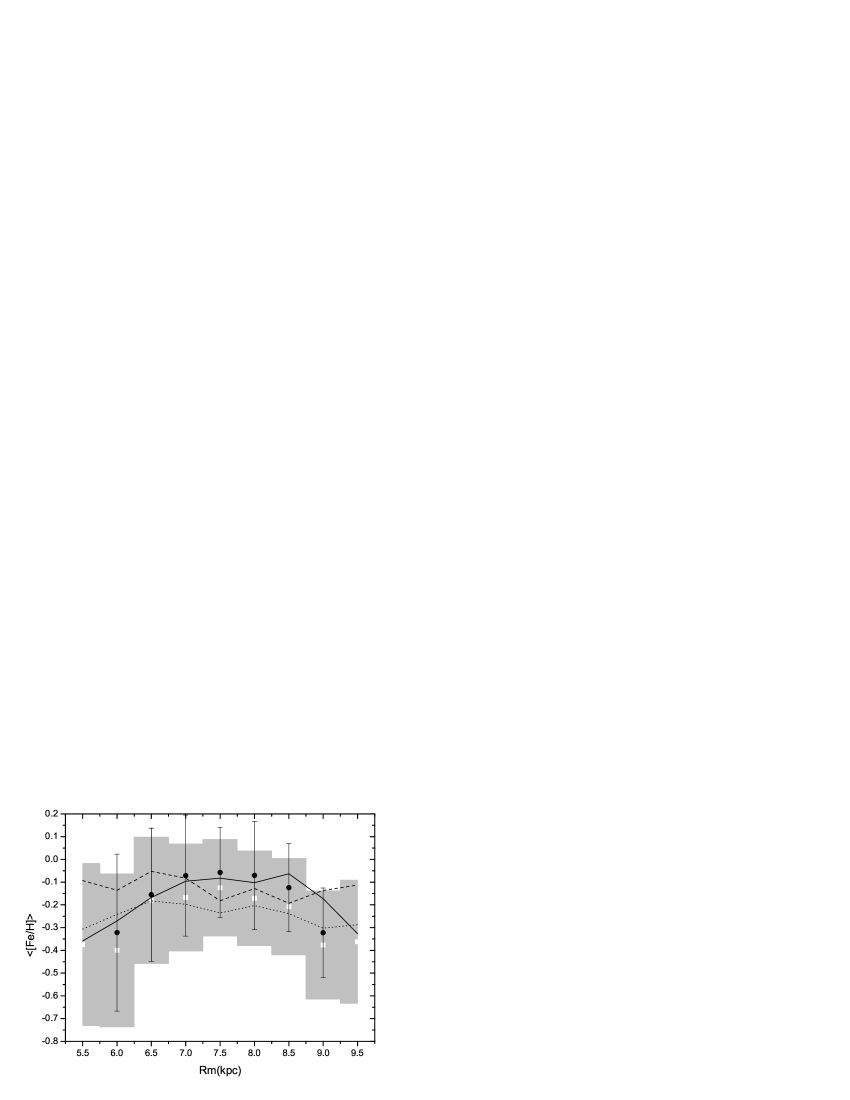
An anonymous referee has pointed out that the same trend can be seen in seen in Table 14 of Edvardsson et al. (1993); we have also found it for [Me/H] amongst late-type dwarfs from the Geneva-Copenhagen survey (see Fig. 2).
Disk stellar velocities peak near , the average rotational velocity at the stellar birth radius. Most of this motion goes in the azimuthal direction, not in the radial direction. Radial and vertical movement is mostly driven by the orbital diffusion (Wielen, 1977), on account of stellar encounters with massive objects like giant molecular clouds. As time goes on, the distance between the apogalactic and perigalactic radius increases due to the random kicks that stars get from collisions, and the chance the star could be caught at a different galactocentric distance from its birth radius increases as well. Thus, since can be seen as a stellar birth radius indicator, we expect that for our local sample reflects the time the star spent to come from to . In other words, can be taken as an independent age estimator. It has an obvious advantage of neither depending on stellar evolution models nor being based on chromospheric properties. However, like other kinematical age estimators, it does not allow us to assign ages for individual stars, but to a stellar group. This is easily seen from Figure 7 by R04: The larger the age spectrum, and consequently the age uncertainty, the smaller . Hence, while stars with have a wide age range, stars that came into the solar neighbourhood from other radii are, on average, older than the stars born near .
If this is the case, the relation between average abundance and seen in Fig. 1 reflects the existence of a relation between age and elemental abundances that is similar to the AMR; otherwise, if there were no AMR in the Galactic disk, as hinted by Feltzing et al. (2001), solar neighbourhood stars with large (old stars according to the reasoning presented in the previous paragraph) could have any abundance within the typical abundance range of disk stars, and their average would not be dissimilar to the average abundance of stars having .
3 Simulation of the –abundance plane
To test this hypothesis, we ran chemodynamical simulations of a stellar sample, using a reasonable Galactic model constrained by empirical data. Because we are interested in thin disk stars, we did not address the simulation of the thick disk or halo, although the effect of these Galactic components on the Galactic potential is taken into account.
The starting position of a simulated star in , , and coordinates with respect to the Galactic centre is randomly chosen following the thin disk density law of Siegel et al. (2002). The star formation rate was considered to be constant, and a randomly uniform age from 0 to 15 Gyr is assigned to each star. The simulated stellar metallicity follows the distribution
| (1) |
where represents the AMR at age , is the cosmic scatter, and the radial metallicity gradient at the galactocentric distance . Finally, the starting velocities , , and for each star, in the radial, azimuthal, and vertical direction, respectively, with respect to the Galactic centre, were sampled from a normal distribution , where and , i.e., the rotation velocity at , taken from Law et al. (2005). We took km/s from R04.
The orbit of each star was then followed from its birth — given by the randomly assigned age — to the present time, using a program developed by Chris Flynn (details in R04). To simulate stellar encounters with massive objects, a random push in each velocity component was given at each integration step. The magnitude of the push in each velocity component was set by requiring that the increase in the velocity dispersion with age of the stellar group for the simulated stars in the solar vicinity fitted the observed age–velocity dispersion relation (given by R04). After integrating the orbit, stars whose present-time galactocentric radius differed by less than 0.5 kpc from were selected as “solar neighbourhood” stars. It is from this simulated subsample of stars passing through the solar neighbourhood that we take the predicted –abundance relation to compare with the results from Fig. 1.
Since our goal was simply to show that the observed trend in the –abundance plane is determined by the existence of a well-defined AMR, we used three single parametrizations for the AMR: i) pure scatter relation, for which no change in the average metallicity or abundance scatter occurs with time; ii) a loose AMR, corresponding to a polinomial fit to the data in Edvardsson et al. (1993); iii) a relatively tight relation according to which the average metallicity of younger stars is higher than that for older stars. The adopted parametrizations for these two cases are given in Table 1.
| function | parametrization |
|---|---|
| no AMR | ; |
| loose AMR | |
| tight AMR | |
| single-slope [Fe/H] | 0.07 dex kpc |
| two-slope [Fe/H] | 0.05 dex kpc |
| 0.03 dex kpc |
Our simulations consider an initial number of 6000 stars, in order to have nearly 300 stars within 0.5 kpc from at the end of the integration to compare with the observational sample. Fig. 2 summarises our simulations of the –abundance plane. Three curves are shown, which correspond to the – trend found using the tight AMR, loose AMR, and no–AMR case, each with the two-slope metallicity gradient given in Table 1. Clearly the no–AMR simulation failed to produce the arc-shaped – trend seen in the observational data. This failure is not difficult to understand, because if there is no AMR in the Galactic disk, there is no relation between how much time a star takes to come from to and its metallicity. The – trend for this case is close to the adopted average metallicity for this parametrization ([Fe/H] dex). The trend also decreases very slowly with on account of the adopted .
The solid curve in Fig. 2 is very similar to the observed trend. It is the resulting – trend for the case of a tight AMR with very small intrinsic metallicity dispersion. We have made no attempt to find a best-fit curve, since the goal of the simulations is to show that the observational trend between and [Fe/H] can be explained with reasonable assumptions for the disk parameters, provided that there is a tight AMR. Several other parametrizations for the AMR and metallicity gradient were used, in order to verify the effect of the parametrization on the – trend. We verified that the shape of the resulting curve is most sensitive to the overall metallicity growth from the beginning of the Galactic disk to the present time, as well as to . A lower overall metallicity growth and/or larger flatten the simulated – relation, making it look closer to the no–AMR case. On the other hand, the effect of is more pronounced on the tails of the – curve. We verified that a two-slope metallicity gradient (Maciel et al., 2006) yields a better eye-ball fit to the observed trend than a single-slope gradient. However, the effect is small and should be investigated more before any conclusions can be made.
Our simulations have only considered the – trend because there is much more information available in the literature for the observed relations between [Fe/H], , and . However, the same exercise could be done for Ca, Na, Si, Ni, and Ba, as long as their abundances with respect to H have grown since the beginning of the Galactic disk and the intrinsic cosmic scatter at any age was low. It is interesting to verify in Fig. 1 that the biggest difference in the abundance at and large is found for Ba. Barium is thought to present a larger overall growth with age than iron (Edvardsson et al., 1993), since the bulk of its nuclesynthesis is due to long-lived AGB stars, which make their presence felt in the chemical evolution of the Galaxy with a lag with respect to iron sources. From our simulations, a larger growth in abundance with age increases the arc-like shape of the – relation, on account of the difference in abundance from the older stars with larger to the average abundance stars with . It is also interesting to note that Ca and Si (and perhaps also Na) seem to have the flatter profiles with in Fig. 1. That they are -elements, almost exclusively products of type II supernovae, could account for this, since a less well-defined age–abundance relation is expected in this case.
4 Conclusions
Spectroscopic abundances for 6 elements in 325 stars show that, on average, solar neighbourhood stars with large have lower abundances, regardless of the chemical element considered. This relation is interpreted as evidence of a well-defined age–abundance relation, since stars with large would mainly be old. A number of simulations of the orbits of disk stars born with chemokinematical properties that are reasonable for the Galactic disk confirm this interpretation.
The constraint provided by our data on the tightness of the AMR is relatively strong. Figure 2 shows that a loose AMR, with dex, is still compatible with an arc-shaped –, albeit much less pronounced than what is observed.
Our method highlights the possibility of studying the AMR and its dispersion through a technique that does not depend on age determination drawbacks. This could be achieved through a larger stellar sample and accurate (preferably, spectroscopic) abundances in order to better define the empirical – relation.
Acknowledgements.
We thank the suggestions by an anonymous referee that substantially improved this Letter. The authors acknowledge financial support by FAPERJ, FAPESP, CNPq, PRONEX/FINEP, FUJB/UFRJ, and PIBIC/UFRJ. This research made use of the SIMBAD database, operated by the CDS, Strasbourg, France.References
- del Peloso et al. (2005) del Peloso, E. F., da Silva, L. & Porto de Mello, G. F. 2005, A&A, 434, 275
- Donahue (1998) Donahue R.A. 1998, in Stellar Systems and the Sun, Donahue R.A. and Bookbinder J.A., eds., ASP Conf. Ser. 154, 1235
- Edvardsson et al. (1993) Edvardsson, B., Anderson, J., Gustafsson, B., Lambert, D. L., Nissen, P. E., & Tomkin, J. 1993, A&A, 275, 101
- ESA (1997) ESA 1997, The Hipparcos and Tycho Catalogues, ESA SP-1200
- Feltzing et al. (2001) Feltzing, S., Holmberg, J., & Hurley, J. R. 2001, A&A, 377, 911
- Grenon (1987) Grenon, M. 1987, JA&A, 123
- Hauck & Mermilliod (1998) Hauck, B., & Mermilliod, M., 1998, A&AS, 129, 431
- Law et al. (2005) Law, D. R., Johnston, K. V., & Majewski, S. R. 2005, ApJ, 619, 807
- Maciel et al. (2006) Maciel, W. J., Lago, L. G., & Costa, R. D. D. 2006, A&A, in press (astro-ph/0603419)
- Nordström et al. (2004) Nordström, B., Mayor, M., Andersen, J., Holmberg, J., Pont, F., Jørgensen, B. R., Olsen, E. H., Udry, S., & Mowlavi, N. 2004, A&A, 418, 989
- Olsen (1983) Olsen, E. H. 1983, A&AS, 54, 55
- Olsen (1993) Olsen, E. H. 1993, A&AS, 102, 89
- Olsen (1994) Olsen, E. H. 1994, A&AS, 104, 429
- Pace & Paquini (2004) Pace, G., & Pasquini, L. 2004, A&A, 426, 1021
- Pont & Eyer (2004) Pont, F., & Eyer, L. 2004, MNRAS, 351, 487
- Rocha-Pinto et al. (2000) Rocha-Pinto, H. J., Maciel, W. J., Scalo, J., & Flynn, C. 2000, A&A, 358, 850
- Rocha-Pinto et al. (2004) Rocha-Pinto, H. J., Flynn, C., Scalo, J., Hänninen, J., Maciel, W. J., & Hensler, G. 2004, A&A, 423, 517 (R04)
- Scalo & Elmegreen (2004) Scalo, J., & Elmegreen, B. G. 2004, ARA&A, 42, 275
- Siegel et al. (2002) Siegel M. H., Majewski, S. R., Reid, I. N., Thompson, I. B. 2002, ApJ, 578, 151
- Wielen (1977) Wielen, R. 1977, A&A, 60, 263
- Wielen et al. (1996) Wielen, R., Fuchs, B., & Dettbarn, C. 1996, A&A, 314, 438