Swift observations of GRB 050712
Abstract
We present the results of X-ray and optical observations of GRB 050712 performed by Swift. The X-ray lightcurve of this burst exhibits episodes of flares in the first 1000s, the same epoch at which the UVOT detected an optical counterpart. A shallow X-ray decay, with a decay slope of , followed and lasted 70 ks. This behavior can be explained in terms of activity of the GRB “inner engine”, with the possibility that the last flare is caused by the interaction of the ejecta with the surrounding medium.
We also find interesting spectral parameters for the X-ray emission. In particular, data suggests the presence of an intrinsic absorption in the first 1000s, which can be explained if circumburst medium clouds lie along the line of sight.
keywords:
Gamma-Ray Bursts; …1 INTRODUCTION
Follow-up observations of Gamma-Ray Bursts (GRBs) have shown that the initial prompt emission is followed by an afterglow, i.e. a fading X-ray, optical and radio source that can last up to several months after the -ray flash. According to the currently accepted theory, the afterglow arises when the burst ejecta interact with the surrounding medium and produce a shock, which propagates in the medium and heats the electrons. The latter, cooling down through synchrotron emission, produce the observed radiation. Studies of afterglows can thus provide invaluable information on the central engine of GRBs, on the circumburst medium and can possibly lead to the identification of different subclasses in the GRB population.
Until recently, most follow-up observations did not start until a few hours after the GRB, when the afterglow had already faded significantly. This situation has changed with the launch of the Swift mission, which provides both a rapid alert of GRB triggers to ground-based observers, and rapid (within min after the -ray trigger) X-ray and optical/UV follow-up observations of the burst afterglow. The temporal behavior of the GRB emission at this early epoch has been thus unveiled. Several interesting features have been discovered (see Zhang et al. 2006, Nousek et al. 2005, Burrows et al. 2005b, Roming et al. 2005 for detailed discussions): i) the typical behavior of the X-ray emission has been shown to consist of an initial steep decay, followed by a shallow one about 100-1000s after the trigger; ii) a second change of the decay slope usually occurs about 10 ks later; iii) in some cases, a further steepening of the slope, typical signature of collimated outflow, is observed 100-1000 ks after the trigger. Furthermore, in a few events the initial fast decay was unobserved, and in others X-ray flares have been detected, superimposed on this “template” time behavior (e.g. Burrows et al. 2005b). As for the optical emission, it has been observed that in many cases the optical/UV emission is much lower than expected (Roming et al. 2005), suggesting some cause of suppression of the flux in the optical band.
Even in past years, irregular temporal features have been occasionally seen in various bursts (see Zhang & Mészáros 2002b and references therein): just to mention some examples these include a rebrightening in GRB 970508, GRB 021004 and step-like features in GRB 030309. Other similar peculiarities have been observed in several cases (e.g. GRB 970228, GRB 980326, GRB 000203C). Various interpretations have been proposed, mainly in terms of ”refreshed shocks” (Panaitescu et al. 1998), supernova components (Bloom et al. 1999, Reichart 1999, Galama et al. 2000), dust echoes (Esin & Blandford 2002) or microlensing (Garnavich et al. 2000). On the other hand, signatures detected by Swift in the GRB lightcurve at earlier times may provide diagnostic about the nature of the injection and eventually probe whether the energy is released impulsively during the event or more continuously during the immediate post-burst epoch (see e.g. Zhang & Mészáros 2002b), eventually with different Lorentz factors of the ejecta (Panaitescu et al. 2005).
In this paper, we report the properties of the Swift GRB 050712, and discuss them in the context of the current models and scenarios of GRBs. In § 2, we describe the analysis of and X-ray data, while the analysis of UVOT data is shown in § 3. The possible interpretations are examined in § 4 and we finally summarize our conclusions in § 5.
2 Analysis of the -ray and X-ray data.
The Swift observatory (Gehrels et al. 2005) carries three science instruments: the Burst Alert Telescope (BAT; Barthelmy et al. 2005), which locates GRBs with 3’ accuracy, the narrow field X-ray telescope (XRT, Burrows et al. 2005a) and the Ultra-Violet Optical Telescope (UVOT, Roming et al. 2005). When BAT detects a GRB trigger, Swift slews towards the source position within a few tens of seconds.
GRB 050712 triggered the BAT instrument at 14:00:28 UT on July 12, 2005 (Grupe et al. 2005a). The refined BAT position is RA=, Dec= with a position uncertainty of 1.7’ (90% C.L., Markwardt et al 2005, Krimm 2005). The -ray band emission started 8s before the BAT trigger time and the lightcurve shows a very broad peak (see Figure 1), with a peak count rate of 500 counts/s (Grupe et al. 2005a).
From the analysis of the BAT data (15-350 keV energy band) we found that the GRB duration is ts. For the spectral analysis, we report results obtained in the 15-150 keV band, because the mask weighted technique has been used to subtract the background. Above 150 keV, the coded mask becomes transparent and the mask-weighting technique is no longer effective. A single powerlaw provides a satisfactory fit ( for 57 d.o.f.) of the BAT spectrum, with an energy index of (hereafter we shall assume the convention , where is the decay slope and is the spectral index; errors are reported at 1 confidence level, unless specified otherwise). The corresponding fluence is erg cm-2 s-1 (15-150 keV band).
XRT and UVOT observations started 160s and 164s after the trigger, respectively. Initially, the source was not bright enough for the XRT to perform an on-board centroid (Falcone et al. 2005a). Subsequent analysis showed the presence of an unknown X-ray source, with refined coordinates of R.A. = , Dec = 64∘ 54’ 48.2”, with a 6” radius error circle (90% confidence level). This position is within 62” of the initial BAT position (Grupe et al. 2005b). This source subsequently faded, indicating that it was the X-ray counterpart of GRB 050712. XRT data used in this paper were initially taken in Windowed Timing (WT) mode (Hill et al. 2005), and subsequently in Photon Counting (PC) mode.
The XRT data were reduced with the xrtpipeline software, version 0.9.9. Source and background photons of the WT mode data were selected by XSELECT version 2.3 in a box with a length of 34.5 pixels (=). The source photons of the PC mode data were selected in a circular region with a radius of r=47 and the background photons in a nearby circular region with a radius of r=96. For the spectral data events with grades 0-2 and 0-12 were selected for the WT and PC mode data, respectively. For the PC mode data of the first orbit, because of pileup, the inner 5 of the circle had to be discarded from the spectral analysis. The spectral data were re-binned by grppha 3.0.0 with 20 photons per bin. The spectra were analyzed using XSPEC version 12.2.1. The auxiliary response files were created with xrtmkarf and the standard response matrices swxwt0to2_20010101v007.rmf and swxpc0to12_20010101v007.rmf were used for the WT and the PC data respectively.
The background-subtracted X-ray light curve in the 0.3-10.0 keV energy range was constructed by using the ESO Munich Image Data Analysis Software MIDAS (version 04Sep). The binning was dynamically performed. At the beginning of the observations the binning was set to 50 photons per bin while at later times it was reduced to 10 photons per bin. A pileup correction for the PC mode data of the first orbit was applied as described in Nousek et al. (2005). Count rates were converted into fluxes by determining the Energy Conversion Factors for the PC and WT mode data as described by Nousek et al. (2005).
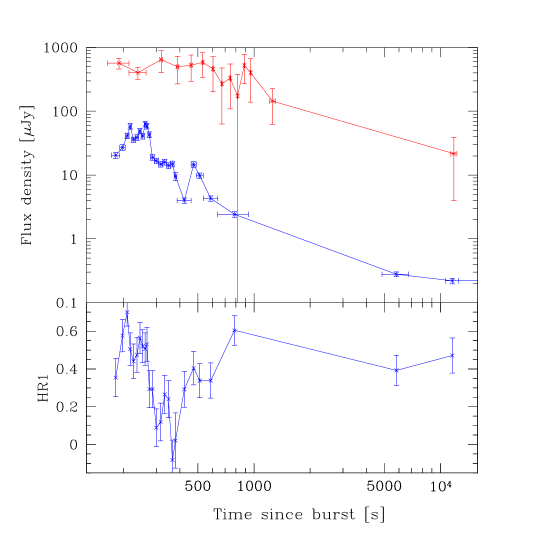
In order to search for spectral variability through out the observations we also derived the temporal behaviour of the hardness ratio. The hardness ratio has been calculated as HR = (H-S)/(H+S) where S and H are the number of counts in the 0.3-1.0 keV and 1.0-10.0 keV bands, respectively.
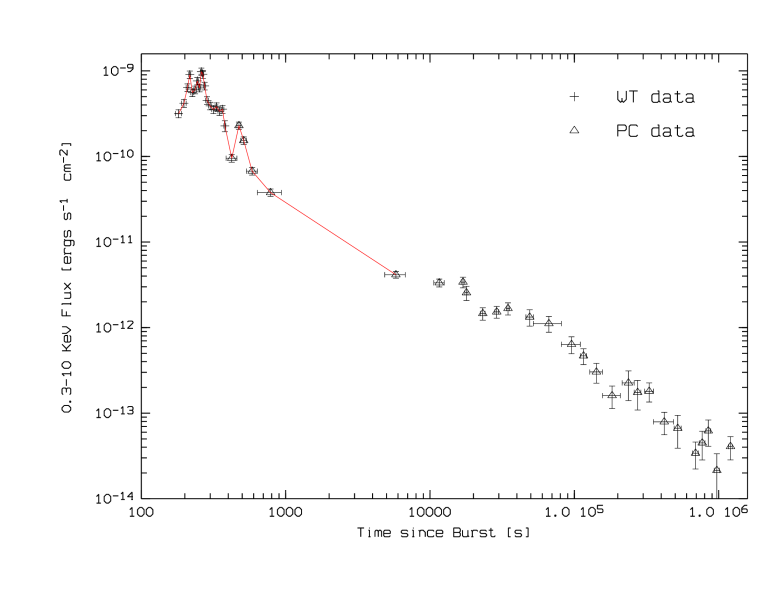
Figures 2 and 3 show the X-ray lightcurve in the 0.3-10 keV energy band. The presence of three flares is evident, about 210s, 240s and 480s after the BAT trigger. We also tested if the flares were visible in the late BAT data. A visual inspection of the lightcurve reported in Figure 1 shows no obvious flare at these epoch. Thus we looked at the data with a statistical approach. We set up a script to go through the phase space of energy bands and time intervals (from s to s) and made a set of 160 sky images, each of which we checked for flux at the source position. Out of the 160 trials we see 58 cases with a significance of , far more than we expect from statistics. The most significant single trial was in the interval 25-50 keV, s, at . However, if we look at the whole time interval and energy band ( s and 15-150 keV), the significance is only 2.0 sigma ( s in 25-50 keV gives ). Therefore, the evidence for this peak is larger in the soft band with respect to the total one. To make sure that there was no systematic bias, we did a similar test using a time interval before the burst and we found a distribution consistent with statistics.
Between the second and third flares, the lightcurve exhibits a plateau which lasts approximately for 50s, followed by a steep decline and then by a fast rise. After the third flare, which lasts for about 200s, there is a gap in the coverage due to the Swift orbit, thus we cannot constrain the behaviour of the X-ray lightcurve during this interval. However, an extrapolation of the later X-ray lightcurve backward reconnects to the late points of the flare, showing a shallow decline after s and a possible break at later times, i.e. around 70 ks after the trigger (see further).
We note that the 0.3-10 keV fluence in the first 1000s (i.e. in the interval including the three flares) is erg cm-2, i.e. of the fluence detected in the 15-150 keV band during the prompt emission phase.
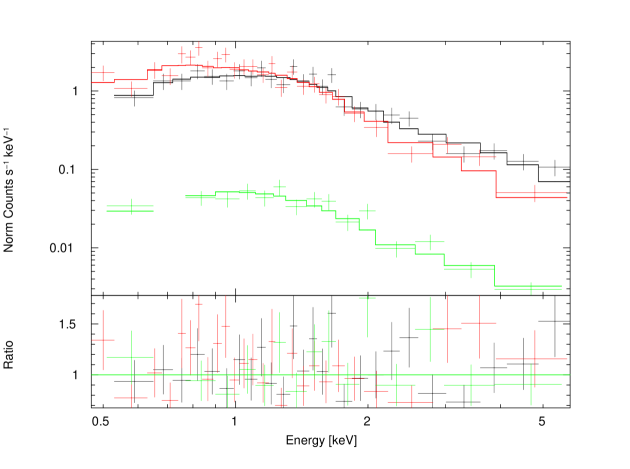
We fitted the X-ray spectra taken at different time intervals with an absorbed powerlaw. Best fit values of column density and energy spectral index are summarized in Table 1, while Fig.3 shows the evolution of the hardness ratio. Spectra taken before, during and after the flares are shown in Fig. 4. As we can see, the X-ray data indicate a clear spectral evolution throughout the first 1000s, with a change in the spectral index. In particular, after the first 200-300s the spectrum starts softening monotonically, while, after the second peak, it changes abruptly and the energy index increases up to a value consistent with that observed in the late phases of the afterglow.
3 Optical observations by UVOT in the UV/optical.
Swift UVOT detected the optical counterpart of GRB 050712 in the V band, 200s after the BAT trigger (Rol et al. 2005). The source was fading away, but has been positively detected by Swift UVOT until 15000s after the trigger. The log of optical observations is reported in Table 2.
The analysis of the Swift UVOT optical images was performed by
correcting for attitude drifts with an in-house software and summing
up all the exposures in the indicated time interval with
uvotimsum, part of Swift software version
2.0111http://swift.gsfc.nasa.gov/docs/swift/analysis .
Source counts were extracted in a circular region of 3” radius,
while the background was extracted in a circular region of 20”
radius. In both cases, the
packages222http://heasarc.gsfc.nasa.gov/docs/software
DS9 version 4.0 and Ximage version 4.3.1 was used
to create the region files and extract counts, respectively. Counts
were converted in magnitudes by using the latest CALDB zero-points,
swuphot20041120v102.fits333http://swift.gsfc.nasa.gov/docs/heasarc/caldb/data/swift/uvota.
UVOT magnitudes can be equated to the Johnson standard.
The V band lightcurve is shown in Fig. 3. A positive detection has also been obtained in the U band by UVOT (see Table 2 for values). This allows us to put an upper limit on the redshift of GRB 050712. For redshift , the intervening extragalactic hydrogen would produce a U-V colour index of (Lamb 2003, Lamb & Reichart 2000, Zuo & Lu 1993) and we would not expect an optical detection in the U band at all for redshift larger than this value. Rather, our data suggest that magnitudes in the V and U band are equal within errors. We can therefore take as upper limit for the redshift of GRB050712.
4 Discussion.
4.1 X-ray flares.
As discussed in § 2, the X-ray lightcurve of GRB 050712 exhibits at least three flares, at about 210s, 240s and 480s after the BAT trigger. These features have been observed with Swift in several other GRBs (see Burrows et al. 2005b, Falcone et al. 2005b, Romano et al. 2005, Zhang et al. 2006) and seem to be characteristic of the X-ray emission detected at early times.
In principle, the occurrence of flares can be associated with several mechanism such as: reverse shock propagation, presence of high density clouds surrounding the progenitor, or GRB emission collimated in a multicomponent outflow with variable amount of energy per solid angle, as in models involving “structured jets” or “patchy shells” (Berger et al. 2003, Huang et al. 2004, Kumar & Piran 2000).
However, the majority of these models, which ultimately account for different ways in which the ejecta interact with the circumbust medium, cannot account for the rapid onset and decline of the X-ray flare observed in several GRBs by Swift (Zhang et al. 2006). An alternative scenario for these features is that the “inner engine” of the GRBs does not switch off at the end of the main high-energy event but it still emits shells, which continue to collide and produce radiation. Following Zhang & Mészáros (2002a), in this case the peak energy of the flare emission, , scales as:
| (1) |
where is the luminosity, is the Lorentz factor and is the variability time scale of the flare. The observed X-ray peaks have luminosity lower than that of the main event, and their fluctuations take place on a large time scale. Also, it is expected that the environment tends to be cleaner so that may be larger. Therefore, late “internal shocks” can give rise to (X-ray) bursts which are softer as compared with the prompt (-ray) emission. The high Lorentz factor of the shells naturally explains fast variations of the flux, in terms of a pure propagation effect. Let us assume that the shells, moving at a dimensionless velocity , emit a photon at the time at a certain distance from the centre of the explosion and a second photon at the time and position ). The time is measured in the Earth observer’s reference frame, and the distance between this observer and the shell location is D. This first photon arrives at the observer at the time , while the second one arrives at a time where . In turn, the interval for the observer to receive the two photons is much reduced, i.e. .
In the case at hand, the 2nd flare flux (extrapolated in the 0.3-150 keV band) is erg/s/cm2, the Lorentz Factor should be as high as (see Zhang et al. 2006 and reference therein) and the time scale of variation is s. The corresponding quantities during the prompt emission are erg/s/cm2, and 10s. For such values, equation 1 predict a peak energy a factor lower than that in the prompt phase. A good measurement of the peak energy of the prompt emission of this burst is unavailable, but if we assume a standard value of keV (Preece et al. 2000), we can infer that the peak energy of the 2nd flare must be at keV, i.e. in the XRT band.
During the decay of flares produced by late “internal shocks”, the relationship between the spectral and decay indices is given by (Kumar & Piran 2000):
| (2) |
provided that the decay slope is computed by re-setting the time-zero point t0 at the time of the peak (see Zhang et al. 2006 and references therein). We note that several Swift bursts exhibit a rapid decay during the early phase of the observed X-ray emission (first hundreds of seconds after the trigger), with spectral slope and decays slope respectively, in agreement with the predictions of eq. 2.
In the case of GRB 050712, we found that the X-ray spectral
evolution of the emission in the first 400s is in general agreement
with this “late internal shocks” scenario. During this phase the
X-ray spectrum of GRB 050712 softens, with the energy index
decreasing from -1.1 to -1.7. This is reminiscent of the behavior of
the prompt emission. For comparison, the spectral index of the low
energy part of the -ray emission detected by BAT is around
-0.5. Assuming that the first two flares have a similar
s, we get and
for their decay slopes. We also have (see
Tab. 1) for the spectral index of the first and second
peak. So our results are in agreement with eq. 2. Also, we
may speculate that the decay phase observed around 400s after
the trigger might follow a further release of energy which is not
observed as a “flare” since it is superimposed on that of the
first peak. In this case, it would be difficult to fix
properly. However, we find that taking s gives a decay
slope of , which again satisfies eq. 2
(since during this phase the spectral index is the
same as before, i.e. ).
However, the situation may differ as far as the third X-ray flare, observed at s, is concerned. First, if this peak were due to a further internal shock occurring in the fireball, then it would be followed by a fast decay. The rise of this peak is clearly visible at s after the trigger. Assuming this value for gives a decay slope of which, combined with an energy spectral index of , does not satisfy eq. 2. The situation does not improve by choosing slightly different values of . Second, the spectrum of the second peak differs () from that of the previous phase, which could suggest a different origin, while it is much more in agreement with that observed during the late phases of the X-ray afterglow. Late internal shocks might still be responsible for the second flare if, for instance, the emission does not stop suddenly after this peak and other weak flares are released superimposing on the decaying part. In this case, the decay would be shallower than that predicted by eq. 2. Moreover, collisions of different shells may well produce emission with diverse spectral properties, and the rapid increase of flux in the second flare, by a factor of within s, supports the internal shock scenario.
It should be noticed that the behaviour of GRB 050712 X-ray afterglow is rather uncommon. Flare spectra usually soften until they reach the relatively soft afterglow. In this case, the first flare is quite soft, but then the spectrum hardens at later times. However, the spectrum of the last flare is similar to that of the late afterglow, which is hard as compared with other afterglows of other Gamma-Ray Bursts.
An alternative possibility is that with the third flare we witness the onset of the standard afterglow, i.e. the creation of an “external shock” when the fireball runs into the circumburst medium. The standard afterglow model predicts that, as a shell of ejecta interacts with the circumburst medium, it gives rise to a “forward shock”, which propagates outward, and to a “reverse shock”, which moves inward through the ejecta (1997). During this phase, the observable characteristics depend on the dynamical conditions of the fireball.
Two regimes can be identified depending on the “thickness” of the fireball (Sari & Piran 1999, hereafter SP99). The difference between the two cases is whether a reverse shock becomes relativistic in the frame of unshocked material during its crossing of the shell. If this happens, the shell is defined as “thick”. Otherwise, the shell is defined as “thin”. In the case of a thin shell, SP99 have shown that the evolution of the afterglow is well described by a powerlaw decay if the time is measured starting from the explosion time, which is a good approximation of the time at which the first photons are collected. The situation differs if the shell is “thick”, i.e. if
| (3) |
where is the initial thickness of the shell in the observer frame, and are its initial Lorentz factor and kinetic energy, is the number of particles of the circumburst medium per unit volume, and is the proton mass. If we assume typical parameters of E erg, n =10 cm-3 (see Berger et al. 2003) and consider that , where T is the burst duration, we need to have , which is easy to satisfy (see, however, Zhang & Mészáros 2004). Most of the energy is released into the surrounding material only when the shell has been crossed by the reverse shock. Following again SP99 (see also Piro et al. 2005), this happens after a time , roughly similar to the burst duration. Only from the time onward, the deceleration of the shell scales as , in a self-similar manner, and the afterglow decay can be fitted by a power law (or broken power law) model.
Quite interestingly, we find that this might the case of GRB 050712. By rescaling the zero-time to s (i.e. to the onset of the third peak) we find that a broken powerlaw model provides an acceptable fit of the lightcurve at , with for 23 degrees of freedom (see Fig. 5), which is acceptable at C.L. The best fit parameters are , for the two decay slopes before and after the break, and ts. The presence of a break is statistically significant since a fit with a single powerlaw gives for 25 d.o.f.
The comparison between the optical and X-ray lightcurve is also illuminating. First of all, in the optical we do not see the strong variability that is present in the X-ray lightcurve. We have tried to fit the UVOT V datapoints with a rescaled X-ray lightcurve in the first 10000s, and we have obtained a for 13 d.o.f. Therefore, the probability that the 2 lightcurves are consistent is only . The major differences in the two lightcurves arise from the first part. In the V band lightcurve we see no increase correspondent to the first and second X-ray flares, no decrease at the time of the steep decay at s, and again no increase at the time of the rise of the third flare. Rather, the optical lightcurve in the first 500s is fully compatible with being constant: a fit with a constant gives . This suggests that the origin of the optical emission is different from that of the X-ray. A possible origin for the optical emission would be “reverse shocks” crossing the ejecta inwards, as already suggested in the case of GRB990123 and GRB021211 Zhang & Mészáros (2004). Reverse shocks are mild-relativistic, so their emission is not expected to be associated with very fast fluctuations of the radiation, as in case of internal shocks. After it reaches the peak, reverse shock emission is usually expected to fade away with a powelaw decay , and it has been shown by several authors (see Zhang & Kobayashi 2005, Zhang et al. 2003, Kobayashi et al. 2000) that, if ejecta are magnetized and the optical band is below the synchrotron cooling frequency, the peak itself may be broad and the slope more gentle, . Furthermore, the emission from the reverse shock may well overlap that of the forward shock component after the forward shock peak time (GRB 021211 may be a marginal such case, see Zhang et al. 2003 ). In the case at hand, we see a decrease in the optical starting 500s after the trigger, roughly after the peak in the X-ray. The optical-to-X energy index fluctuates until 500s after the trigger, when it stabilizes at , remaining consistent with this value for the rest of the afterglow. These clues suggest that reverse shocks may be responsable for the flat emission registered in the first few hundreds seconds, while, from 500s onwards, the optical and X-ray emission are produced by the same mechanism, possibly due to the forward shock as previously discussed.
4.2 The X-ray afterglow
Regardless of the interpretation of the third flare, after the second orbits (i.e. 5000s after the trigger) Swift observed the X-ray afterglow of GRB050712 and detected a break in the decay slope. We find that the values of two decay indices as well as the break time are weakly dependent on the exact start of the afterglow.
The initial shallow decay () and the break could be explained either by a late, continuous energy injection from the inner engine (Zhang & Mészáros 2001, Zhang & Mészáros 2002b), or, alternatively, by a model in which the central engine activity is as brief as the prompt emission itself but, at the end of the prompt phase, the ejecta are released with different Lorentz factors (Panaitescu et al. 2005). The two scenarios are observationally indistinguishable, although the second one reconciles better with the scenario of the onset of the afterglow at the third peak, as we shall see in the following.
In the first case, a source luminosity law of the kind is assumed, where t is the intrinsic time of the central engine (or the observer’s time after the cosmological time dilation correction). Following (Zhang & Mészáros 2001, Zhang & Mészáros 2002b), the spectral and decay slopes are linked through the relation
| (4) |
For the values of the indices we have before the break, we obtain . After the break, we get . In the continuous energy injection scenario, the former case indicates that the central engine produces a substantial amount of energy, which affects the fireball evolution. Instead, for , the energy which is added is small compared to the energy already injected and it does not affect the fireball evolution effectively.
In the second scenario, the fastest shells initiate the forward shock, decelerate, and are successively caught by the slowest shells. The consequent addition of energy in the blast-wave mitigates the deceleration and the afterglow decay rate. Assuming that the mass of the ejecta follows the law
| (5) |
where is the Lorentz factor, the spectral and decay slope must be linked through the relationship (Zhang et al. 2006):
| (6) |
The degeneracy of the two models consists in the fact that a
non-vanishing index mimics the same effect of non-vanishing
index, although the physical mechanisms involved are different.
From the values of reported above, we obtain before the break
and after the break.
Before the break time, the fast shells
are decelerated initially with the slow shells lag behind ballistically
and, when the fast ones are delerated enough, they are catch up by the
slow shells. It is such pile up that gives an efficient conversion of
energy:
a steep distribution of the shells is required
in order to have a significant energy injection into the blast wave,
with more energy carried by slow shells. On the other hand, if the Lorentz
factor distribution is flatter than , the injected energy is
much smaller than that already present in the blastwave, so that the
fireball dynamics is unaffected, and the afterglow enters the ”normal
decay” phase.
4.3 Absorption by the circumburst medium.
There is a general, growing, evidence for the association of long GRBs with the death of ultramassive stars (Galama et al. 2000, Stanek et al. 2003, Hjorth et al. 2003, Zeh et al. 2004). Since these objects have a short lifetime ( yrs), it is expected that GRB explosions take place close to or inside the original star forming regions, where a dense circumburst medium is present. Thus, high level of absorption are expected, and this is consistent with the observations in () of Swift bursts (Campana et al. 2005, Grupe et al. 2005c, O’Brien et al. 2005).
In order to verify the presence of an extragalactic absorber, we have first fitted the X-ray data with an absorbed power law model, by keeping the absorption fixed at the Galactic value of cm-2 (Dickey & Lockmann 1990). This gives , , for the WT data taken during the first and second flare, the WT data taken after the second flare, and the PC data taken during the third flare, respectively. Later data have not been included in this analysis, because their statistics is quite poor. We then repeated the fit by adding an extra absorption component, and fixing the redshift at . We obtain , and , for the same three segments. We have calculated the probability of a chance improvement by means of the F-test (see, however, Protassov et al. 2002). We get , and . Very similar results have been obtained by varying the redshift from z=0.5 to z=2. Results of the fits have been reported in Table 1. Therefore, data gives a marginal indication for some intrinsic absorption for GRB 050712, at least in the first interval. Assuming a putative redshift , the value of the excess column density would be cm-2, cm-2 and cm-2: there could be some indication of a decreasing column density, although all these values are also consistent with cm-2.
5 Conclusions.
We presented Swift observations of the GRB 050712 and we
discussed the properties of its optical and X-ray afterglows. The
X-ray light curve of this burst does not decay immediately
after the high energy event, but it shows two episodes of flares in
the first s. We find that the first and second flare is
likely to be explained in terms of late internal shock emission.
However, this might be not the case for the third flare.
The different interpretation is based on the fact that during the
second rise of the X-ray flux, the XRT spectrum is
different from that detected during the previous phases, and more
similar to that observed at the late afterglow epochs. Furthermore,
the flux of the “flare” can be connected with the
late afterglow lightcurve with a broken powerlaw model, if the zero
time is rescaled to the time of the onset of the peak. This is what
is expected if the ejecta have been crossed by the reverse
shocks, roughly at a time similar to that of the burst duration,
and the onset of the external shock follows. Moreover,
after the epoch of the third flare we observe a
steepening of the optical-to-X-ray spectral index, . This
would suggest an increase in the optical emission,
perhaps due to the contribution of the starting forward shock
running in the circumburst medium. takes the value that
will have for the remaining afterglow from this epoch. Although an
internal shock interpretation can not be completely ruled out, all
these findings may also suggest that the last “peak” represent the
beginning of the standard afterglow phase.
The spectral fit also suggests some hints of intrisic absorption, at
least in the first s. Assuming z=1, the value would be
cm-1, which is in the range of values for
dense giant molecular clouds. If real, this finding is consistent
with the idea of massive progenitors for GRBs. We cannot firmly
establish whether or not the column density decreases at later times
(e.g. by progressive ionization); we only note that, if the
intrinsic absorption is not changing, it implies that the absorbing
medium should be not very close to the place where the GRB took
place (Lazzati & Perna 2002).
The fit presented in Fig. 5 shows that, up to ks, the observed decay slope is rather shallow, with a slope . This might be explained if a residual, continuous energy injection from the inner engine lasted at late times, with a luminosity law . A different explanation, that does not require a late-time reactivation of the central engine, is that ejecta are released with different Lorentz factor according to the distribution (Zhang et al. 2006, Panaitescu et al. 2005). The decay slope observed after the break, is instead close to the standard decay slope observed in X-ray afterglows day after the -ray event (De Pasquale et al. 2005, Gendre et al. 2005, Nousek et al. 2005, Zhang et al. 2006).
The constraint to the redshift () enables us to set an upper
limit on the energy emitted in -ray and X-rays by
GRB 050712. If we assume (which is the upper limit),
and a spectral shape with low energy spectral index -0.5, typical
break energy of keV and high energy slope = -1.5, the
k-corrected 1-10000 keV energy emitted by GRB 050712 is
erg.
Acknowledgements. We are grateful to an anonymous referee for his/fer suggestions that led to a substantial improvement of the draft. SZ also thanks PPARC for support through an Advanced Fellowship.
References
- Barthelmy et al. (2005) Barthelmy S.D. et al. 2005, ApJ, 559, 710
- Berger et al. (2003) Berger E. et al., 2003, Nature, 426, 154
- Bloom et al. (1999) Bloom J.S. et al., 1999, Nature, 401, 453
- Burrows et al. (2005a) Burrows D.N. et al., 2005a, Space Science Review, in press
- Burrows et al. (2005b) Burrows D.N., Romano P., Godet O. et al., 2005b, X-ray Universe 2005 proceedings, astro-ph 0511039
- Campana et al. (2005) Campana S. et al. 2005, A&A, submitted
- De Pasquale et al. (2005) De Pasquale M., Piro L. et al., 2005, A&A submitted (astro-ph 0507708)
- Dickey & Lockman (1990) Dickey J.M. & Lockman F.J. 1990, ARAA, 28, 215
- Esin & Blandford (2002) Esin, A.A. & Blandford, R., 2000, ApJL, 534, L51
- Falcone et al. (2005a) Falcone A. et al. 2005a, GCN 3573
- Falcone et al. (2005b) Falcone A. et al. 2005a, ApJ submitted.
- Frontera (2004) Frontera F., Amati L., Lazzati D. et al., 2004, ApJ, 614, 301
- Galama et al. (2000) Galama, T.J., et al., 2000, ApJ, 536, 185
- Garnavich et al. (2000) Garnavich, P., Loeb, A. & Stanek, K., 2000, ApJL, 544, L11
- Gehrels et al. (2005) Gehrels N. et al., 2005, ApJ, 621, 558
- Gendre et al. (2005) Gendre B. et al., 2005, A&A submitted (astro-ph/0507710)
- Grupe et al. (2005a) Grupe D. et al., 2005a, GCN 3573
- Grupe et al. (2005b) Grupe D. et al., 2005b, GCN 3579
- Grupe et al. (2005c) Grupe D. et al., 2005c, to be submitted to ApJL
- Guidorzi et al. (2003) Guidorzi C., Frontera F., Montanari E. et al. 2003, ApJ, 401, 491
- Hill et al. (2005) Hill J.E. et al., 2005, in preparation
- Hjorth et al. (2003) Hjorth J., Sollerman, J., Møller, P., et al. 2003, Nature, 423, 847
- Huang et al. (2004) Huang Y.F., Wu X.F., Dai Z. G., et al., 2004, ApJ, 605, 300
- Kumar & Piran (2000) Kumar P. & Piran A., 2000, ApJ, 541, L9
- Kumar & Panaitescu (2000) Zhang B. & Panaitescu P., 2000, ApJ, 541, L51
- Krimm (2005) Krimm H.A. 2005, private communication
- Lamb (2003) Lamb D.Q., 2003, proc. ”Gamma-Ray Burst and Afterglow Astronomy 2001” Woods Hole, Massachusetts Journal-ref: AIP Conf.Proc. 662, 433, astro-ph/0210434
- Lamb & Reichart (2000) Lamb D.Q. & Reichart D.E., 2000, ApJ, 536, 1L
- Lazzati & Perna (2002) Lazzati D. & Perna R., 2002, MNRAS, 330, 383.
- Markwardt et al (2005) Markwardt G. et al., 2005, GCN 3576
- Maiorano et al. (2005) Maiorano E. et al., 2005, GCN 3601
- (32) Mészáros P. & Rees M.J. 1997, ApJ, 476, 232
- Nousek et al. (2005) Nousek J. et al., to be submitted to ApJ(astro-ph 0508332)
- O’Brien et al. (2005) O’ Brien P. et al., 2005, ApJsubmitted, (astro-ph/0601125)
- Panaitescu et al. (1998) Panaitescu A., Mészáros, P. & Rees, M.J. 1998, ApJ, 503, 314
- Panaitescu et al. (2005) Panaitescu A. et al. 2005, MNRAS submitted (astro-ph/0508340)
- Preece et al. (2000) Preece R. D. et al., 2000, ApJ Suppl., 126, 19
- Piro et al. (2005) Piro L., De Pasquale M., Soffitta P. et al., 2005, ApJ, 623, 314
- Protassov et al. (2002) Protassov R., van Dyk D.A, Connors A. et al. 2002, ApJ, 571, 545
- Reichart (1999) Reichart E., 1999, ApJL, 521, L111
- Rol et al. (2005) Rol E. et al. 2005, GCN 3575
- Romano et al. (2005) Romano et al., 2005, in preparation
- Roming et al. (2005) Roming P. et al., 2005, Space Science Review in press
- Sari & Piran (1999) Sari R. & Piran T., 1999, ApJL, 519, 17 (SP99)
- Stanek et al. (2003) Stanek, K.Z., Matheson, T., Garnavich, P. M., et al., 2003, ApJ, 591, L17
- Zeh et al. (2005) Zeh A., Klose S. & Hartmann D.H., 2004, ApJ, 609, 952
- Zeh et al. (2005) Zeh A. et al., 2005, GCN 3646
- Zhang & Mészáros (2001) Zhang B. & Mészáros P., 2001, ApJ, 552L, 35
- Zhang & Mészáros (2002a) Zhang B. & Mészáros P., 2002a, ApJ, 581, 1236
- Zhang & Mészáros (2002b) Zhang B. & Mészáros P., 2002b, ApJ, 566, 712
- Zhang et al. (2003) Zhang B., Kobayashi S. & Mészáros 2003, ApJ, 595, 950
- Zhang & Mészáros (2004) Zhang B. & Mészáros P., 2004, IJMPA, 19, 2385 (astro-ph 03111321)
- Zhang et al. (2006) Zhang B. Fan Y.Z., Dyks J. et al 2006, ApJsubmitted (astro-ph 0508321)
- Zuo & Lu (1993) Zuo L. & Lu L., 1993, ApJ418, 601
| Section(s after trigger) | N cm-2 at z=1 | N cm-2 at z=2 | /(d.o.f.) | |
|---|---|---|---|---|
| 160-281 | ||||
| 281-350 | ||||
| 440-1050 | ||||
| 5000-1.2e6 |
| Time after GRB (s) | magnitude | Band |
| 164-214 | V | |
| 214-264 | V | |
| 311-321 | V | |
| 383.5-393.5 | V | |
| 457.5-462.5 | V | |
| 526.5-536.5 | V | |
| 597.5-607.5 | V | |
| 668.5-678.5 | V | |
| 740.5-750.5 | V | |
| 811.5-821.5 | V | |
| 882.5-892.5 | V | |
| 954-964 | V | |
| 1210-1300 | V | |
| 11354-12254 | V | |
| 282.5-292.5 | U | |
| 353.5-363.4 | U | |
| 425-435 | U | |
| 496.5-506.5 | U | |
| 567.5-577.5 | U | |
| 639-649 | U | |
| 710.5-720.5 | U | |
| 781.5-791.5 | U | |
| 852.5-862 | U | |
| 924-934 | U | |
| 1001.5-1101.5 | U | |
| 6477.5-7140 | U | |
| 30500 | R | |
| 51900 | R |
t