1–8
Mass loss on the Asymptotic Giant Branch
Abstract
Mass loss on the Asymptotic Giant Branch provides the origin of planetary nebulae. This paper reviews several relevant aspects of AGB evolution: pulsation properties, mass loss formalisms and time variable mass loss, evidence for asymmetries on the AGB, binarity, ISM interaction, and mass loss at low metallicity. There is growing evidence that mass loss on the AGB is already asymmetric, but with spherically symmetric velocity fields. The origin of the rings may be in pulsational instabilities causing mass-loss variations on time scales of centuries.
1 Introduction
The Asymptotic Giant Branch (AGB) contains two separate phases. During the early AGB, stars experience quiescent shell burning around the inert but growing carbon–oxygen core. Later, quiescent hydrogen burning is punctuated by run-away helium flashes [Herwig (2005), (Herwig 2005)] followed by short phases of (lower-luminosity) quiescent helium burning. The helium flashes are called thermal pulses (TPs). During the TP-AGB phase, the star begins to experience strong pulsations, and increasing mass loss. Evolution proceeds from semiregular (SR) to Mira and eventually to OH/IR star, with mass-loss rates simultaneously increasing from typically for Miras, to for OH/IR stars. The latter show strong self-obscuration by the circumstellar envelope. Carbon-rich stars show a parallel sequence but with lower V-band amplitudes, and higher circumstellar extinction for the same mass-loss rates.
The mass loss reaches values much higher than the nuclear burning rate. The hydrogen envelope therefore diminishes much faster than that the core grows. Once the envelope mass falls below a critical value (), the photosphere begins to collapse, mass-loss rates reduce and the star enters the post-AGB phase. In this way, the mass loss causes a very sudden end to stellar evolution [Willson, L.A. (2000), (e.g. Willson 2000)].
In this paper, aspects of AGB evolution related to the mass loss will be reviewed.
2 Pulsations
Pulsation properties evolve strongly during the TP-AGB. The semiregulars have periods of typically 50–150 days, small amplitudes and (as the name implies) have irregular light curves. Mira variables have periods of 150–500 days, amplitudes in excess of 2.5 mag in V, and stable light curves. OH/IR stars show periods of 500–2000 days. The amplitude is largest at optical wavelengths. The stellar energy distribution peaks in the infrared, and the bolometric amplitude is much less than in the V-band, rarely more than one magnitude. The large optical amplitude is caused by variable molecular opacity, mainly due to TiO and VO bands. The classification can show imperfections. OH/IR stars tend not to be observable in the V-band, and are often classified as SR because the amplitude is only measured at K. Stars with higher C/O ratio show reduced abundances of oxygen-rich molecules, and can therefore also show lower amplitudes.
The pulsation equation is given by:
| (1) |
where in the latter case the pulsation constant ; the period is in days and the radius and mass are in solar units. Mira variables are fundamental-mode pulsators, whilst SR variables show overtone pulsations. Fundamental-mode models including turbulent viscosity [Olivier & Wood (2005), (Olivier & Wood 2005)] reproduce Mira light curves fairly well.
A well-defined Mira period–luminosity relation was found from stars in the LMC. The Macho, Ogle and Sirius surveys have shown that this relation is only one of several parallel sequences. Magellanic Cloud stars show five sequences [Kiss & Bedding (2003), Ita et al. (2004), (e.g. Kiss & Bedding 2003, Ita et al. 2004)], two of which are identified as overtones, one is the Mira fundamental mode, one is an RGB sequence tracing semi-detached binaries, and the last sequence shows periods much longer than the fundamental mode which are still unexplained [Wood et al. (2004), (Wood et al. 2004)].
Long-term monitoring of Mira variables, mostly by amateur astronomers, has given light curves covering, in some cases, several centuries. These extended light curves have shown that most Miras are stable, but a number of stars show evolving periods. The best known case is that of R Hya, for which historical records [Zijlstra et al. (2002), (Zijlstra et al. 2020] indicate a continuous decline from about 495 days before 1800, to 385 days in 1950. The period has remained stable since 1950, and the earlier longer period also may have been stable. [Templeton et al. (2005)] has analyzed the full set of AAVSO records available, and out of 547 Mira variables find 8 cases of long-term period changes, at 6 significance. The most dramatic case is T UMi, which showed a constant period for over 60 years, before a sudden, sharp decrease in period by 25 per cent over the next 20 years.
[Zijlstra & Bedding (2002)] define three types of period instability: sudden changes as in T UMi, continuous changes as in R Hya, and meandering periods. The latter appears to be common among the longest period Mira variable, and involve variations up to 10 per cent on time scales of years.
Several explanations exist for the period changes. Thermal pulses involve large, sudden variations in luminosity (and therefore radius and period). This fits stars such as T UMi well, where there was no pre-indicator of a developing instability. The rate of thermal pulses is of the order of 0.5 per cent per century, or about per century among the known Miras. The second possiblity is a non-linear pulsation [Olivier & Wood (2005), (Olivier & Wood 2005)], where the change in amplitude causes a change in period [Ya’ari & Tuchman (1996), (Ya’ari & Tuchman 1996)]. Following a large amplitude change, e.g. the onset of pulsation, they find a large period decrease of the fundamental mode over a time scale of centuries. The observed correlation between period and amplitude changes [Zijlstra & Bedding (2002), (e.g Zijlstra & Bedding 2002)] provides some support for this model. [Icket et al. (1992)] have pointed out that the surfaces of long-period stars are susceptible to weak chaos. [Zijlstra et al. (2004)] discuss strongly variable periods among SC stars, where the C/O ratio is very close to unity and the chemical equilibrium is highly sensitive to temperature changes: they suggest that in SC stars, rapid changes in molecular abundances may trigger weakly chaotic period changes.
3 Mass loss
3.1 Proposed relations
AGB mass loss is a multi-step process. The pulsations extend the atmosphere, and allow molecules to form. At large distances the temperature drops below the condensation temperatures and a number of solids form: MgSiO-bearing grains in O-rich environments, and SiC and amorphous carbonaceous particles around carbon-rich stars. Radiation pressure pushes the grains out, and by collisions carries the gas with it. Pulsation can support mass-loss rates , but the radiation pressure on dust (and molecules) greatly increases the mass loss. The difference corresponds to the case A and case B mass-loss regimes of [Winters et al. (2000)].
Dynamical models of the extended envelopes do not yet convincingly predict mass-loss rates. Instead, formulistic mass-loss rates are used. The following relations are in general use:
| (2) |
Relation (ii) is derived by fitting the Bowen pulsation models to observed initial–final mass relations; (iii) is derived for carbon-rich stars only, using dynamical models, whilst (iv) comes from mass-loss determinations in the LMC, including both AGB and RSG stars, and is observationally the best established.
A very strong dependence on stellar temperature is indicated. However, the optical spectral type used to assign a temperature measures the layer in the molecular envelope, far above the real stellar surface: it underestimates both the surface and the effective temperature. The strong dependence is also deceptive. Using , relations (iii) and (iv) give and , respectively. The first one is physically unlikely, and [Wachter et al. (2002)] may overestimate the effect of luminosity. The Bloecker relation suffers from the same problem. Relation (iv) excludes mass as a relevant parameter, because this parameter is not known for the LMC stars. However, we may adopt the suggestion that the mass loss depends on the surface binding energy, . In this case, relations (iii) and (iv) suggest that the total dependence is along the lines of
| (3) |
with ; the luminosity dependence is likely weaker, with .
In addition to the surface parameters, the mass loss is also affected by the period, since the atmosphere extension is pulsation-driven. Relation (i) is the only one to include the pulsation explicitly. But the other relations also implicitly do so, via the pulsation equation. However, they predict a period dependence which is much weaker than found for (i). An example to constrain the period dependence is given by the evolution of R Hya, because its decreasing period over the past 200 years was accompanied by a strong decrease in mass loss [Zijlstra et al. (2002), (Zijlstra et al. 2002)]. Its evolution fits relation (i) well, but is not be reproduced by the other relations.
Overall, the predictive value of the proposed relations is still limited. Important parameters, such as composition and metallicity, are not or not fully included. The case A and B regimes may show different dependences on stellar parameters.
3.2 Time-variable mass loss
Mass loss is known to vary on several time scales. Over , the slow increase in the absolute magnitude of will be accompanied by an increase of [Vassiliadis & Wood (1993), e.g. Vassiliadis & Wood 1993]. This slow evolution is interrupted by the thermal pulses, which cause a sharply enhanced mass loss event, occuring every to yr, depending on the core mass. Mass loss variations on a time scale of – yr are implied by the multiple rings seen around many PNe. Finally, extinction variations in both carbon-rich and oxygen-rich stars indicate changes within decades.
Mass loss spikes during the TP are the accepted explanation for the detached shells seen around TT Cyg, U Cam and DR Ser, among others [Olofsson et al. (2000), (e.g. Olofsson et al. 2000)]; the thin shells can be explained by a brief burst of 100-fold stronger mass loss, sweeping up the previous, weaker and slower wind [Schöier at al. (2005), (Schöier et al. 2005)]. The TP is followed by a subsequent phase of quiescent helium burning when is a factor of 3 lower than during the hydrogen burning phase, with a weaker wind.
The multiple, thin rings seen around PNe [Coradi2004, (Corradi et al. 2004)] still lack a commonly accepted explanation. First, an instability involving the dust driving was suggested by [Simis et al. (2001)]: dust formation leads to increased dust density, until dust-gas coupling empties the dust shell. This leads to mass-loss episodes at the correct time scales. However, this instability is not correlated between different directions, and does not lead to spherical structures. Cooling due to existing dust strongly enhances the local dust formation rate, leading to near-chaotic mass loss [Woitke (2005)]. Second, a nuclear-burning instability was suggested by [Van Hron et al. (2003)]. Third, the period instability found for long-period Miras, interpreted as due to a non-linear pulsation, could cause the rings [Zijlstra & Bedding (2002), (Zijlstra & Bedding 2002], via period-induced mass-loss variations. The hypotheses need to explain the slight irregularity in the ring spacings, and the decrease in spacings for rings closer to the star (i.e. ejected later). The model involving the non-linearity in the pulsations can explain both. However, the issue is still far from settled.
The decadal (extinction) variations are most easily explained by the dust clumping as found in the Woitke models. Extinction variations are mainly seen in carbon-rich stars [Whitelock et al. (2006), (e.g. Whitelock et al. 2006)] but a few oxygen-rich stars also show variations due to circumstellar extinction, most noticeably L2 Pup [Bedding et al. (2002), (Bedding et al. 2002)].
4 Morphology
Strong asymmetries are present in the morphologies of almost all post-AGB envelopes. These structures must have their origin during the AGB mass loss. But remarkably little evidence for the precursors of the post-AGB morphologies has been found. In fact, the current consensus is that AGB envelopes are spherically symmetric, and that asymmetries form during a run-away process at the very tip of the AGB. The argument that such a fundamental change happens during a phase which is unobservable only by its brevity, is far from convincing.
Two observations provide evidence for spherical AGB shells. One comes from the OH maser profiles of OH/IR stars, with strong peaks at the extreme velocities. For asymmetric envelopes, the emission at intermediate velocities becomes stronger and multiple peaks may develop [Chapman (1988), (Chapman 1988)]. The second observation is that the outer structures around PNe and post-AGB stars are often round, especially so for the rings. The regular detached shells around, e.g., TT Cyg should also be mentioned.
However, both can be questioned. Maser emission cannot be used to determine a density structure. Instead it is an exponential function of the column density at constant velocity, in competition between all directions. OH profiles are far more dependent on the velocity structure than on the densities. An asymmetric envelope with a spherically symmetric velocity structure will give rise to symmetric profiles.
The rings appear to provide stronger evidence. However, any mass-loss changes leading to such rings are likely to be accompanied by changes in the expansion velocity. The rings then become the swept-up interface between the more massive, faster wind and the slower, weaker wind: [Zijlstra et al. (2001)] show that the swept-up shell will move at constant velocity, with the location at anyone time given by:
| (4) |
where
If the two winds are self similar, and specifically if they show spherically symmetric velocities and show the same ratio of mass-loss rates in all directions, will be direction independent. The swept-up interface will be spherical, even if the underlying mass loss is not.
Thus, in both cases there is strong evidence for spherically symmetricvelocity fields, but the mass loss itself can be asymmetric.
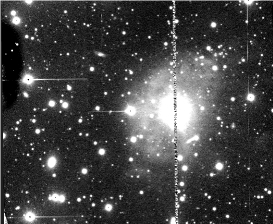
There is in fact growing evidence for bipolar shells on the AGB. The bipolar envelope of X Her was mapped by [Nakashima (2005)]. The reflection nebula around RZ Sgr [Whitelock (1994)] is bipolar in our NTT image (Fig. 1). Linear polarization is present in integrated photometric data of some OH/IR stars [Jones & Gehrz (1990), (Jones & Gehrz 1990)]. Finally, the core of IRC+10 216 shows several components, possibly in a bipolar configuration [Osterbart et al. (2000), (Osterbart et al. 2000)]. (The last two points can also be expained by Woitke-type blobs [Woitke (2006), (Woitke 2006)], however.)
5 Binarity
Whereas binarity is now thought to be very common among post-AGB stars and PNe, and the likely cause of the asymmetries of the envelopes, very little is known about binarity among AGB stars. The extreme brightness and low temperature of the AGB star make a binary comnpanion difficult to detect, except where the companion interacts with the extended atmosphere or the wind. Direct evidence for binarity among AGB stars will be needed to make evolutionary connections between AGB and post-AGB stars.
A distinction can be made between four different types of interaction.
-
1.
Common envelope systems, where the companion triggers the mass loss. These system will rarely reach the AGB, as the common envelope is likely to develop already on the RGB. Orbital separations are of the order of 1 AU. Perhaps 10 per cent of ’proto planetary nebulae’ may derive from such systems, although fewer would evolve into PNe.
-
2.
Wider systems, where the geometry of the mass loss is affected, but not the mass-loss rate itself. These systems may include symbiotic stars and the RV Tau progenitors. Orbital separations are a few to tens of AU, and the systems exhibit circumbinary disks and accretion. These may account for per cent of the PN birth rate. The companion may ionize part of the stellar wind, as in OH 231.8+4.2.
-
3.
Systems with only minor effects on the mass loss geometry. Typical separations are AU. The geometry may show the movement of the mass-losing star, as in the spiral nebula around AFGL 3068 [Mauron & Huggins (2006), (Mauron & Huggins 2006, see also Morris et al, these proceedings)]. Mira itself has a white dwarf companion AU away.
6 ISM interaction
The study of the interaction between the AGB wind and its local ISM was pioneered by [Villaver et al. (2002)]. Previously, the interaction had only been considered for old, ionized PNe. The interaction begins in fact with the onset of the AGB wind, and leads to a swept-up shell surrounding the AGB star. Once the swept-up mass exceeds the mass lost in the wind, the shell slows down and eventually becomes near-stationary. The typical radius of this shell is 1–2 pc, depending on local conditions. An example of such a shell, called a ’wall’, was found by [Zijlstra & Weinberger (2002)]. The wall may wipe out any memory of long-term mass-loss fluctuations. Once the PN fast wind reaches the outer wall, the PN rebrightens; this increases the PN life time.
If there is a significant proper motion of the star with respect to the ISM, the wall becomes one-sided and at higher velocities, becomes a bow shock. This is modelled by [Wareing et al. (2006)], based on the IPHAS morphology of the PN Sh2-188. The Spitzer image of R Hya (Speck, these proceedings) show another example of such a bow shock.) Evolutionary calculations for a large range of parameters are presented by Wareing (these proceedings).
7 Metallicity
The effect of metallicity on AGB mass loss is only just beginning to be explored. [Bowen & Willson (1991)] first showed that for [Fe/H], dust-driven winds fail and the mass loss becomes pulsation-driven instead. This significantly reduces the mass-loss rates. Using their formalisms, [Zijlstra (2004)] find that the final (white dwarf) mass becomes higher at very low metallicity, and may reach the Chandresekhar limit. This does not happen in the models of [Herwig (2004)] where core-dredge-up limits the core mass to .
Mass-loss rates in the LMC are as high as those in the Galaxy [Van Loon et al. (1999)]. However, it is possible that these values are reached at higher luminosities than for Galactic stars. (The metallicity of the LMC is comparable to the outer Galactic disk.) Evidence for reduced mass-loss rates at much lower metallicity comes mainly from the specific frequency of PNe, which is significantly lower in metal-poor dwarf galaxies compared to more metal-rich systems. This is illustrated in fig. 2.

Expansion velocities will be much lower at lower metallicity, limited by the dust-to-gas ratio. Evidence is sparse, as expansion velocities outside of our Galaxy have only been measured for some LMC OH/IR stars. These indeed indicate a significantly lower expansion velocity in the LMC [Marshall et al. (2004), (Marshall et al. 2004)].
Dredge-up of carbon will lead to higher C/O ratios at lower metallicity, because of the lower oxygen abundance. This leads to the counter-intuitive effect that carbon molecules are more abundant at lower metallicity. The C2H2 infrared bands were indeed found to be very strong in carbon stars in the Magellanic Clouds [Matsuura et al. (2005), (e.g. Matsuura et al. 2005)]. This has consequences for dust formation: amorphous dust may form easily around low metallicity carbon stars, while minerals such SiC and MgS do not, ginvig a mineral-poor or ’soft’ dust. [Sloan et al. (2006)] and [Zijlstra et al. (2006)], using Spitzer spectra, indeed find that the SiC and MgS features are weaker in the Magellanic Clouds. Oxygen-rich stars can only form dust from metal-dependent minerals, and their dust formation efficiency is expected to be strongly suppressed at low metallicity. Mass loss and dust formation at low metallicity is therefore expected to be dominated by carbon stars.
References
- [Bedding et al. (2002)] Bedding T.R., Zijlstra A.A., Jones A., Marang F., Matsuura M., Retter A., Whitelock P.A., Yamamura I., 2002, MNRAS, 337, 79
- [Bloecker (1995)] Bloecker T., 1995, A&A, 297, 727
- [Bowen & Willson (1991)] Bowen G.H., Willson L.A. 1991, ApJ, 375, L53
- [Chapman (1988)] Chapman J.M., 1988, MNRAS, 230, 415
- [Corradi et al. (2004)] Corradi R.L.M., Sánchez-Blázquez P., Mellema G., Giammanco C., Schwarz H.E., 2004, A&A, 417, 637
- [Feast et al. (2003)] Feast M.W., Whitelock P.A., Marang, F., 2003, MNRAS, 346, 878
- [Fox & Wood (1982)] Fox M.W., Wood P.R.. 1982, ApJ, 259, 198
- [Jones & Gehrz (1990)] Jones T.J., Gehrz R.D., 1990, AJ, 100, 274
- [Herwig (2005)] Herwig F., 2005, ARA&A, 43, 435
- [Herwig (2004)] Herwig F., 2004, ApJS, 155, 651
- [Icket et al. (1992)] Icke V., Frank A., Heske A., 1992, A&A, 258, 341
- [Ita et al. (2004)] Ita Y., Tanabé T., Matsunaga N., et al., 2004, MNRAS, 347, 720
- [Kiss & Bedding (2003)] Kiss L.L., Bedding T.R., 2003, MNRAS, 343, L79
- [Magrini et al. (2003)] Magrini L., Corradi R.L.M., Greimel R., Leisy P., Lennon D.J., Mampaso A., Perinotto M., Pollacco D.L., Walsh J.R., Walton N.A., Zijlstra, A.A., 2003, A&A, 407, 51
- [Marshall et al. (2004)] Marshall J.R., van Loon J.Th., Matsuura M., Wood P.R., Zijlstra A.A., Whitelock P.A., 2004, MNRAS, 355, 1348
- [Matsuura et al. (2005)] Matsuura M., Zijlstra A.A., van Loon J.Th., Yamamura I., Markwick A.J., Whitelock P.A., Woods P.M., Marshall J.R., Feast M.W., Waters L.B.F.M., 2005, A&A, 434, 691
- [Mauron & Huggins (2006)] Mauron M., Huggins P., 2006, A&A, in press
- [Nakashima (2005)] Nakashima J., 2005, ApJ, 620, 943
- [Olivier & Wood (2005)] Olivier, E.A., Wood P.R., 2005, MNRAS, 362, 1396
- [Olofsson et al. (2000)] Olofsson H., Bergman P., Lucas R., Eriksson K., Gustafsson B., Bieging J.H., 2000, A&A, 353, 583
- [Osterbart et al. (2000)] Osterbart R., Balega Y.Y., Blöcker T., Men’shchikov A.B., Weigelt G., 2002, A&A, 357, 169
- [Schöier at al. (2005)] Schöier F.L., Lindqvist M., Olofsson, H., 2005, A&A, 436, 633
- [Simis et al. (2001)] Simis Y.J.W., Icke V., Dominik C., 2001, A&A, 371, 205
- [Sloan et al. (2006)] Sloan GC., Kraemer K.E., Matsuura M., Wood P.R., Price S.D., Egan M.P., 2006, ApJ, in press
- [Templeton et al. (2005)] Templeton M.R., Mattei J.A., Willson L.A., 2004, AJ, 130, 776
- [Van Hron et al. (2003)] Van Horn H.M., Thomas J.H., Frank A.; Blackman E.G., 2003, ApJ, 585, 983
- [Van Loon et al. (2005)] van Loon J.Th., Cioni M.-R.L., Zijlstra A.A., Loup C., 2005, A&A, 438, 273
- [Van Loon et al. (1999)] van Loon J.Th., Groenewegen M.A.T., de Koter A., Trams N.R., Waters L.B.F.M., Zijlstra A.A., Whitelock P.A., Loup C., 1999, A&A, 351, 559
- [Vassiliadis & Wood (1993)] Vassiliadis E., Wood P.R., 1993, ApJ, 413, 614
- [Villaver et al. (2002)] Villaver E., Garcıa-Segura G., Manchado A., 2002, ApJ, 571, 880
- [Wachter et al. (2002)] Wachter A., Schröder K.-P., Winters J.M., Arndt T.U.. Sedlmayr E., 2002, A&A, 384, 452
- [Wareing et al. (2006)] Wareing C.J., O’Brien T.J., Zijlstra A.A., Kwitter K.B., Irwin J., Wright N., Greimel R., Drew J.E., 2006, MNRAS, 366, 387
- [Whitelock (1994)] Whitelock P.A., 1994, MNRAS, 270, L15
- [Whitelock et al. (2006)] Whitelock P.A., Feast M.W., Marang, F., Groenewegen M.A.T., 2006, MNRAS, in press
- [Willson, L.A. (2000)] Willson L.A., 2000, ARA&A, 38, 573
- [Winters et al. (2000)] Winters J.M., Le Bertre T., Jeong K.S., Helling Ch., Sedlmayr, E., 2000, A&A, 361, 641
- [Woitke (2005)] Woitke P., 2005, A&A, 433, 1101
- [Woitke (2006)] Woitke P., 2006, A&A, in press
- [Wood et al. (2004)] Wood P.R., Olivier E.A., Kawaler S.D., 2004, ApJ, 604, 800
- [Wood (1990)] Wood P.R., 1990, in From Miras to Planetary Nebulae: Which Path for Stellar Evolution?, M.O Mennessier & A. Omont (eds.), (Edition Frontieres, Gif-sur-Yvette), p 67
- [Ya’ari & Tuchman (1996)] Ya’Ari A., Tuchman Y., 1996, ApJ, 456, 350
- [Zijlstra et al. (2001)] Zijlstra A.A., Chapman J.M., te Lintel Hekkert P., Likkel L., Comeron F., Norris R.P., Molster F.J., Cohen R.J., 2001 MNRAS, 322, 280
- [Zijlstra et al. (2002)] Zijlstra A.A., Bedding T.R., Mattei J.A., 2002, MNRAS, 334, 498
- [Zijlstra & Bedding (2002)] Zijlstra A.A., Bedding T.R., 2002, JAVSO, 31, 2
- [Zijlstra & Weinberger (2002)] Zijlstra A.A., Weinberger R., 2002, ApJ, 572, 1006
- [Zijlstra (2004)] Zijlstra A.A., 2004 MNRAS, 348, L23
- [Zijlstra et al. (2004)] Zijlstra A.A., Bedding T.R., Markwick A.J., Loidl-Gautschy R., et al., 2004, MNRAS, 352, 325
- [Zijlstra et al. (2006)] Zijlstra A.A., Matsuura M., Wood P.R., Sloan G.C., 2006 MNRAS, submitted