HST/STIS Optical Spectroscopy of Five Super Star Clusters in the Starburst Galaxy M82
Abstract
We present optical spectroscopy obtained with the Space Telescope Imaging Spectrograph (STIS) of five young massive star clusters in the starburst galaxy M82. A detailed analysis is performed for one cluster ‘M82-A1’ and its immediate environment in the starburst core. From HST archive images, we find that it is elliptical with an effective radius of pc and is surrounded by a compact ( pc) H ii region. We determine the age and reddening of M82-A1 using synthetic spectra from population synthesis models by fitting both the continuum energy distribution and the depth of the Balmer jump. We find an age of Myr and a photometric mass estimate of – M⊙. We associate its formation with the most recent starburst event 4–6 Myr ago. We find that the oxygen abundance of the H ii region surrounding M82-A1 is solar or slightly higher. The H ii region has a high pressure –2 cm-3 K. The diffuse gas in region A has a slightly lower pressure, which together with the broad H emission line width, suggests that both the thermal and turbulent pressures in the M82 starburst core are unusually high. We discuss how this environment has affected the evolution of the cluster wind for M82-A1. We find that the high pressure may have caused the pressure-driven bubble to stall. We also obtain spectroscopic ages for clusters B1-2 and B2-1 in the ‘fossil’ starburst region and for the intermediate age clusters F and L. These are consistent with earlier studies and demonstrate that star formation activity, sufficiently intense to produce super star clusters, has been going on in M82 during the past Gyr, perhaps in discrete and localized episodes.
keywords:
galaxies: evolution – galaxies: individual: M82 – galaxies: ISM – galaxies: starburst – galaxies: star clusters.1 Introduction
Young, massive super star clusters (SSCs)111In this paper, we define SSCs to include star clusters with half-mass radii of pc; ages of Myr; and total masses of M⊙ are a prominent product of the intense star formation episodes that occur in nearby starbursts, and presumably in merging galaxies at high redshift. They are important objects to study because of the insights they provide on: the formation and destruction of globular clusters; star formation processes in extreme environments; and the triggering and feeding of supergalactic winds. The properties of young massive star clusters are extensively reviewed in a recent proceedings (Lamers, Smith & Nota 2004).
M82 is the best nearby example of a giant starburst galaxy at a distance of 3.6 Mpc (Freedman et al. 1994). The present intense burst of nuclear star formation was triggered by a tidal interaction with M81 some –5 yr ago (Brouillet et al. 1991; Yun, Ho & Lo 1994). The active starburst region has a diameter of 500 pc and is defined optically by the high surface brightness regions or clumps denoted A, C and E by O’Connell & Mangano (1978). An optical imaging study of the central region of M82 with the Planetary Camera onboard the Hubble Space Telescope (HST) by O’Connell et al. (1995) revealed the presence of over one hundred candidate SSCs within the visible starburst. They find that the optically-bright structures containing the clusters correspond to known sources at X-ray, infra-red (IR) and radio wavelengths. They argue that this cannot be accidental and suggest that regions A, C and E represent the parts of the starburst core which are the least obscured along the line of sight.
Region A is of special interest. It contains a remarkable complex of SSCs with very high continuum and emission line surface brightnesses (O’Connell & Mangano 1978; O’Connell et al. 1995). The well-known large-scale bipolar outflow or ‘superwind’ appears to be centred on regions A and C (Shopbell & Bland-Hawthorn 1998; Gallagher et al., in prep.). In a recent paper, Melo et al. (2005) have catalogued the young stellar clusters in the starburst core of M82 using HST archive data. They find a total of 197 optically visible clusters with 86 of these residing in region A.
The age and evolution of the starburst in M82 have been the subject of numerous studies. The starburst region appears to be composed of two spatially separate stellar populations. The presence of a strong IR continuum and large CO absorption index indicates a population of red supergiants in the core (Rieke et al. 1993; Satyapal et al. 1997; Förster Schreiber et al. 2001). The youngest and most massive stars responsible for the strong Lyman continuum flux are located in a pc circumnuclear arc (Achtermann & Lacy 1995). Using evolutionary synthesis models, Rieke et al. (1993) and Förster Schreiber et al. (2003) find that two bursts are needed to reproduce the observational properties. The latter authors find the bursts occurred 10 and 5 Myr ago with a duration of a few million years. The first burst was particularly intense in the core and the second occurred mainly in the circumnuclear regions.
While models of the active starburst region suggest star formation is propagating outwards, studies of star clusters outside the central regions reveal considerably older star formation episodes. Gallagher & Smith (1999) derived ages of Myr for two SSCs M82-F and L located 440 pc south-west of the nucleus. Photometric age-dating of the extended “fossil” starburst region B, located 0.5–1 kpc north-east of the nucleus, shows that the peak of the star formation episode occurred at (de Grijs et al. 2001, 2003, 2005).
One long outstanding question concerning starburst environments is whether the initial mass function is abnormal in the sense that less low mass stars are produced in an intense star-forming episode. M82 has been the focus of many studies aimed at settling this question. The mass function of the central starburst region of M82 has been estimated based on the light-to-mass ratio, but this is controversial mainly owing to the difficulty of determining extinction corrections in such a complex system. Some studies (e.g. O’Connell & Mangano 1978; Telesco et al. 1991; Satyapal et al. 1997) find a normal mass function, while others (e.g. Rieke et al. 1993; Forster-Schreiber et al. 2003) find a deficiency of low mass stars. Light-to-mass ratios determined for individual SSCs are more robust. Smith & Gallagher (2001) measured the dynamical mass of M82-F and showed that its visual mass-to-light ratio required a mass function deficient in low mass stars, and thus it is unlikely to become an old globular cluster. McCrady, Gilbert & Graham (2003) determined dynamical masses for two SSCs on the western edge of the active starburst region in M82, and found that one object appeared to be deficient in low mass stars. A re-analysis of M82-F by McCrady, Graham & Vacca (2005) based on HST images obtained with the Advanced Camera for Surveys (ACS) and Keck/NIRSPEC spectra confirm that it has an abnormal mass function, and thus possibly a peculiar stellar mass function.
In contrast, analyses of nebular line diagnostic ratios indicate a lack of hard-UV photons in some starburst regions, implying a deficit of high mass stars (e.g. Puxley et al. 1989; Achtermann & Lacy 1995). In a recent study, Rigby & Rieke (2004) suggest an alternative explanation for the low [Ne iii]/[Ne ii] ratios observed in solar metallicity-type starbursts. They propose that the hard ionizing photons from massive stars are absorbed in long-lived ultracompact H ii regions which are a consequence of the high interstellar densities encountered in a starburst.
The proximity of M82 ( pc) means that individual clusters are easily resolved by HST and are bright enough to obtain spectroscopy. In this paper, we present spectroscopy obtained with the Space Telescope Imaging Spectrograph (STIS) onboard HST for five massive clusters of varying ages. The first object, which we designate as M82-A1, is a bright isolated cluster in region A. We will focus on the analysis and interpretation of this STIS dataset because it represents the first optical spectroscopy of an individual cluster and its immediate environment in the starburst core. We also present STIS spectroscopy for one slit position crossing both clusters F and L, and slits covering the two brightest clusters in the fossil region B. These spectra are of lower quality than those of M82-A1 but we are able to derive spectroscopic ages.
The STIS slit position for cluster M82-A1 extends across regions A and C, close to the nucleus and the base of the superwind, sampling the ionized gas in the starburst core on spatial scales of a few parsecs. In a separate paper (Smith et al., in prep.), we will discuss the nature of the ionized component in the M82 starburst, as revealed by these optical emission line data.
2 Observations and data reduction
2.1 Spectra
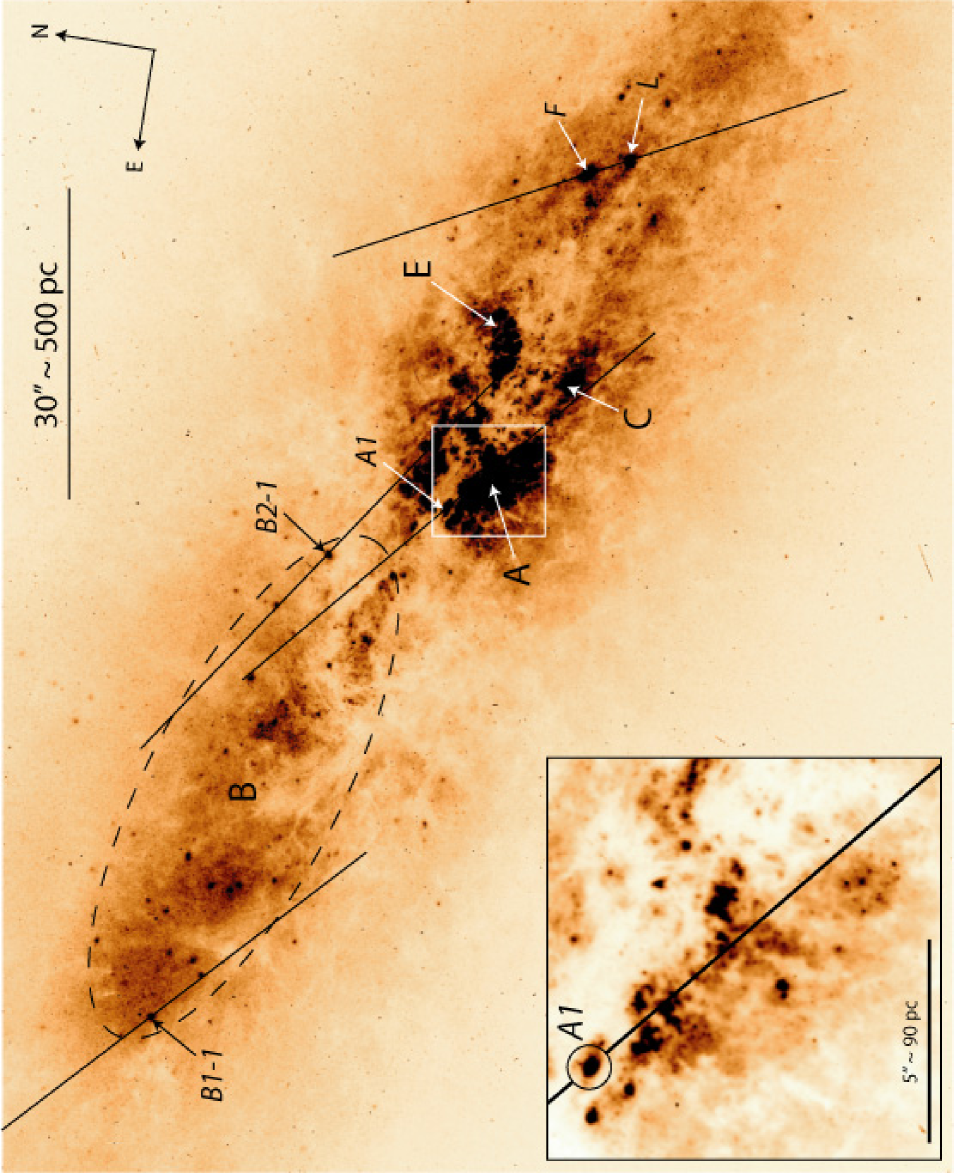
We obtained long-slit HST/STIS spectra at four positions in the centre of M82 (GO 9117; P.I. O’Connell). One slit was centred on the brightest isolated cluster in region A, which we designate as M82-A1. Another slit sampled M82-F and M82-L, while the two remaining pointings were centred on M82-B1-1 and M82-B2-1, within the post-starburst region (de Grijs et al. 2001). In Fig. 1, we show the slit positions for the five clusters superimposed on an archive HSTACS/WFC F814W image (see Sect. 2.2).
| Grating | |||||
| Name | G430L | G750M | G750L | ||
| range (Å) : | 29005700 | 62956865 | 525010300 | ||
| Cluster | Slit | (Å pix-1) : | 2.73 | 0.56 | 4.92 |
| A1 | Ap= | No. of exposures: | 12 | 4 | — |
| PA | Date : | 2002/11/27 | 2002/11/26 | — | |
| Offsets=Multiple | Exposure time : | 231.4m | 70.8m | — | |
| B1-1 | Ap | No. of exposures: | 3 | 2 | — |
| PA | Date : | 2002/06/03 | 2002/06/03 | — | |
| Offsets=none | Exposure time : | 52.2m | 39.m | — | |
| B2-1 | Ap | No. of exposures: | 3 | 2 | — |
| PA | Date : | 2002/11/02 | 2002/11/02 | — | |
| Offsets=none | Exposure time : | 52.2m | 39.1m | — | |
| F+L | Ap | No. of exposures: | — | — | 4 |
| PA | Date : | — | — | 2001/12/26 | |
| Offsets=multiple | Exposure time : | — | — | 163.7m | |
A1 : ; (J2000)
F : ; (J2000)
B1-1: ; (J2000)
B2-1: ; (J2000)
Details of the STIS spectroscopy observations are listed in Table 1. Spectra were taken in three different bands: the blue continuum (including the Balmer jump), the H region, and the near-infrared continuum. Coordinates of the four clusters initially placed at the centre of the slit are given in the footnote to the table. In each case, the position angle was oriented to place other interesting regions on the slit. In the case of A1 and F+L, multiple exposures were made, stepped along the slit to improve the elimination of hot pixels in the data reduction process.
To combine the individual image sets of A1, B1-1 and B2-1, we first registered the cosmic ray-corrected images from the calstis data reduction pipeline. We then flipped the cold pixels present in the datasets to high values by inspecting intensity histograms of the images. We next used the iraf/stsdas cosmic ray rejection (occrej) task to combine all the images and eliminate the remaining cosmic rays and hot and cold pixels. Finally we used the x2d task to provide rectified absolute flux and wavelength calibrated two-dimensional spectral images.
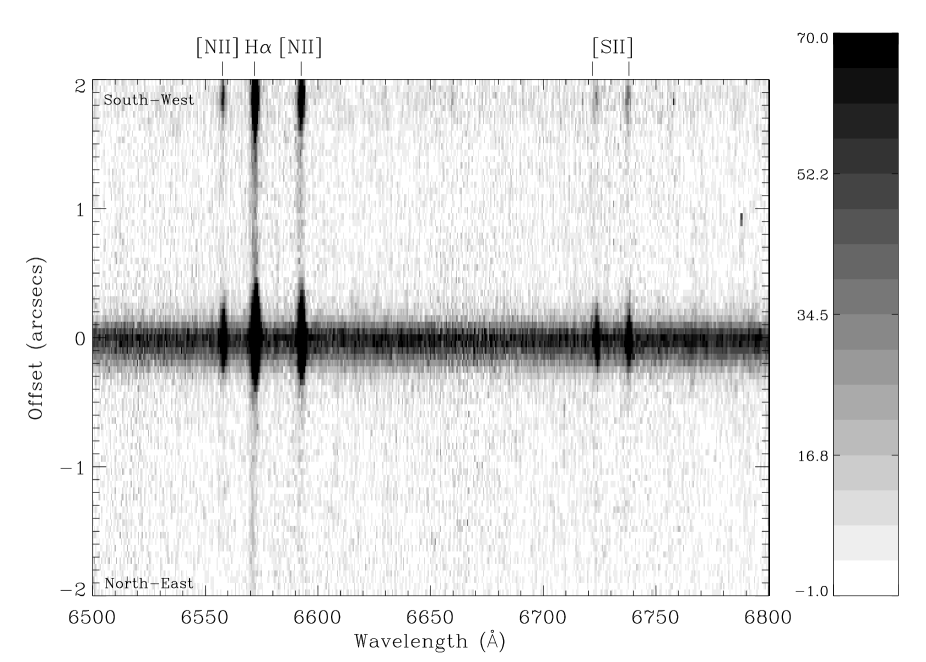

In Fig. 2, a small portion of the reduced two-dimensional image of M82-A1 for the G750M grating is shown. The cluster is clearly resolved and is surrounded by a compact H ii region. From cuts across the STIS 2D spectra, we measure a FWHM of pixels or for M82-A1, exceeding the slit width of . The spectral resolution of the G430L and G750M gratings for an extended source is 2–3 pixels. We measure a resolution of Å from Gaussian fits to the unresolved nebular H emission line originating in ionized gas along the slit. We will therefore assume for this cluster that the actual spectral resolution is 2.5 pixels or 6.7 Å (G430L) and 1.4 Å (G750M grating).
To extract one-dimensional spectra, we used an extraction width of 14 pixels for clusters A1, B1-1 and B2-1, to include all the cluster light. For A1, we performed a background subtraction using 10 pixel-wide regions centred at pixels from the centre of the cluster. These particular regions were chosen because they contain negligible emission from the ionized gas in region A compared to the cluster (% at H; cf. Fig 2). The exact choice of background bins for the clusters in B1 and B2 was not critical, so we used a prescription analogous to that for region A. No correction for slit losses have been made.
Clusters F+L were observed with the G750L grating. To enable the correction of fringing effects, which are particularly prominent for redder wavelengths, the science exposures were interspersed with CCD flatfields. The observations were calibrated using the calstis pipeline within iraf/stsdas. After basic reduction and cosmic ray rejection, normalized fringe flats were prepared for each exposure, following the procedure outlined in STIS/ISR98-29. These fringe flats were then applied to correct the fringing in the spectra. Careful examination of the fringe-corrected spectra showed this procedure to be quite clean and accurate. In this way, we reduced the dataset to four, cosmic-ray cleaned and defringed, two-dimensional spectra.
Before the process of final calibration, during which a spectrum is rectified along the wavelength and spatial axes, as well as converted to physical flux units, the spectra from each of the four exposures needed to be registered, shifted and combined into a single two-dimensional spectrum, with the associated removal of hot pixels. The combination was performed as follows: first, the spatial profile of the cluster was obtained by summing over wavelength pixels in bins which were free of contamination from both emission lines and hot pixels lying near the position of the cluster in the spectrum. A separate profile was made for each exposure. The peak of the cluster was determined by fitting gaussians to each of the four cluster profiles. The two-dimensional spectra were then shifted along the spatial axis by the amount needed to place the peak of the cluster exactly at the central spatial pixel of the spectrum. These shifted spectra were finally combined using the stsdas routine mscombine, which cleanly removes hot pixels from the final spectrum.
| Filter | Camera | Plate Scale | Exposure | FWHM | Minor/Major | vegamag | ||
|---|---|---|---|---|---|---|---|---|
| CCD | (′′ pix-1) | Time | (major axis) | Axis Ratio | Photometry | |||
| (s) | (mas) | (mas) | (mag) | |||||
| F439W | WFPC2/WF4 | 0.099 | 3300 | 140 | 0.74 | 130 | ||
| F439W | WFPC2/WF4 | 0.099 | 4100 | 140 | 0.71 | 140 | ||
| F555W | WFPC2/WF4 | 0.099 | 2500 | 170 | 0.68 | 160 | ||
| F555W | WFPC2/WF4 | 0.099 | 3100 | 170 | 0.65 | 160 | ||
| F547M | WFPC2/PC | 0.045 | 100 | 180 | 0.72 | 180 | ||
| F814W | WFPC2/WF4 | 0.099 | 140 | 220 | 0.66 | 210 | ||
| F814W | ACS/WFC | 0.049 | 120 | 210 | 0.70 | 210 | 14.91 | |
| F160W | NICMOS/NIC1 | 0.043 | 448 | 200 | 0.79 | 200 | ||
| F190N | NICMOS/NIC2 | 0.076 | 384 | 200 | 0.71 | 190 | ||
| F222M | NICMOS/NIC2 | 0.076 | 448 | 160 | 0.79 | 160 | ||
| F656N | WFPC2/PC | 0.045 | 1000 | 290 | 0.57 | 260 | 8.54E |
1Total H flux in units of ergs cm-2 s-1
Since the clusters are marginally resolved with the aperture of the slit, aperture illumination effects can be substantial. Therefore, we used the stsdas routine x1d, part of the calstis ensemble, to extract the final one-dimensional spectrum of clusters F and L within 11 pixel wide bins, as well as adjacent galaxy backgrounds. Using X1D ensures that wavelength dependent aperture illumination effects are taken into account during flux calibration of the spectrum. The backgrounds were then subtracted from the cluster extractions to obtain spectra of pure cluster light. For cluster F, the background accounts for no more that % of the light in the cluster extraction, but this fraction is higher for the lower luminosity cluster L, especially in the blue end of the spectrum, since cluster L is heavily reddened by intervening dust.
2.2 Images
In this section we present HST archival images for cluster M82-A1 and measure its size and perform photometry. HST images and measurements have been presented by de Grijs et al. (2001) for clusters B1-1 and B2-1. In their nomenclature, B1-1 corresponds to No. 28 in their table 2, and B2-1 to No. 12 in their table 3. The magnitudes of B1-1 and B2-1 are given as 17.93 and 17.90 mag respectively. Smith & Gallagher (2001) present HST images of clusters F and L obtained with the Wide Field and Planetary Camera 2 (WFPC2) while McCrady et al. (2005) present images of cluster F obtained with the High Resolution Channel (HRC) of the ACS instrument.
We obtained HST images taken with the WFPC2, ACS and NICMOS cameras for the central region of M82 from the HST archive; the details of these images are given in Table 2. The broad-band WFPC2 F439W, F555W and F814W images from the GO 7446 programme (PI O’Connell) are centred on the fossil starburst regions B1 and B2 (see de Grijs et al. 2001) and region A is on the WF4 CCD. We also obtained narrow-band images in the F656N and F547M filters which are part of the GO 6826 programme (PI Shopbell) on the superwind of M82. We used the F547M filter for continuum subtraction in the F656N filter. These images are discussed in more detail in Gallagher et al. (in prep.). The single ACS F814W image was obtained as part of the GO 9788 snapshot programme (PI Ho) and is shown in Fig. 1. The NICMOS images from the GO 7218 programme (PI Rieke) are described in Alonso-Herrero et al. (2003).
Cosmic rays were removed from the pipeline-reduced images using the Laplacian cosmic ray identification routine of van Dokkum (2001). The individual images were then checked for saturation and averaged. Photometry and radius measurements of M82-A1 are complicated by the varying background of emission and absorption by gas and dust in the starburst core. The images also show that the cluster is quite elliptical (Fig. 1).
To measure the size of M82-A1, we used the ishape algorithm (Larsen 1999) together with the tinytim package (Krist 2004) to correct for the point-spread function (PSF) for the WFPC2 and NICMOS cameras. For the ACS F814W image, we used an empirical PSF generated from point sources in the field of 47 Tuc (Mora, priv. comm.). First, we determined the best fitting radius for the profile fits by examining fits to the F547M image using a Moffat function with a power index of 1.5. We found that a radius of 0.5 arcsec was optimal since this was sufficiently large but excluded light from other nearby sources. We then experimented with different profile types and chose a Moffat function with a power index of 1.5 since this gave the lowest residuals in the overall fit. We also tried varying the power-law index of the Moffat profile but found that a value of 1.5 consistently gave the best fit. Elson, Fall & Freeman (1987) determined that profiles of this type provide good fits to LMC star clusters while de Grijs et al. (2001) found similar results for the profiles of the brightest clusters in region B of M82, including B1-1 and B2-1.
In Table 2, we list the FWHM of the major axis and the minor/major axis ratio, as estimated by ishape for each image. We also give the effective or half-light radius where we have used the expressions given by Larsen (2004) to convert the FWHM of an elliptical Moffat profile fit to a half-light radius. We find very consistent results for the WF4 and ACS F814W measurements given the different pixel scales and PSFs. For comparison, as detailed in the instrument handbooks, the PSFs of the WF4, PC and ACS/WFC chips are and 80 mas respectively. To estimate appropriate errors, we fitted the F547M and F814W/ACS images with a number of different profile types. We find that, in terms of the residuals, King profiles with different concentration parameters also give acceptable fits. From the scatter in the resulting values, we find that the likely error in each measurement is mas. Taking a straightforward mean of the radii measured in the continuum filters, we find mas or pc for M82-A1. We derive a mean minor/major axis ratio of from the same images. For comparison, McCrady et al. (2003) have measured for several clusters (including M82-A1 which is MGG-a1 in their designation) from NICMOS NIC2 F160W images. From spherical King profile fits, they find mas which is smaller than our own more precise measurements which allow for ellipticity. It is apparent from Table 2 that the radius of M82-A1 decreases towards shorter wavelengths; we discuss this effect in Sect. 3.1.
Measurements of the size and total flux of the compact H ii region surrounding M82-A1, based on H emission measured in the F656N filter, are also given in Table 2. It is highly elliptical with a major axis FWHM value of 290 mas and an axis ratio of 0.57, giving a half-light radius of mas or pc. Thus the H ii region is only 1.5 times larger than the cluster.
In Table 2, we list the magnitudes of M82-A1 for the wide-band filters in the vegamag system. M82-A1 is superimposed on a varying background. We tried various approaches to subtracting the background and found that the most robust and simplest method was to use a flat plane. The level was calculated from an average of measurements, taken at four locations around the cluster M82-A1, that were deemed to contain “representative” background values. The photometry of M82-A1 was performed using the phot task within the NOAO digiphot package. It was decided that a 7 pixel radius aperture gave the best results, considering the morphology of M82-A1 is such that it has a protrusion extending north-westwards of the cluster. The total counts measured in each aperture were corrected for CCD charge transfer effects using the formulation of Dolphin (2002). They were then converted to magnitudes using the zeropoints provided for the vegamag system in the instrument handbooks. We estimate the measurements are accurate to mag because of the uncertainties in the varying background. This level of accuracy was also verified with two sets of independent measurements.

3 Cluster M82-A1
3.1 The change of radius with wavelength
Before presenting and discussing the STIS spectra of M82-A1, we first discuss possible reasons for the decrease in radius of the cluster at progressively shorter wavelengths. In Fig. 4 we plot against wavelength for M82-A1. If we exclude the NICMOS measurements in Table 2 (because the diffraction limit is close to the radius of M82-A1), then the cluster radius appears to decrease at successively shorter wavelengths; the radius is 30% smaller in the F439W filter compared to the F814W filter.
McCrady et al. (2005) find that the radius of cluster M82-F decreases with increasing wavelength, and they interpret this as being due to mass segregation, with the more centrally concentrated stars being the most massive cooler evolved stars. For M82-A1, we see the opposite effect with the radius deceasing towards blue wavelengths.
It is not clear what is causing this decrease in radius. At the young age of this cluster, most of the detected light should originate from stars with roughly the same mass. We find from the output of the spectral synthesis code Starburst99 (see Sect. 3.3) that this is indeed the case, and that any change in colour with mass will be shallow for a mass segregated cluster. This leads us to conclude that it is difficult to produce a radial gradient due to mass segregation.
| Line | Velocity | FWHM | Equivalent | Comments | |
|---|---|---|---|---|---|
| (Å) | (km s-1) | (km s-1) | Width (Å) | ||
| G430L spectrum | |||||
| [O ii] | 3728.48 | 448 | blended doublet | ||
| H8 abs | 3890.15 | 171 | blended with He i? | ||
| Ca ii K | 3934.78 | 205 | Interstellar | ||
| Ca ii H | 3969.59 | 415 | Interstellar; blended with H | ||
| H abs | 3971.19 | 294 | blended with Ca ii H | ||
| H abs | 4102.89 | 335 | |||
| H em | 4341.68 | 332 | |||
| H abs | 4341.68 | 327 | |||
| H em | 4862.68 | 298 | |||
| [O iii] | 4960.30 | 343 | |||
| [O iii] | 5008.24 | 319 | |||
| G750M spectrum | |||||
| [N ii] | 6549.85 | 322 | 93 | ||
| H | 6564.61 | 319 | 95 | ||
| [N ii] | 6585.28 | 318 | 96 | ||
| [S ii] | 6718.29 | 319 | 77 | ||
| [S ii] | 6732.67 | 322 | 84 | ||
We now consider whether the compact H ii region surrounding the cluster could affect the radius measurements. It is unlikely that contamination from nebular emission lines in the broad-band filters is causing the radius variations because the emission lines are weak (see Figs. 5 and 6) and the F814W filter does not contain any significant nebular emission. The presence of dust in the H ii region may, however, produce a decrease in radius towards bluer wavelengths. A diffuse foreground screen of dust will change the brightness but, since it will dim the cluster uniformly, it will not affect the radius or shape as a function of wavelength. However, if dust is concentrated in the H ii region, then the cluster would maintain a roughly constant shape (as measured), yet be dimmer and smaller with decreasing wavelength because of the greater obscuration at shorter wavelengths. We therefore conclude that the most probable explanation for the decrease in radius with decreasing wavelength is the effect of dust in the surrounding compact H ii region. To resolve this conclusively, ACS/HRC observations of M82-A1 are required. Dynamical models addressing the colour gradients in young mass segregated clusters and a check for cool supergiants that could support colour gradients are also needed.
3.2 Spectra
In Figs. 5 and 6, we show the flux-calibrated spectra of M82-A1 for the G430L and G750M gratings. The major line identifications, heliocentric velocities, FWHMs (for the G750M spectrum only) and equivalent widths are presented in Table 3 for the absorption and emission features. The equivalent widths were measured by defining continuum windows in the spectra and the errors represent uncertainties based on the error in the continuum.


3.2.1 Absorption Lines
The G430L spectrum is dominated by Balmer absorption lines from the cluster, and a weak Balmer jump at 3650 Å, indicating a young age. Strong interstellar Ca ii absorption lines are also present. No stellar absorption lines are detected in the G750M spectrum. The mean heliocentric radial velocity of the cluster as measured from the Balmer absorption lines is km s-1. The velocity of the interstellar Ca ii K line is km s-1. This is very close to the systemic velocity of M82 of km s-1(Achtermann & Lacy 1995). The cold interstellar gas therefore appears to be at rest for this line of sight near the nucleus of M82.
3.2.2 Emission Lines
A number of emission lines arising from the compact H ii region surrounding M82-A1 are apparent in the STIS spectra. We detect nebular emission lines of H, H, H, [O ii] , [O iii] , [N ii] and [S ii] . The low [S ii]/H ratio of 0.21 is consistent with photoionization rather than shock heating. In Fig. 6, the red member of the [S ii] doublet is the strongest of the two lines, indicating that the H ii region has a high density. In Section 3.4 we derive the electron density and oxygen abundance.
The comparatively high resolution of the G750M spectrum allows us to measure accurate velocities and FWHMs for the H ii region, as given in Table 2. We find a mean heliocentric velocity for the H, [N ii] and [S ii] nebular lines of km s-1, in excellent agreement with the measured value of the cluster radial velocity. The lines have an observed FWHM of km s-1 and are clearly resolved since the measured resolution is 63 km s-1; the intrinsic mean FWHM is then km s-1. This gives a maximum expansion velocity for the H ii region of km s-1.
3.3 Cluster parameters
The starburst core of M82 suffers from a high and non-uniform extinction. For example, Satyapal et al. (1995) find values for the visual extinction ranging from 2–12 mag from near-IR nebular line ratios, assuming a foreground screen model. For the whole M82-A complex, centred about 6″ SW of M82-A1 (see Figs. 1a and 1b), Marcum & O’Connell (1996) estimated that arises in a foreground dust screen with an additional (5500 Å) arising from internal dust. As can be seen from Figs. 1 and 2, the STIS slit crosses some areas of complete obscuration at optical wavelengths. The cluster M82-A1 sits close to the conspicuous dust lane that bisects the galactic disk; to the east of this cluster (or lower pixel number in Fig. 2), we detect little emission due to the very high extinction.


Ages and reddening for clusters less than 10 Myr old are usually determined from spectroscopy using the UV wavelength region because the spectral energy distribution (SED) is largely independent of age and the stellar wind features are sensitive age indicators (e.g. Tremonti et al. 2001; Chandar et al. 2004). However, given sufficient spectral resolution, the short-wavelength optical band (especially the continuum structure and strong absorption lines in the Balmer jump region between 3500 and 4100 Å) should provide a comparable hold on age and reddening. Gallagher & Smith (1999) derived the age of cluster M82-F by comparing the observed spectrum in the region of the Balmer jump with theoretical model cluster spectra. Here, we use recent high-resolution population synthesis models to fit the combined spectrum of M82-A1.
First, we binned the G750M STIS spectrum to match the G430L spectrum and merged the two spectra. We fit the combined spectrum using v5.0 of the spectral synthesis code Starburst99 (SB99: Leitherer et al. 1999; González Delgado et al. 2005) which includes a new synthetic high resolution (0.3 Å) spectral library from 3000–7000 Å containing non-LTE models for OB stars (Martins et al. 2005). We generated a series of SB99 models for different ages (2–10 Myr), assuming solar metallicity (see Sect. 3.4), an instantaneous burst with a Kroupa (2001) IMF, lower and upper masses of 0.1 and 100 M⊙, and the enhanced mass loss Geneva tracks.
The resulting high resolution synthetic spectra were smoothed, binned, and velocity shifted to match the G430L spectrum of M82-A1. We de-reddened the observed combined spectrum using a foreground dust screen, employing the Galactic reddening law from Howarth (1983) and , and a range of values from typically 0.9–1.8 mag. These de-reddened spectra were then normalised to the synthetic spectra at 6800 Å and the quality of the fit for each possible combination of age and was judged by the statistic, with highest weight given to the spectral region 3700–4400 Å. Typically, we find that we can match the model continuum longward of the Balmer jump from 3700–6800 Å by varying until a good fit is obtained; this then provides a value of the reddening for each model as a function of age. The quality of the fit of the model spectrum to the observed de-reddened spectrum below the Balmer jump then determines the age.
Using this approach, we find that the STIS spectra of M82-A1 can only be matched by the SB99 synthetic spectra for a relatively narrow age range of 5–7 Myr and –1.2 mag. We checked the SB99 results with a comparable grid taken from the independent synthesis models of Bruzual & Charlot (2003; BC03), which incorporate a lower resolution (3 Å) but more realistic empirical spectral library. The fits are quite similar to those of SB99, with a slightly larger age range of 4–7 Myr. From ground-based spectrophotometry, Marcum & O’Connell (1996) obtained an average age of Myr for the entire M82-A complex, in good agreement with these estimates for M82-A1.
In Fig. 7 we show the SB99 fit for the best fitting SB99 model, at an age of 6.4 Myr and mag. The overall fit to the continuum is good, and it can be seen that the upper members of the Balmer series are also fairly well-fitted (e.g. H8 which has minimal nebular line emission). This model, which has the largest Balmer jump in either model grid, slightly overestimates the observed flux in the Balmer continuum below 3600 Å. The discrepancy could be caused by internal extinction within M82-A1 or perhaps a small error in the STIS calibration here. Alternatively, there could be weaknesses in the models. Adjacent models which fit the continuum above the Balmer jump by varying the parameter provide poorer short-wavelength fits below the Balmer jump, as illustrated in Fig. 8. Abrupt changes in the Balmer jump and the color of the continuum in the SB99 models for ages of 6–10 Myr are probably caused by intermediate temperature class I-II stars, and it is not clear that these are being accurately modelled (González Delgado et al. 2005).
We can now employ two independent indicators for reddening and age to determine if they are consistent with those found from the spectral analysis. First, we use the nebular H i emission lines to measure the interstellar extinction by comparing the observed H/H and H/H ratios with the intrinsic case B values of Hummer & Storey (1987). We correct for stellar absorption by directly subtracting the reddened synthetic SB99 spectrum from the observed STIS spectrum using the reddening values we have determined for the best-fit age range. We find mag, in good agreement with dereddening the cluster energy distribution. This method of directly subtracting the synthetic spectrum to recover the intrinsic nebular line fluxes has the advantage that we can recover the H emission line and obtain a more accurate measurement for the H line flux. We also compare the observed and colours of M82-A1 with the predicted colours from SB99 for ages of 6 and 7 Myr and find in reasonable agreement with the above. For the reddening towards M82-A1, we will adopt the mean value given by the cluster SED and the nebular lines of mag.
Our independent age indicator is the strength of the observed equivalent width of the nebular H emission (Table 3) when compared with the predicted values from Starburst99. The observed equivalent width of Å (corrected for stellar absorption) gives an upper limit to the age of 6.7 Myr. This value is consistent with the age determined from the Balmer jump, and suggests that few ionizing photons escape from the H ii region. We thus conclude that the age of M82-A1 is Myr.
Using the above values, we derive and . The photometric mass is very dependent on the form of the IMF. For a Kroupa (2001) IMF and a Salpeter IMF (with a lower mass limit of 0.1 M⊙), we derive masses of and M⊙ respectively. The derived parameters of M82-A1 are given in Table 4.
| Parameter | Value | ||
| Cluster | |||
| Radial velocity | +320 | 20 km s-1 | |
| F555W | mag | ||
| Half-light radius | 3.0 | 0.5 pc | |
| 1.35 | 0.15 mag | ||
| 0.38 mag | |||
| Log / | 7.87 | 0.15 | |
| Age | 6.4 | 0.5 Myr | |
| Mass | 6.6 | M⊙1 | |
| 1.3 | M⊙2 | ||
| Photon Luminosity | 7.5 | s-1 | |
| in Lyman continuum | |||
| H ii Region | |||
| Half-light radius | 4.5 | 0.5 pc | |
| Electron density | cm-3 | ||
| 8.8 | |||
| Ionization | |||
| Parameter | |||
| Ionized Mass | 5 000 M⊙ | ||
1 using a Kroupa (2001) IMF; 2 using a Salpeter IMF.
3.4 H ii region parameters
We now turn our attention to the properties of the H ii region that surrounds the cluster M82-A1. We have already established that it is compact with a half-light radius of pc. From Gaussian fits to the [S ii] emission line profiles, we derive an electron density cm-3, assuming a standard electron temperature value of K. The H ii region surrounding M82-A1 can therefore be classified as a high pressure (– cm-3 K, considering the likely range in ) compact H ii region. We are also able to derive for the diffuse gas along the STIS slit in region A and find a mean value of cm-3, suggesting that the ionized gas in region A is at high pressure, at least the region probed by the optical [S ii] lines. O’Connell & Mangano (1978) derived a similar value of cm-3 for regions A and C from the [S ii] ratio.
Our measurements are far higher than those of Förster Schreiber et al. (2001) who measured in the starburst core using observations obtained with the Short Wavelength Spectrograph (SWS) onboard the Infrared Space Observatory. The SWS aperture covers an area of and they find that the line ratios of the fine structure lines of [S iii], [Ne iii] and [Ar iii] all lie at the low density limit; they adopt cm-3. The large difference in density between the STIS and ISO measurements may be due to sampling different environments. We consider this in more detail in the next section when we discuss the evolution of the M82 starburst as revealed by the study of Förster Schreiber et al. (2003).

We can obtain an approximate oxygen abundance for the H ii region using techniques that rely on the relative strengths of the strong emission lines when is unknown. We will use two recent empirical methods. First we follow Kewley & Dopita (2002) and use their equation (7) to derive from the de-reddened [N ii]/[O ii] ratio of 2.2. We find based on a solar O abundance of . Thus the O abundance using this method is solar. Next, we use the method of Pettini & Pagel (2004) which is based on the ratios of [N ii]/H () and [O iii] /H to [N ii]/H () and is insensitive to reddening. Using the relations given by Pettini & Pagel, we derive () and 8.76 () based on a solar O abundance of . Thus this method gives an O abundance of solar. Finally, if we take the derived and adopt a value of K, we derive . Although these methods are approximate, they indicate that the oxygen abundance of the H ii region surrounding M82-A1 is close to solar, and that our assumption that K is reasonable.
For comparison, Förster Schreiber et al. (2001) derive Ne, Ar and S abundances from their SWS dataset. They find that the abundances of Ne and Ar are slightly above solar and S is 0.25 solar. In a recent paper, Origila et al. (2004) have obtained abundances for red supergiant stars in the nuclear region of M82 and find a solar oxygen abundance.
We can also derive the ionized mass of the H ii region from the observed total H flux listed in Table 2. Using the adopted value for , a distance of 3.6 Mpc, K, and cm-3, we find an ionized mass of M⊙. This value is a lower limit because the close agreement between the ages derived from the cluster spectrum and the equivalent width of nebular H strongly suggests that the H ii region is radiation-bounded.
4 Other Clusters
We fit population synthesis models to the STIS spectra of the other four observed clusters using the method described above for M82-A1. The quality of the spectra, however, is lower than for A1. In Table 5, we present a summary of the derived parameters for the four clusters and compare them with previous work.
4.1 Clusters F & L
The location and radial velocity of clusters M82-F and L (Gallagher & Smith 1999) places them within the 880 pc wide gaseous ring surrounding the starburst core of the galaxy (Telesco et al. 1991). The low velocity resolution of the STIS spectra does not allow us to investigate the kinematics of the clusters. However, the relatively high S/N and long wavelength coverage of the spectra allow us to use synthesis techniques to ascertain the spectral parameters of the clusters.
Figure 9 shows the de-reddened, near-infrared spectrum of cluster F compared to the best fit BC03 model. (The SB99 models do not offer good spectral resolution here.) The quality of the fits is determined by a weighted statistic. We give more weight to spectral regions containing the Ca ii triplet and the broad molecular TiO and VO features. We find that clusters F and L have ages of Myr and Myr respectively, with values of and . The largest source of uncertainty is the fact that the spectral ageing of Myr old populations in the wavelength range can be mimicked by a decrease in reddening.
Cluster F is associated with H and [N ii] line emission. Much of this is diffuse and kinematically unrelated to the cluster, but we are unable to properly model this background because it appears to be highly variable. An upper limit to the emission line equivalent width of H in the spectrum of F is , from which the SB99 models predict a lower limit to the cluster age of 22 Myr, consistent with the estimate above.
Our age estimate for cluster F compares favourably with that of Gallagher & Smith (1999) who find a value of Myr (Table 5). However, they derive a reddening value of , somewhat in excess of our estimate. This might be an effect of patchy extinction in the vicinity of cluster F combined with the lower spatial resolution of their ground-based spectrum. We do notice that the slope of the cluster spectrum becomes progressively redder towards the outskirts of the cluster, which might be taken as evidence for a non-uniform dust screen or internal extinction gradients within the cluster itself. This is consistent with the idea that M82-F is seen through a hole in the projected dust distribution of the galaxy (Gallagher and Smith 1999). As shown in Table 5, McCrady et al. (2005) find an even lower value for the reddening towards F based on ACS/HRC photometry.


Clusters F and L have comparable ages, which are distinct from those in regions A and B. Cluster L has considerably higher extinction despite being near to F in projection. Near infrared (1–2m) imaging does not reveal any other clusters in their vicinity (e.g. McCrady et al. 2003), so they do not seem to be members of a significant intermediate age subsystem unless the foreground optical depth in dust is very large. In addition, Gallagher & Smith (1999) find that clusters F and L have quite different radial velocities of and km s-1 respectively.
Finally, we measured the spatial FWHM of the cluster F in different spectral bins to look for any systematic decrease in the cluster size towards redder wavelengths. After correcting for the known wavelength dependent variation of the G750L PSF, we find no significant secular changes in the size of the cluster. We estimate an average spatial FHWM of 3.6 pixels or about 183 mas. This compares favorably to the average size of the cluster measured from ACS/HRC F814W images by McCrady et al. (2005).
| Cluster | Parameter | This Paper | Previous Work |
|---|---|---|---|
| F | Age (Myr) | ||
| 40–602 | |||
| 0.19–0.372 | |||
| L | Age (Myr) | ||
| B1-1 | Log (age) (yr) | 8.94 | |
| 8.865 | |||
| 0.045 | |||
| B2-1 | Log (age) (yr) | 9.74 | |
| 9.765 | |||
| 0.005 |
1Gallagher & Smith (1999); 2McCrady et al. (2005); 3Smith & Gallagher (2001); 4de Grijs et al. (2001); 5de Grijs et al. (2003).
4.2 Clusters B1-1 and B2-1
In Figures 10 and 11, we present the spectra and best-fit models for the two brightest clusters in regions B1 and B2. Both clusters show strong Balmer absorption lines and a deep Balmer jump, which are signatures of an intermediate age star cluster. The individual cluster spectra are typical of the integrated spectrum of region B and most of the rest of the main body of M82 outside the starburst core (described in de Grijs et al. 2001). (Seen in a distant galaxy, this would be called a post-starburst or ‘E+A’ type spectrum.) From our fitting routines, we derive log[age(yr)] for B1-1 and log[age(yr)] for B2-1. The significantly higher uncertainty for the second cluster is a combination of the larger extinction (E(B-V), as opposed to E(B-V) for B1-1) as well as a lower average S/N.
These results are generally consistent with those from ground-based spectrophotometry and HST imaging of region B, which contains a large number of intermediate age SSCs (Marcum & O’Connell 1996, de Grijs et al. 2001), probably associated with an intense star formation burst during the last close passage of M81 and M82 about 1 Gyr ago. However, as shown in Table 5, our ages are younger and extinctions higher than those for these clusters based on WFPC2 photometry by de Grijs et al. (2001, 2003). We believe our spectroscopic ages are more robust, owing to the difficulty of doing aperture photometry in such a complex region.
5 Discussion
The combination of high spatial resolution HST/STIS optical spectra and improved spectral synthesis model spectra have allowed us to derive numerous parameters for the young massive cluster M82-A1 and its H ii region in the starburst core of M82. These parameters are summarised in Table 4.
5.1 M82-A1 and the Evolution of the M82 Starburst
We now discuss the age and location of cluster M82-A1 in terms of the history of the central starburst. As discussed in Section 1, O’Connell et al. (1995) put forward various arguments to suggest that region A (with C and E) is the part of the starburst core that is least obscured along the line of sight. Cluster M82-A1 is located 130 pc north-east of the nucleus, slightly beyond the eastern edge of the 100 pc radius ionized arc identified by Achtermann & Lacey (1995) from [Ne ii] observations. Its measured radial velocity of km s-1 agrees well with the position-velocity maps of Achtermann & Lacey (1995). The cluster thus appears to be spatially and kinematically associated with the ionized gas seen in the starburst core of M82.
The evolutionary synthesis models of Förster Schreiber et al. (2003) reproduce the observed characteristics of the M82 starburst if there were two short duration bursts occurring 8–15 and 4–6 Myr ago. The first burst was concentrated in the central few tens of parsecs and the second episode occurred mainly in the circumnuclear regions. On the basis of its position and age of 6.4 Myr, we associate M82-A1 with the more recent burst. Melo et al. (2005) catalogue 86 clusters in region A and find this region has the highest projected surface density of young clusters. The morphology of region A (cf. Fig. 1) suggests the clusters are coeval. This is strengthened by the fact that the bright base (in projection) of the superwind is centred on regions A and C (O’Connell & Mangano 1978; Shopbell & Bland-Hawthorn 1998; Gallagher et al., in prep.), indicating that the clusters must be of a similar age since the cluster winds are very time dependent. If this is the case, then region A must correspond to a particularly intense episode of star formation Myr ago.
5.2 The M82-A1 H ii Region
We now discuss the compact H ii region associated with M82-A1. Förster Schreiber et al. (2001) have studied the physical conditions of the ISM in the starburst core of M82 from ground and space-based IR observations. They find that a random distribution of closely-packed ionizing clusters and small gas clouds, separated on average by a few parsecs, represents well the starburst regions of M82. They derive a constant ionization parameter of on spatial scales of a few tens of parsecs to 500 pc, and suggest that this uniform degree of ionization indicates a similar star formation efficiency and evolutionary stage for the M82 starburst regions.
The H ii region around M82-A1 represents a photoionized nebula on a much smaller physical scale than previous observations of Förster Schreiber et al. (2001) which probe down to structures typically on 25 pc scales. For comparison with their model, we derive the ionization parameter for the M82-A1 H ii region as given by:
| (1) |
where represents the photon luminosity in the Lyman continuum, is the nebula radius, and is the electron density. Taking the values given in Table 4, we obtain , in excellent agreement with the value of derived by Förster Schreiber et al. (2001), and thus extending the uniformity of the M82 starburst down to scales of a few parsecs or individual cluster H ii regions. This suggests that the whole M82 starburst region is self-adjusting in the sense that the number of ionizing photons per atom is constant.
The value of derived by Förster Schreiber et al. (2001) assumed an electron density of 300 cm-3, which is far lower than the value we find for the M82-A1 H ii region and the surrounding medium. We suspect these differences are due to sampling different environments; the IR observations of Förster Schreiber et al. (2001) probably probe deeper into the starburst region, and into a region where the gas is less compressed.
Turning now to the size of the H ii region, we find that it is compact with a radius only 1.5 times the cluster radius. It has a high pressure of – cm-3 K. The ambient thermal pressure of the diffuse ionized gas in region A is also high with cm-3 K. The total ambient pressure is probably even greater than this. The STIS spectra of the diffuse gas in region A show that the H emission is broad with an average velocity dispersion of 45 km s-1, giving cm-3 K. This suggests that the turbulent pressure component dominates. It presumably originates from the nonthermal energy input from supernovae events. The M82-A1 H ii region is therefore in an unusually high pressure environment which will control its evolution.
Observations of radio supernova remnants (Muxlow et al. 1994; Pedlar et al. 1999) in M82 show that they are compact (with radii pc) for their inferred ages; these authors suggest that their growth has been inhibited by the dense starburst environment in M82. Chevalier & Fransson (2001) propose that these sources are evolved supernova remnants interacting with a dense interstellar medium; they may have recently entered the radiative phase if the surrounding density is cm-3. We find that the density in region A is of this order, and that the compact H ii region surrounding M82-A1 has a similar size to the upper limit on the sizes of the radio supernova remnants. We thus postulate that the compactness of both the SNRs and the M82-A1 H ii region is the result of the high ambient pressure in the starburst core.
The continuous injection of energy by winds into the interstellar medium results in the formation of an adiabatic, pressure-driven bubble (e.g. Weaver et al. 1977; Chevalier & Clegg 1985). For a star cluster, the source of energy is first stellar winds and then supernovae. For M82-A1, we estimate that its cluster wind has a mechanical luminosity erg s-1 from the Starburst99 models for a Kroupa IMF and the derived mass of M82-A1. We can estimate the radius of the shell formed by the cluster wind using the standard equation for pressure-driven superbubbles from Weaver et al. (1977):
| (2) |
where is the shell radius, is the ambient mass density, and is the age. Using the value of given above, an ambient number density of 1000 cm-3 (Sect. 3.4), and an age of 6.4 Myr, the predicted radius is 150 or 100 pc, if we assume a thermalisation efficiency of 100% or 10% respectively. These values are obviously far in excess of the measured radius of 4.5 pc, and suggest that the H ii region has not developed according to the standard model.
Oey & García-Segura (2004) and Dopita et al. (2005) consider the effect of the ambient interstellar pressure on the dynamical evolution of pressure-driven superbubbles. A high ambient pressure will inhibit the growth of the H ii region and it will stall when the internal pressure of the superbubble equals the ambient pressure. The internal pressure is given by Weaver et al. (1977) as:
| (3) |
This leads to an internal pressure of or cm-3 K, assuming thermal efficiencies of 100 and 10% respectively. The latter value is reasonably close to our estimate of the total (thermal and turbulent) ambient interstellar pressure of cm-3 K. While this is a rough estimate, and does not take into account the fact that the bubble will not abruptly stop expanding when it stalls, it illustrates that the high ambient pressure is probably sufficient to modify the evolution of the H ii region surrounding the cluster M82-A1.
Using Eqn. (3), Dopita et al. (2005) show that all stalled H ii regions will have a common ratio of , and since scales roughly with the flux of ionizing photons , then all stalled H ii regions should have the same ionization parameter as given by Eqn. (1). This relationship may help to explain the uniformity of the ionization parameter on many scales in the starburst regions of M82 discussed above and by Förster Schreiber et al. (2001).
Another important possibility to consider is whether the cluster wind from M82-A1 has developed according to the standard adiabatically expanding wind model. Canto, Raga & Rodríguez (2000) present an analytic mass-loaded cluster wind model for a dense cluster of massive stars. They find that there are two solutions depending on the properties of the surrounding ISM; the standard supersonic solution or a subsonic solution if the environment is at high pressure. The latter solution may apply to M82-A1. The supersonic wind solution can also be inhibited if the cluster wind is sufficiently dense to promote radiative cooling (Silich, Tenorio-Tagle & Muñon-Tuñón 2003). This occurs if the cluster is massive but compact and a supernebula can then be formed (Tenorio-Tagle et al. 2005). From their figures, we find that the cluster M82-A1 is not in the regime where catastrophic cooling will occur.
Ultimately, it is hard to understand how the observed M82 galactic superwind is generated if the environment stifles its development because of the high ambient pressure. Chevalier & Fransson (2001) consider this problem in relation to their prediction that the compact radio supernovae in M82 are radiative and thus are unable to provide sufficient energy to drive a galactic wind. They hypothesise that galactic winds are driven only by supernovae occurring in a low density, hot medium. Another way around this problem is to conjecture that there is a pressure gradient in the central region of M82 such that the outer clusters are in a lower pressure region. The winds from these clusters will then be able to develop and may produce highly-collimated outflows, as envisaged in the interacting wind model of Tenorio-Tagle, Silich & Muñon-Tuñón (2003).
Whatever the precise reason for the compact nature of the H ii region surrounding M82-A1, it is clear that the unusually high ambient pressure in the M82 starburst environment must play an important role.
6 Summary and Conclusions
We have presented optical HST/STIS spectroscopy of five massive clusters in M82. Our best data are for cluster M82-A1 and its environment in region A of the starburst core. This region contains a large complex of young clusters which appear to be responsible for a major component of the superwind. We have sought to derive the properties of M82-A1, and thereby clarify the age of the recent starburst, and to investigate the nature of its ionized environment.
The STIS G430L spectrum of M82-A1 is dominated by Balmer absorption lines and a weak Balmer jump suggesting a young age. We measure a mean heliocentric velocity of km s-1. This value and its position 130 pc north-east of the 2m nucleus suggests that M82-A1 is spatially and kinematically associated with the starburst core.
Using the evolutionary synthesis code Starburst99 (Leitherer et al. 1999) which includes a high resolution spectral library to derive both the age and reddening of M82-A1, we find that we can only match the spectral energy distribution and depth of the Balmer jump for a narrow age range of 5–7 Myr and a reddening of –1.2 mag. The independent BC03 models give similar results.
The STIS G750M spectrum shows that M82-A1 is surrounded by a compact H ii region. We have recovered the intrinsic nebular spectrum by subtracting the best-fitting synthetic spectrum and find that the nebular reddening of mag agrees well with the value determined from the cluster SED. We adopt a mean of the two methods to give mag. The observed equivalent width of the H emission line provides an upper limit to the age of 6.7 Myr, in agreement with the depth of the Balmer jump. We adopt an age of Myr for M82-A1.
Comparison with the models of Förster Schreiber et al. (2003) suggest that the formation of M82-A1 is associated with the most recent burst of star formation which took place 4–6 Myr ago. The overall morphology of region A and the fact that a major component of the superwind is centred on this region suggests that the clusters are coeval. If this is the case, then region A must correspond to a particularly intense episode of star formation.
We have used archive HST images to derive the radius and mass of M82-A1 via photometry. We find that the cluster is elliptical with a mean effective radius of pc and a minor/major axis ratio of . The cluster effective radius appears to decrease towards shorter wavelengths. We interpret this behaviour as being due to dust in the surrounding H ii region rather than mass segregation because it seems difficult to produce a radial colour gradient in a young cluster. We derive a mass of 0.7–1.3 M⊙ for M82-A1 depending on whether we adopt a Kroupa or Salpeter IMF.
We have sought to understand the nature of the H ii region surrounding M82-A1. From HST/PC images, we have derived an effective radius of only pc and find that it is highly elliptical with a minor/major axis ratio of 0.57. It is also of high density; the [S ii] doublet in the STIS G750M spectrum gives an electron density of cm-3 or a thermal pressure of – cm-3 K, for =–1. The diffuse ionized gas along the STIS slit has a slightly lower density which, together with a measured high turbulent velocity dispersion of 45 km s-1, suggests that M82-A1 is immersed in an unusually high pressure environment. We also find that the oxygen abundance of the H ii region is close to, or slightly higher than, solar.
We find that the ionization parameter of the H ii region is in excellent agreement with the value of derived by Förster Schreiber et al. (2001) for scales of a few tens to 500 pc. Our measurement thus extends the uniformity of the M82 starburst down to the scale of individual cluster H ii regions, and suggests that the entire starburst is self-adjusting with a constant number of ionizing photons per atom.
We have sought to understand the compactness of the H ii region around M82-A1, given that it is much smaller than the size predicted for its age according to the standard model for a pressure-driven superbubble. We find that the high pressure of the environment may have caused the bubble to stall or follow a different wind solution to the standard supersonic adiabatic one. We suggest that models should be developed which account for the evolution of a cluster wind in a high pressure environment.
We also derive spectroscopic ages and reddening for four other clusters in M82 (B1-1, B2-1, F and L). These are consistent with earlier studies and demonstrate that star formation activity, sufficiently intense to produce super star clusters, has been going on in M82 during the past Gyr, perhaps in discrete and localized episodes.
Acknowledgments
We thank David Stys and Linda Dressel at STScI for their help in reducing the STIS observations, and Mario Livio for useful discussions. LJS and MSW thank the Department of Astronomy at the University of Wisconsin-Madison for their warm hospitality, and the Wisconsin and UCL Graduate Schools for financial support during the writing of this paper. We also thank Marcello Mora for the ACS PSF data and Nate Bastian for his help in using ishape. This paper is based on observations with the NASA/ESA Hubble Space Telescope which is operated by the Association of Universities for Research in Astronomy, Inc. under NASA contract NAS5-26555. It made use of HST data taken as part of GO programs 6826, 7218, 7446, 9117 and 9788. This research was supported in part by NASA LTSA grant NAG5-6403 and STScI grant GO-09117 to the University of Virginia. The Image Reduction and Analysis Facility (iraf) is distributed by the National Optical Astronomy Observatories which is operated by the Association of Universities for Research in Astronomy, Inc. under cooperative agreement with the National Science Foundation. stsdas is the Space Telescope Science Data Analysis System; its tasks are complementary to those in iraf.
References
- [1] Achtermann J. M., Lacy J. H. 1995, ApJ, 439, 163
- [2] Alonso-Herrerro, A., Rieke, G.H., Rieke, M.J., Kelly, D.M., 2003, AJ, 125, 1210
- [3] Brouillet, N., Baudry, A., Combes, F., Kaufman, M., Bash, F., 1991, A&A, 242, 35
- [4] Bruzual, G., Charlot, S., 2003, MNRAS, 344, 1000
- [5] Canto, J., Raga, A.C., Rodríguez, L.F., 2000, ApJ, 536, 896
- [6] Chevalier, R.A., Clegg, A.W., 1985, Nature, 317, 44
- [7] Chevalier, R.A., Fransson, C., 2001, ApJ, 558, L27
- [8] Dolphin A.E., 2002, HST Calibration Workshop, S. Arribas, A. Koekemoer, B. Whitmore eds., STScI, p.301
- [9] Dopita, M.A. et al., 2005, ApJ, 619, 755
- [10] van Dokkum P.G., 2001, PASP, 113, 1420
- [11] Elson R.A.W., Fall S.M., Freeman K.C., 1987, ApJ, 323, 54
- [12] Förster Schreiber N.M., Genzel R., Lutz D., Kunze D., Sternberg A., 2001, ApJ, 552, 544
- [13] Förster Schreiber N.M., Genzel R., Lutz D., Sternberg A., 2003, ApJ, 599, 193
- [14] Freedman W. et al., 1994, ApJ, 427, 628
- [15] Gallagher J.S., III, Smith L.J., 1999, MNRAS, 304, 540
- [16] González Delgado, R.M., Cerviño, M., Martins, L.P., Leitherer, C., Hauschildt, P.H., 2005, MNRAS, 357, 945
- [17] de Grijs R., O’Connell R. W., Gallagher J. S., III, 2001, AJ, 121, 768
- [18] de Grijs R., Bastian N., Lamers H.J.G.L.M., 2003, MNRAS, 340, 197
- [19] de Grijs R., Anders P., Lamers H.J.G.L.M., Bastian N., Parmentier G., Sharina M.E., Yi S., 2005, MNRAS, 359, 874
- [20] Howarth I.D., 1983, MNRAS, 203,301
- [21] Hummer D.G, Storey P.J., 1987, MNRAS, 224, 801
- [22] Kewley L.J., Dopita M.A., 2002, ApJS, 142, 35
- [23] Krist, J., 2004, The Tiny Tim User’s Guide v. 6.3
- [24] Kroupa P. 2001, MNRAS, 322, 231
- [25] Lamers, H.J.G.L.M., Smith, L.J., Nota, A., 2004, The Formation and Evolution of Massive Young Star Clusters, ASP Conf. Ser., Vol 322
- [26] Larsen, S.S., 1999, A&AS, 139, 393
- [27] Larsen, S.S., 2004, The ISHAPE Users Guide
- [28] Leitherer, C. et al., 1999, ApJS, 123, 3
- [29] Marcum, P. M., O’Connell, R. W. 1996, in From Stars to Galaxies: The Impact of Stellar Physics on Galaxy Evolution, eds. C. Leitherer, U. Fritze-von Alvensleben, & J. Huchra, (ASP Press), p. 419
- [30] McCrady N., Gilbert A.M., Graham J.R., 2003, ApJ, 596, 240
- [31] McCrady N., Graham J.R., Vacca, W.D., 2005, ApJ, 621, 278
- [32] Martins, L.P., González Delgado, R.M., Leitherer, C., Cerviño, M., Hauschildt, P., 2005, MNRAS, 358, 49
- [33] Melo, V.P., Muñoz-Tuñón, C., Maíz-Apellániz, J. & Tenorio-Tagle, G. 2005, ApJ, 619, 270
- [34] Muxlow, T.W.B., Pedlar, A., Wilkinson, P.N., Axon, D.J., Sanders, E.M., de Bruyn, A.G., 1994, MNRAS, 266, 455
- [35] O’Connell R.W., Mangano J.J., 1978, ApJ, 221, 62
- [36] O’Connell R.W., Gallagher J.S., III, Hunter D.A., Colley W.N. 1995, ApJ, 446, L1
- [37] Oey, M.S., García-Segura, G., 2004, ApJ, 613, 302
- [38] Origlia L., Ranalli P., Comastri A., Maiolino R., 2004, ApJ, 606, 862
- [39] Pedlar, A., Muxlow, T.W.B., Garett, M.A., Diamond, P., Willis, K.A., Wilkinson, P.N., Alef, W., 1999, MNRAS, 306, 761
- [40] Pettini M., Pagel B.E.J., 2004, MNRAS, 348, L59
- [41] Puxley P.J.; Brand, P. W. J. L.; Moore, T. J. T.; Mountain, C. M.; Nakai, N.; Yamashita, T., 1989, ApJ, 345, 163
- [42] Rieke G.H., Loken K., Rieke M.J., Tamblyn P., 1993, ApJ, 412, 99
- [43] Rigby J.R., Rieke G.H., 2004, ApJ, 606, 237
- [44] Satyapal S. et al., 1995, ApJ, 448, 611
- [45] Satyapal S., Watson D.M., Pipher J.L., Forrest W.J., Greenhouse M.A., Smith H.A., Fischer J., Woodward C.E., 1997, ApJ, 483, 148
- [46] Shopbell P., Bland-Hawthorn J., 1998, ApJ, 493, 129
- [47] Silich, S., Tenorio-Tagle, G., Muñon-Tuñón, C., 2003, ApJ, 590, 791
- [48] Smith L.J., Gallagher J.S., III, 2001, MNRAS, 326, 1027
- [49] Telesco, C.M., Joy, M., Dietz, K., Decher, R., Campins, H., 1991, ApJ, 369, 135
- [50] Tenorio-Tagle, G., Silich, S., Muñon-Tuñón, C., 2003, ApJ, 597, 279
- [51] Tenorio-Tagle, G., Silich, S., Rodríguez-González, A., Muñon-Tuñón, C., 2005, ApJ, 620, 217
- [52] Tremonti C.A., Calzetti. D, Leitherer C., Heckman T.M., 2001, ApJ, 555, 322
- [53] Weaver, R. McCray, R., Castor, J., Shapiro, P., Moore, R., 1977, ApJ, 218, 377
- [54] Yun M. S., Ho P. T. P., Lo K. Y. 1994, Nature, 372, 530