Unravelling the mystery of the M31 bar
Abstract
The inclination of M31 is too close to edge-on for a bar component to be easily recognised and is not sufficiently edge-on for a boxy/peanut bulge to protrude clearly out of the equatorial plane. Nevertheless, a sufficient number of clues allow us to argue that this galaxy is barred. We use fully self-consistent -body simulations of barred galaxies and compare them with both photometric and kinematic observational data for M31. In particular, we rely on the near infrared photometry presented in a companion paper. We compare isodensity contours to isophotal contours and the light profile along cuts parallel to the galaxy major axis and offset towards the North, or the South, to mass profiles along similar cuts on the model. All these comparisons, as well as position velocity diagrams for the gaseous component, give us strong arguments that M31 is barred. We compare four fiducial -body models to the data and thus set constraints on the parameters of the M31 bar, as its strength, length and orientation. Our ‘best’ models, although not meant to be exact models of M31, reproduce in a very satisfactory way the main relevant observations. We present arguments that M31 has both a classical and a boxy/peanut bulge. Its pseudo-ring-like structure at roughly is near the outer Lindblad resonance of the bar and could thus be an outer ring, as often observed in barred galaxies. The shape of the isophotes also argues that the vertically thin part of the M31 bar extends considerably further out than its boxy bulge, i.e. that the boxy bulge is only part of the bar, thus confirming predictions from orbital structure studies and from previous -body simulations. It seems very likely that the backbone of M31’s boxy bulge is families of periodic orbits, members of the x1-tree and bifurcating from the x1 family at its higher order vertical resonances, such as the x1v3 or x1v4 families.
1 Introduction
It is very easy to recognise bars in disc galaxies which are far from edge-on. This, however, is not true for discs seen edge-on, the safest approach being to use kinematics (Kuijken & Merrifield, 1995; Merrifield & Kuijken, 1999; Bureau & Freeman, 1999; Bureau & Athanassoula, 1999, 2005; Athanassoula & Bureau, 1999; Chung & Bureau, 2004). Yet kinematics are often not available, and thus one has to rely on morphology and photometry alone. A large number of properties (see Athanassoula (2005a), hereafter A05, for a global discussion and a compilation of references) argue that a boxy/peanut bulge is a part of a bar seen edge-on. Thus, the mere presence of such a bulge is telltale of the existence of a bar component (but see Patsis et al. (2002), arguing that other rotating bisymmetric perturbations could also form boxes). If the galaxy is observed side-on (i.e. edge-on with the line of sight along the bar minor axis), then the boxy or peanut feature is clearly visible. If, however, the bar is seen end-on (i.e. edge-on with the line of sight along the bar major axis), then the bar has the outline of a classical bulge111Following A05, we distinguish throughout this paper three types of bulges. Classical bulges were formed in the early stages of the galaxy formation process, before the present discs, from gravitational collapse, or hierarchical merging of smaller objects and the corresponding dissipative processes. Boxy/peanut bulges are part of the bar, i.e. they are constituted by stellar disc material, and they form naturally from the long-term evolution of the stellar component of bar unstable discs, as witnessed in a very large number of simulations. Finally, disc-like, or discy bulges form out of gas that concentrates to the inner parts of the disc under the influence of the gravitational torque of a bar, and subsequently forms stars. and it can not be recognised. Luckily, even deviations as small as 10∘ from end-on will reveal the bar/peanut feature (Lütticke, Dettmar & Pohlen, 2000, A05). Evidence for bars in edge-on systems can also be found from their photometry (Lütticke et al. , 2000). Indeed, in such cases, cuts along the equatorial plane reveal plateaux on either side of the center. Such plateaux are also seen in similar cuts in barred galaxy simulations (Fig. 6 in Athanassoula & Misiriotis (2002), hereafter AM02) where it can be verified that they extend roughly to the end of the bar. The existence of such plateaux on equatorial cuts is, however, not unambiguous evidence for the existence of a bar component, since these features can also be due to lenses.
Although considerable effort has been put into recognising bars in edge-on systems, very little has been done for near-edge-on systems. Bureau & Athanassoula (2005) have described the position velocity diagrams (hereafter PVDs) of simulations viewed under such an orientation, as well as the corresponding , , and profiles (see their Fig. 4). If, however, kinematical data are not available, then recognising a bar in such orientations is more difficult than in edge-on galaxies. Indeed, in such cases the boxy/peanut bulge does not clearly stick out of the equatorial plane, so that this diagnostic can not be used. Furthermore, no photometric analysis of simulations viewed under such orientations is available to predict what one should expect for the surface density profiles.
Although many disc galaxies are viewed at angles near to edge-on and a large fraction of them should have boxy/peanut bulges and bars, very few have been discussed in the literature. NGC 7582 has an inclination of approximately and, when viewed in the near infrared (Quillen et al. , 1997), allows for visual identification of both the bar and the peanut. Similar comments can be made for NGC 4442 (Bettoni & Galletta, 1994), viewed at approximately . M31, our nearest big neighbour, is near to edge-on and exhibits isophotal shapes similar to those of NGC 7582 and NGC 4442. Could it be barred? We will aim to answer this question by comparing results from -body simulations to the relevant data.
M31 (NGC 224) is an Sb type spiral galaxy, which has an
inclination angle of about . The isophotes of M31 have a twist
in the inner parts (Lindblad, 1956; , 1982) and in the
outer parts (Walterbos & Kennicutt, 1988), the latter presumably due
to a warp. In the main region
of the disc, however, the position angle is well defined and nearly
constant (see Fig. 7 of , 1982). We will thus
henceforth adopt a fiducial disc position angle of
(deVaucouleurs (1958) and later work). Further in, in the region often
referred to as the ‘bulge region’, the position angle is
to larger (Richter & Högner (1963) and later
work). The distance of M31 is estimated to be 783 kpc
(, 1998), which makes roughly equal to 2.28 kpc. In earlier
studies, however, it was assumed that is roughly equivalent to 2
kpc. For this reason, and in order to avoid confusion, we will here
use arc minutes to measure distances. Due to its proximity and
its interesting structure, M31 has been the subject of a very large
number of studies, of which a complete list of references
is beyond the scope of this paper. Amongst the older photometry,
we have used isophotal results from Lindblad (1956) and from deVaucouleurs (1958),
as well as position angle measurements from (1982).
More recently, M31 was observed by the 2MASS facility as part
of the “6X Survey”, going 1 magnitude deeper than the original
2MASS survey222See the 6X description at
http://www.ipac.caltech.edu/2mass/releases/allsky/doc/.
These images, in , and were analysed by
Beaton et al. (2006, hereafter Paper II) revealing important
morphological properties, especially of the bulge. It is these observational
results that originally motivated the work described here.
The idea that M31 is barred is not new. It was initially proposed by B. Lindblad (1956), based on the analysis of the isophotal shapes of a deep red exposure. Approximating the isophotes by ellipses, he found that, on the plane of the sky, their major axis is at an angle of roughly 10∘ south of the galaxy major axis and that the average projected axial ratio is 1.6. He proposed that the bulge is in fact a triaxial bar with axial ratios 1:0.56:0.28 or 1:0.56:0.36 and semi-major axis length around . Yet, the existence of a bar in M31 was generally not accepted and soon forgotten, so that hardly any of the very numerous subsequent papers on M31 mention this possibility. Stark (1977) returned to this conclusion with his calculation of a one-parameter family of triaxial models for the M31 bulge. Their axial ratio in the galaxy plane is about 1.6 to 1.8, depending on the angle of the bar major axis with the galaxy major axis. The two solutions initially proposed by Lindblad are members of this family. To distinguish between Stark’s models, Stark & Binney (1994) modeled the gas flow in the inner couple of arc minutes using a Ferrers ellipsoid and a spherical component. They propose that, measured on the plane of the galaxy, the angle between the bar semi-major axis and the projection of the line of sight onto the plane of M31 is about 20∘.
In this paper we will examine the possibility of M31 being a barred galaxy based partly on the photometric results of paper II and partly on observed kinematics (Brinks & Shane, 1984; Brinks & Burton, 1984; Rubin & Ford, 1970). The wealth of information provided by these results will allow us to go further than just debate on the possible existence of a bar. We will thus aim to find some of the main properties of this bar. It should, however, be clear that we will not present a complete model of M31, which would be well beyond the scope of the present paper, but we will instead try to investigate all the available observational clues in order to characterize and constrain the bar properties. This paper is organised as follows. Section 2 describes the simulations and Section 3 compares them to the photometrical observations of Paper II. The kinematics are presented in Section 4. We discuss our results in Section 5 and briefly summarise in Section 6.
2 Simulations
Both observed and simulated bars come in a large variety of lengths, strengths and shapes. We will thus not restrain ourselves to one single simulation to compare with the observations, but use four distinct cases, hoping to be able to set constraints on the parameters of the bar 333All simulations described here have live haloes. This is necessary since, as shown by Athanassoula (2002), in order for bars to evolve, the halo must be able to participate in the angular momentum exchange process and to respond to the disc evolution. Thus, in the simulations the halo must be live, i.e. composed of particles. Rigid haloes, i.e. haloes which are simply a non-evolving potential imposed on the disc particles, artificially hinder or quench bar formation. .
AM02 introduced and described two different types of bars, which they termed MD and MH, respectively. MD-type bars grow in galaxies in which the disc dominates the dynamics in the inner parts, i.e. are maximum disc galaxies with haloes with extended cores. On the other hand, MH-type bars grow in galaxies in which the halo has a small core, i.e. is centrally concentrated, so that the halo contributes as much as, if not more than, the disc to the dynamics in the bar region. The bars growing in these two types of galaxies have very different morphology and kinematics (AM02). MH-type bars are thinner and longer than MD types and their outline is rectangular-like, contrary to MD bars which have an elliptical-like outline. The amplitude of their = 4, 6 and even 8 Fourier components of the density reaches a considerable fraction of the amplitude of their = 2, contrary to MD-types in which the = 6 and 8 are negligible. The density profile along the bar major axis (face-on view) also differs in the two types of bars. In MH-types it has two plateaux, one on each side of the center, with abrupt drops at the end of the bar, while in MD-types it drops near-exponentially with distance from the center (Fig. 5 in AM02). Bars in MH-type models often have ansae and/or an inner ring, which is elongated, but not far from circular and has the same major axis as the bar, as inner rings observed in barred galaxies (Buta, 1986). Their side-on shape evolves first to boxy and then to a peanut or ‘X’ shape, in contrast to the MD-types for which the side-on outline stays boxy. The side-on velocity field of MH-types shows cylindrical rotation, while that of the MD-types does not. More information on these properties can be found in AM02. There is a clear connection between the bar morphology and the amount of angular momentum emitted by near-resonant material in the bar region and absorbed by near-resonant material in the halo, in the sense that more angular momentum has been exchanged in MH-types than in MD-type models (Athanassoula, 2005b). Furthermore, correlations have been found between the bar strength and the amount of angular momentum absorbed by the halo (Athanassoula, 2003).
Since MD and MH-type bars are so distinct, we decided to include one of each in our fiducial models. Our other two fiducial bars are also one MH and one MD type, but with a classical bulge component as well. In the notation of AM02, they are MDB and MHB types. It should be stressed at this point that, both in observations and in simulations, there is a continuum of bar types ranging between those described above. Furthermore, other parameters than the halo mass distribution influence the amount of angular momentum exchanged within a galaxy and therefore its bar strength. These include the responsiveness of the halo (in particular its velocity dispersion), the velocity dispersion in the disc (Toomre, 1964, the Q parameter) and the existence of a bulge component (Athanassoula, 2003). Thus, it is preferable to consider our four fiducial models as examples of bar types, rather than as absolute measures of the halo mass distribution. For simplicity and in order to facilitate links with previous work, we will refer to our four fiducial models as MD, MH, MDB and MHB.
The initial conditions of our four models are as described in AM02 and in Athanassoula (2003). Thus, the radial density distribution of the disc is exponential with mass and scalelength and its vertical distribution follows a law with scaleheight . Its radial velocity dispersion is given by the Toomre parameter (Toomre, 1964). The halo is described by eq. (2.2) of (1993) and has two characteristic radii, and , out of which the first one measures the core size and the second one the outer truncation. The bulge is described by a Hernquist sphere (, 1990) of mass and scalelength . All the models described here have = 1, = 1, = 0.2, = 5 and = 10. For the other parameters we have = (1.2, 1.2, 1, 1), = (5, 0.5, 5, 0.5), = (0, 0, 0.6, 0.4) and = (-, -, 0.6, 0.4), for models (MD, MH, MDB, MHB), respectively. Simulations were run using W. Dehnen’s treecode (Dehnen, 2000, 2002a), as described in AM02 and in Athanassoula (2003).
In these simulation there are about particles in the halo component and between 200 000 and 400 000 particles in the visible components (disc and classical bulge). These are amply sufficient for following the evolution of the run and the formation of the bar and boxy bulge. For accurate comparisons with the observed isophotes, however, one needs isodensities which have less noise than what is obtained with this number of particles. Rather than use some smoothing, which could also smooth out real features, we used the technique described in A05, which allows an increase the number of particles. Namely, we considered ten snapshots, closely spaced in time so that the bar will not have evolved much in between any two, except of course for its figure rotation. The shapshots were rotated, so that the major axis of the bar is at the same position angle in all ten cases, and then stacked. This increases the number of particles tenfold. We then assumed two-fold symmetry, i.e. symmetry with rotation by 180∘ and with respect to the equatorial plane. This allowed us to avoid asymmetries inconsistent with M31444The asymmetries in M31 are presumably linked to its two main companions, M32 and NGC 205, which are not included in the modeling here. and which would, therefore, make all comparisons more difficult. Thus, particle numbers were increased by a factor of 40 at the expense of a considerable amount of work before each display. This technique allows us to achieve isodensity contours with very little noise without applying any convolution which could have smoothed out characteristics of the isodensities as well as the noise.
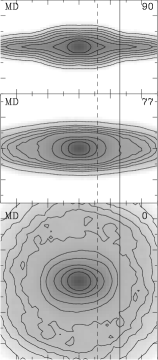
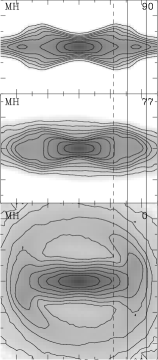
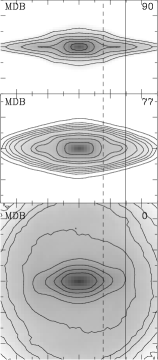
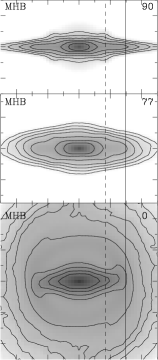
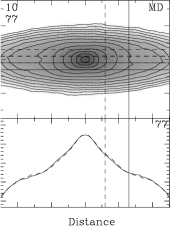
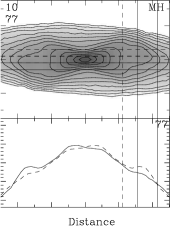
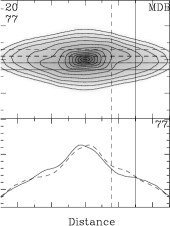
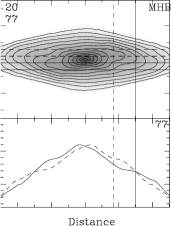
Face-on and side-on views of the luminous material (i.e. the disc and, for MHB and MDB, also the classical bulge) can be seen, respectively, in the lower and the upper panels of Fig. 1, respectively. Comparison of the face-on views shows that the MD bar is the fattest and shortest of the four and that its isodensities are elliptical-like. Model MH has the longest and strongest bar and its isodensities are rectangular-like. For the other two, the central parts of the isodensities, where the classical bulge contribution is very strong, are elliptical-like and the parts further out, where the bar dominates, are rectangular-like. This is similar to what is observed in many early type strongly barred galaxies (Athanassoula et al. , 1990). The MH bar is surrounded by an inner ring and the MHB bar has clear ansae.
The side-on views (upper panels) also present many differences. Model MD has a boxy-like shape, while MH displays a strong peanut, or ‘X’-like feature. It was shown in A05 that in cases with bulges the classical bulge material ‘fills’ up the central and off the equatorial plane parts, so that the outline becomes boxy-like. Indeed, models MHB and MDB have boxy-like shapes. Structures as those seen in these models are referred to as boxy/peanut bulges and have been observed in many edge-on galaxies (Lütticke et al. , 2000) and their link to bars is by now well established (A05 and references therein).
Since we can view our simulations both face-on and side-on, it is possible to obtain estimates of both the bar and of the boxy/peanut bulge extent. As discussed in AM02, there are several methods for doing this and their results show often considerable differences. For this reason, we adopted here very simple eye estimates. We obtained the bar length from the face-on view by finding by eye the extent of the last isophote which outlines the bar. The boxy bulge length was measured as a distance from the center and along the major axis on the side-on view. Within the boxy bulge extent, the distance of the isodensities from the equatorial plane either stays roughly constant (boxy bulges), or increases with increasing distance from the center (peanut, or ‘X’ shape bulges). Beyond the boxy bulge extent, the distance of the isodensities from the equatorial plane decreases with increasing distance from the center. Obviously there is some uncertainty in these determinations. However, if sufficient care is taken, these measurements can be as reliable as those based on other methods. The bar and the boxy/peanut bulge extent are given in Fig. 1 by the solid and dashed lines, respectively, and have been extended through all three panels to allow us to compare the two extents. Our figure shows clearly that the size of this boxy bulge is shorter than the bar length and that the part of the bar outside the boxy bulge region is vertically thin. This is in agreement with previous simulations and with orbital structure results (Patsis, Skokos & Athanassoula, Patsis et al. 2002) and has been discussed extensively in A05.
For model MH we plotted two solid lines, i.e. we give two possible estimates of the bar length. Indeed, if we consider that the bar stops where the ring starts, then the shortest of the two barlengths is the appropriate one. Alternatively, if we consider that the bar continues until the end of the ring, then it is the longest of the two barlengths that is appropriate. The two alternatives will be discussed further in Section 3.2.
The middle row in Fig. 1 gives an intermediate orientation, with the bar again along the x axis and a galaxy inclination of 77∘, i.e. similar to that of M31, so as to allow a first comparison. In the innermost region the classical bulge dominates and gives near-elliptical isodensities. The extent and shape of this region depends on the mass and scale-length of the classical bulge compared to the disc mass and scale-length. Somewhat further out the boxy bulge dominates. This is a part of the bar, which when seen face-on is not distinguishable from the bar (see e.g. bottom panels of Fig. 1). When the galaxy is seen edge-on and the bar side-on (i.e. with the line of sight along its minor axis) the boxy bulge is seen to swell out of the equatorial plane (upper panels of Fig. 1). When seen at an angle similar to that of M31, this gives a more or less (depending on the model) boxy outline. For some models this is similar to the outline of the isophotes in the boxy bulge region in M31, as will be seen in Sect. 3.1. The fact that it is the boxy bulge that dominates the dynamics and sets the isophote characteristics in this region led us to term this isophotal region as boxy region.
In regions further out than the boxy region the isophotal shape varies significantly from one model to another. For model MD the isophotes show no conspicuous feature and are rather similar to those in the boxy region. The isophotes in model MH show a very characteristic pinching toward the center from both sides of the bar minor axis (i.e. from above and below the galaxy major axis). This is similar in shape to the pinching that creates the peanut or the ‘X’ shape in the edge-on views and is in fact due to it. The part of the isophote that is near the bar major axis shows two strong protuberances on either side of the centre. The two remaining models (MHB and MDB) have in this region isophotes of similar shape, so they can be described together. Due to the high inclination and to the fact that the boxy bulge sticks well out of the equatorial plane, the boxy shape of the bulge will still be clearly visible near the minor axis. Near the major axis, however, there will be no contribution from the boxy bulge (because of its shorter extent) and one will see directly the outer part of the bar, which is vertically thin, i.e. does not extend much outside the equatorial plane. This contributes an extension, or elongation, of the isodensities towards the direction of the galaxy major axis and we will refer to the region where this is seen as the flat bar region.
3 comparison with the NIR photometry of M31
3.1 Comparison of observed isophotes with model isodensities
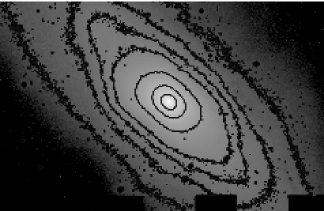
Fig. 2 displays the observed image of M31, presented and analysed in detail in Paper II. The isophotes show different characteristics in different regions of the galaxy. Starting from the center outwards, we first have a center-most region with elliptical isophotes, presumably due to the classical bulge. We then encounter a region where the isophotes are boxy-like (see second and third isophotes from the centre in Fig. 2). A similar region was seen in our models in the previous section and we called it the boxy region. Note, however, that contrary to the model, these boxy isophotes are skew with respect to the galaxy major axis, a feature that we will explain below. Beyond this region there is an abrupt change of the isophotal shape (see e.g. the fifth isophote from the centre in Fig. 2). Here two of the sides of the isophotes (the ones near the galaxy minor axis) are quite straight, similar to the shape of the isophotes in the boxy region. However, near the major axis, which is at 38∘, the isophotes have a clear elongation pointing to a direction somewhat, but not much, offset from the direction of the galaxy major axis. This is similar to what is seen in two of our fiducial models, namely the two models with a classical bulge. Thus, the shape of the M31 isophotes constitutes a strong argument that M31 is barred. Let us now examine whether they will allow us to go further and to set constraints on the bar parameters.
An important feature to note here is that the isophotes of M31 do not show any pinching towards the center and this allows us to eliminate very strong bars, such as those in model MH, as likely candidates for reproducing the isophotal structure of M31. Indeed, the horizontal and vertical structures of a bar are strongly coupled. As shown by the simulations of A05 (see also AM02), the strongest bars have clear peanut (or even ‘X’) shapes when viewed edge-on and side-on, while the less strong bars have a boxy side-on shape. This is in good agreement with the observational results of Lütticke et al. (2000), who showed that stronger bars have more prominent peanut shapes. Peanuts, however, and even more so ‘X’ shapes, have a narrowing of the isophotes/isodensities towards the center if there is no bulge component and this is preserved also for viewing angles not far from edge-on. Thus, strong bars viewed at such angles would always show this characteristic squeezing or pinching of the isophotes in the central parts and the fact that this is absent in M31 argues that its bar can not be very strong. The isodensities of the MD model also do not reproduce well the observed isophotes, since, in the flat bar region, they miss the characteristic elongation in a direction near to the galaxy major axis. Thus, MD-type bars are also inconsistent with the M31 bar. In fact, only the two models with a classical bulge, MHB and MDB, give a good representation of the isophotes in all the relevant region. Even those, however, do not reproduce the slight skewness of the isophotes (i.e. their asymmetry with respect to the galaxy major axis) in the orientation shown in the middle panels of Fig. 1. This, nevertheless, can be achieved if we consider a different viewing angle.
Three angles are necessary in order to determine the orientation of the M31 disc and bar, namely the inclination, the angle between the bar major axis and the galaxy major axis and the position angle of the galaxy. This third angle does not contain any physical information, and will not affect the comparison of isodensity and isophotal shapes. The constraints brought by our simulations to the inclination angle are not tight. For one thing, there is no way of distinguishing between front and back, since -body models do not contain dust. Moreover, the axial ratio of the inner isophotes is a function of three things : the inclination angle of the galaxy, the bar axial ratio in the galaxy equatorial plane (since a fatter bar will need to be viewed nearer to edge-on than a thinner one to give the same projected axial ratio) and the vertical extent of the bar material. Thus, the observed axial ratio in the inner regions can not determine uniquely the inclination angle.
In Fig. 3 we vary, for model MHB, the angle between the bar and the galaxy major axis, to check its effect on the isodensity shapes. When this angle is zero, i.e. when the bar lies on the galaxy major axis, all isodensities are symmetric with respect to this common axis, as expected. This symmetry is broken as soon as this angle becomes nonzero. Then the boxy isophotes in the inner parts become skew, while the elongation of the isodensities somewhat further out is offset from the galaxy major axis. Both these features are seen in the corresponding isophotes of M31, thus arguing that the bar in this galaxy is at an angle with the line of nodes. The direction of the skewness of the boxy isophotes and the direction at which the tips of the isophotes in the flat bar region are pointing gives an indication about the position angle of the bar. Both directions are pointing further to the SE of M31’s northern semi-major axis and this tells us that the position angle of the bar major axis is larger than the position angle of the galaxy. The amount of skewness and the corresponding isophotal shapes give us some constraints on the difference of these angles, as can be seen in Fig. 3. The best fits are for 20∘ and 30∘ (measured on the plane of the galaxy). Indeed, for 0∘ and 10∘ the asymmetries and skewness are insufficient, while angles of 40∘ and larger again do not give a good representation. It should be noted, however, that the exact values of this range may depend on the model.
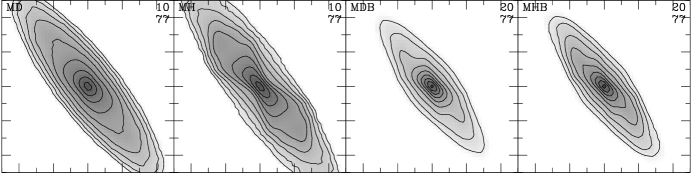
Fig. 4 uses appropriate orientations for all four models, to allow a full comparison with the M31 isophotes. It shows that, even with an optimum angle between the bar and the galaxy major axis, models MD and MH do not fare well. On the other hand, models MDB and MHB reproduce well the characteristic of the M31 isophotes, including the observed skewness. Thus, comparing isophotal and isodensity shapes has given us precious information on the existence and the properties of the M31 bar.
3.2 Radial luminosity and density profiles
In this section we compare radial luminosity profiles made along cuts on M31 as projected on the sky and radial density profiles obtained from the models in a similar way.
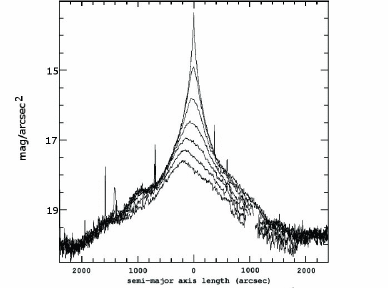
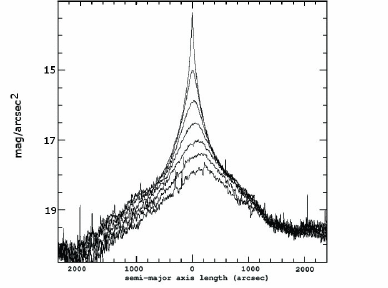
Using the image of Paper II, we obtained the radial luminosity profile on a cut along the galaxy major axis, as well as on cuts parallel to it but offset by multiples of either to the SE or to the NW. The results are given in Figs. 5 and 6, for the SE and the NW, respectively. In all profiles we note interesting asymmetries between the two sides. First, the position of the maximum drifts with respect to the center with increasing offset. For offsets to the NW, the maximum drifts towards the SW, while for offsets to the SE it drifts towards the NE. Note also that on the SE cuts there is a hump on the profiles to the NE of the center. In fact, one can see there a plateau ending at about from the nucleus, followed by a relatively steep drop starting at and ending roughly at . The intriguing thing here is that this plateau occurs only on the one side of the centre. Such an asymmetry is also seen on the cuts parallel to the galaxy major axis and offset to the NW of the galaxy (Fig. 5). In this case, however, the bump is on the SW side of the nucleus and is less prominent.
The existence of the humps and the asymmetry of their location on the cuts provide useful clues about the existence and the properties of the bar in M31. Indeed, the observations of Elmegreen & Elmegreen (1985) show such humps in similar cuts in strongly barred early type barred galaxies. In that paper, the cuts were made along the bar major axis and show that the humps are symmetrically located with respect to the nucleus. Such humps are also seen for model MH in AM02 (see their Fig. 5) and they are also symmetrically located on either side of the center. On the other hand, no such humps are seen in most late type barred galaxies (Elmegreen & Elmegreen, 1985), where the decrease of the density is exponential-like. A similar decrease is found for model MD in AM02 (their Fig. 5). This could be a clue that the M31 bar is more likely to be MH-type than MD-type.
Let us now follow the clues given by the asymmetric location of the bumps. Humps alone are not unambiguous evidence of the existence of a bar, since they can also be made by a lens-like structure with abrupt edges, even if the lens is circular or near-circular. Such a structure, however, could not be responsible for the M31 humps, since any axisymmetric, or near-axisymmetric, structure would place the humps symmetrically with respect to the nucleus. Thus, the existence and the asymmetry of the humps, when taken together, is an argument for the existence of a bar in M31. If the major axis of this bar coincided with the galaxy major axis, the humps would again be located symmetrically with respect to the nucleus. Thus, the asymmetry of the bump locations argues that they are due to a strongly non-axisymmetric feature, i.e. a bar, whose major axis is at an angle with respect to the galaxy major axis. This result is in good agreement with was found in the last section by comparing isophotes to isodensities.
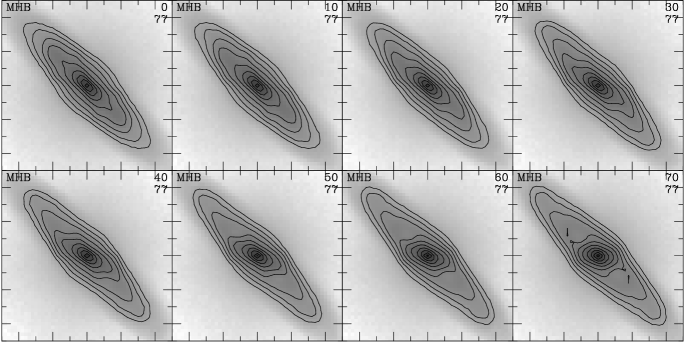
The location of the bumps can also give indications on the angle between the galaxy and the bar major axes, as well as on the length of the bar. We show this for our four fiducial models in Fig. 7. For models MH and MD we rotated the disc so that the left (eastern for comparison with observations) part of bar major axis is at an angle of 10∘ to the left (eastern) part of the galaxy major axis and then projected it to an inclination angle of 77∘. We did the same thing with models MDB and MHB, except that now we chose the angle between the bar and the galaxy major axis to be 20∘. We used 10∘ and 20∘, respectively, because isophote to isodensity comparisons (Sect. 3.1) show that these angles best reproduce the M31 observations. Other values of these angles will be discussed later in this section. The results are given in the upper panels of Fig. 7. We then make cuts parallel to the galaxy major axis with offsets above and below. The density along these cuts can be seen in the lower panels of Fig. 7. We find that the cuts for model MD are symmetric with respect to the center, the maxima in the two stripes coincide and there are no humps on either of the cuts. This argues strongly that an MD type model is a very unlikely candidate for the M31 bar. The cuts for model MH show an asymmetry, the maxima in the two stripes are offset and there are humps asymmetrically located, as in M31. The amplitude of these humps, however, is too large and thus this model is not a good candidate for M31. On the other hand, models MHB and MDB fare much better. Their profiles are asymmetric and in the same way as M31. In particular, the position of the maximum shifts from the center in the same direction as for M31, i.e. towards the left (eastern) part for cuts to the South and towards the right (western) part for cuts to the North. Furthermore, we note the existence of a single hump on each profile, located in the direction towards which the maximum of the profile is shifted, again in agreement with what is observed in M31. This argues that, as in the MHB and MDB models in Fig. 7, the eastern semi-major axis of the bar in M31 is to the South of the eastern galaxy semi-major axis. If it were to the North, then the asymmetries would be reversed. Thus, the sense of the asymmetries on the radial luminosity profiles give us constraints on the way the bar is oriented with respect to the galaxy major axis.
Such cuts give us information not only on the sign of the angle, but also constraints as to its value. We repeated the above analysis considering different angles between the bar and the galaxy major axis in steps of 10∘ (results not shown here). For model MD we find that no angle gives a reasonable fit. For model MH, the best fit is for an angle of 10∘, but, as can be seen in Fig. 7, even that is not good. For model MDB we find that the best fit comes for an angle of 20∘, but 30∘ is still good. Finally, for model MHB both 10∘ and 20∘ are good. Thus, we can conclude that the most probable angle is about 20∘. This is in good agreement with the range of values we found in the previous section. Adopting the M31 disc position angle of 38∘, this means that the position angle of the M31 bar is of the order of 45∘.
Further information can be obtained on the length of the bar. For this we plotted in Fig. 7 vertical lines at the radii at which we estimated the length of the bar and of the peanut component from the face-on and end-on views, respectively (Sect. 2). Note that the bar length is beyond the end of the flat part of the hump, nearer to the end of the abrupt drop after the plateaux. Using this, it is possible to make a rough estimate of the length of the bar in M31. As seen in Fig. 5, the flat part of the bump there extends till from the center, while the abrupt drop after the flat part extends from to . Thus, we can estimate the length of the bar in M31 to be of the order of . Of course this estimate has a considerable uncertainty, since we can not determine the end of the steep drop in the profile precisely either in the model, or in the data. There is a further uncertainty from the fact that the bar semi-major axis is at an angle to the galaxy semi-major axis, which we have only roughly constrained. Changes of the order of 2%, 5% or 14% are to be taken into account if this angle is 10∘, 20∘ or 30∘, respectively.
For model MH we plotted two vertical lines for the bar length, corresponding to the two estimates of the bar length given in Fig. 1. The shorter of the two is obtained if we consider that the bar ends where the ring starts and the longer one if we assume that the bar continues within the ring reaching its outer end. From Fig. 7 it is clear that the end of the sharp drop after the end of the plateau coincides with the second definition, giving the longer barlength. This, however, does not mean that it is this definition that is correct, since clearly the ring participates in the formation of the hump.
4 Kinematics
The kinematics of M31 have been well observed, both in the HI and the H. Our -body models, however, do not contain gas, so it is not possible to make any direct comparisons to the corresponding observations. Nevertheless, the observed gaseous kinematics give strong arguments for the existence of a bar in M31. For this reason, we will discuss here first the relevant observational results and then present simulated PVDs of the gas component in a strongly barred galaxy model from Athanassoula (1992a). Although this is an idealised model (with a Ferrers 1877 ellipsoidal bar) and not a simulation result as the four fiducial models we discuss here, it will, nevertheless, allow us to discuss some generic features of PVDs in barred galaxies.

The first clear kinematical clue that M31 is barred was contained in the data of Rubin & Ford (1970) but, at the time, was not interpreted as such. The velocity measurements from that paper, read off their Fig. 9, are reproduced in Fig. 8. They show a very deep minimum near , which is not observed normally in spiral galaxy rotation curves. This minimum, described as ‘the annoying deep minimum’ by Rubin (1994), provoked discussion, often going as far as to cast doubts as to the quality of the data.
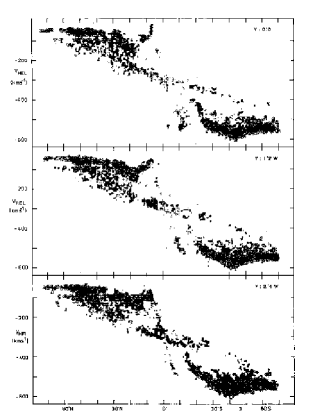
Brinks & Shane (1984) observed M31 in HI and gave a number of PVDs on cuts parallel, or perpendicular to the major axis. The cuts parallel to and near the major axis (some of which are reproduced in Fig. 9) show very interesting structure. In particular, they show two branches, separated by a low density region. In order to explain and reproduce these features, Brinks & Burton (1984) proposed a model of a rotating disc which flares and warps in its outer regions. According to their model, the inner branch would be due to gas near the galaxy major axis, which would imply that the rotation curve for that galaxy would be very sharply rising. It would then be the outermost gas which, projected onto the line of sight, is responsible for the lower branch (the one where the velocities rise slower with distance from the center). Their model reproduces a number of the main characteristics of the PVD diagrams (namely the existence of two branches through the center), but can not be qualified as a good fit to the data.
Rubin (1994) superposed the Rubin & Ford (1970) velocity measurements on the Brinks & Shane PVDs going through the center of the galaxy and found good agreement. She thus established that there was nothing wrong with the Rubin & Ford data and stressed that the low velocities should not be identified as rotational velocities. She also proposed that the complex velocities could be due to extra-planar gas in the innermost parts, without, however, showing that any such model could indeed reproduce the PVD characteristics. Thus, both Brinks & Burton and Rubin relied on extra-planar gas in the central and/or in the outer parts of the galaxy, but did not invoke the possibility of a bar. It was only a few years later that it became clear that such structures arise naturally if the galaxy is barred.
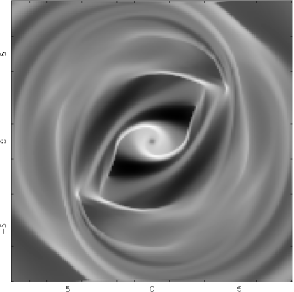
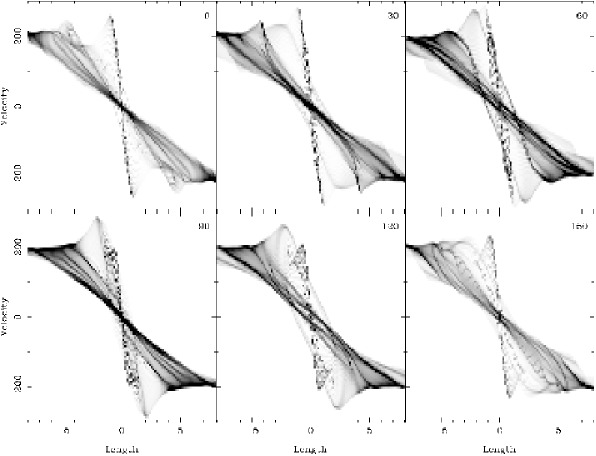
Structure such as seen in the above discussed PVDs has been witnessed in the observed emission line PVDs of edge-on galaxies with boxy or peanut bulges and was readily attributed to the bar (Kuijken & Merrifield, 1995; Merrifield & Kuijken, 1999; Bureau & Freeman, 1999). Indeed, gas responding to a strong bar potential does not fill the bar region uniformly, but, on the contrary, forms strong concentrations and relatively empty regions (Athanassoula, 1992b). This is illustrated in Fig. 10, which shows the gas response to a strong bar model (model 047 of Athanassoula (1992a)). We see that most of the bar region is relatively empty of gas except for the region surrounding the center and two narrow stripes along the leading edges of the bar. These are in fact the loci of shocks in the gas flow (Athanassoula, 1992b). Secondary concentrations can be seen surrounding the bar region and at the ends of the bar. As shown by Athanassoula & Bureau (1999), it is the existence of these high density and low density regions, together with the corresponding velocities, that creates the characteristic structures of the PVDs in barred galaxies. To show this, Athanassoula & Bureau (1999) obtained model PVDs by projecting edge-on some of the two-dimensional hydrodynamic simulations of Athanassoula (1992b). We repeat this for the model in Fig. 10 and display the result in Fig. 11. One can immediately see the two branches that stand out in the M31 PVDs, separated by a low density region. The inner branch is due to the gas near the center, where the flow lines are elongated roughly along the bar minor axis. The outer and lower of the two branches is due to material in the outer regions. The two branches are separated by low density regions on the PVDs, because the two regions are separated by low density regions in the face-on view of the bar.
Further comparison between Figs. 9 and 11 allows us to check whether the values for the bar position angle and length, as obtained from the photometry, are consistent with the observed PVDs. In the previous sections we found the best fit between models and observations when the angle of the bar major axis is around 20∘ from that of the galaxy major axis. This is near the viewing angle of the upper middle panel in Fig. 11. We note that in this case the contribution from the central part, i.e. the inner branch of the PVD, is a nearly straight segment passing through the center of the PVD, in agreement with the observations. Also, this segment rises to velocities higher than those of the outer parts, again in agreement with the observations555As explained in Athanassoula & Bureau (1999), this is due to the fact that in the central regions the gas flow lines follow roughly the orientation of the x2 family. The largest velocities occur of course near pericenter and would, in this region, be observed when the bar is viewed near side-on, as is the case.. Note that this latter check excludes a large value of the angle between the bar and galaxy major axes, as e.g. in the lower middle panel of Fig. 11. A further consistency check can be made with the bar length. From Fig. 11 it can be seen that the maximum extent of the low density region between the two branches of the PVD is somewhat smaller than the length of the bar semi-major axis. Applying this to Fig. 9 we see that the barlength of , which we estimated in Sect. 3.2 based on the photometry, agrees with the observed PVDs.
Unfortunately, the analysis of the kinematics can not be pushed any further than the discussion of generic bar features for many reasons. The bar model used in this section is an idealised bar model and not one of the four fiducial models discussed in the previous sections. Moreover, the PVDs of Fig. 11 were obtained by integrating along the line of sight a perfectly edge-on razor thin gas layer, whereas the inclination angle of M31 is 77∘, its gas layer is not razor-thin and this layer could also flare and warp in the outermost parts. Although this is far outside of the established bar region, it could still influence the PVDs if gas was folded onto the line of sight. This would give further branches on the PVDs. Indeed, the M31 PVDs (see Fig. 8 of Brinks & Shane, 1984) show suggestions of many more features which, due to the lack of gas in extended areas of M31, can not be followed clearly. For example, in many of the cuts one has the distinct impression that there are three branches. To model all these features fully is an interesting, but daunting task, further complicated by the lack of gas in some crucial regions, and well beyond the scope of this paper.


The stellar velocity field of our four models is given in Fig. 12. Unfortunately, no corresponding observational data is available, so these figures can only be considered as predictions. For the viewing angles we adopted the values found to be optimum in the previous sections, i.e. an angle between the bar and galaxy major axes of 10∘ for models MD and MH and to 20∘ for models MDB and MHB. The inclination angle was taken to be 77∘ in all cases. When calculating these velocity fields we included both the disc and, whenever relevant, the classical bulge material. This makes the effect of the bar less strong, but will allow comparisons with future observations.
The velocity field of model MD shows no clear-cut perturbations which could serve as clues to the existence of the bar. On the other hand, the isovelocities of model MH have sharp deviations due to the bar, which give them the form of a letter ‘Z’, as seen in many barred galaxies (e.g. Peterson et al. (1978)). Such deviations, but less clear cut, are seen also for models MDB and MHB. A telltale sign for the existence of a bar or of an oval is the fact that the kinematical and photometric minor axes do not align (Bosma, 1978, 1981). This would have been easily spotted for models MH, MDB and MHB, as well as in a very careful analysis of the velocity field of model MD.
5 Discussion
5.1 Comparison with previous work
Looking at the isophotes of M31 (Lindblad, 1956; deVaucouleurs, 1958, etc) one immediately sees that the part considered as the bar in previous work (Lindblad, 1956; Stark, 1977; Stark & Binney, 1994) is in fact the boxy/peanut bulge and in the last two papers was often termed as such. Thus, the ‘bar’ they propose should be shorter than ours, and also its angle with the northern semi-major axis of M31 should be larger. Indeed, this is the case. In our model the bar semi-major axis length is about , the angle between the galaxy and the bar semi-major axes is about 20∘ and the axial ratio in the equatorial plane larger than 2. In the previous models the ‘bar’ semi-major axis length is about , the angle between the major axes of the galaxy and the ‘bar’ is about 70∘ and the axial ratio in the equatorial plane smaller than 2. These latter numbers are in agreement with those of the boxy bulge of our model. A more precise comparison is not possible since the 2D shape of our boxy/peanut bulge is rectangular-like, while that assumed by Lindblad (1956), Stark (1977) and Stark & Binney (1994) is an ellipsoid.
5.2 Spiral Structure
The most prominent feature in M31 is a ring around . More precisely, this is a pseudo-ring, since it has an opening in the SW and its distance from the center is a function of the azimuth. On top of the bar we are advocating here, M31 has two companions (M32 and NGC 205), both of which can drive spirals and rings.
M32 (NGC 221) is a small companion in the SE quadrant of M31. Baade believed it to be below the plane of M31 and its systemic velocity is compatible with a near-circular orbit which is retrograde with respect to the sense of rotation of M31. Such an orbit excites an = 1 inner Lindblad resonance in the target disc and thus drives a 1-armed leading retrograde spiral, as was shown analytically by Athanassoula (1978a) and confirmed by -body simulations by Thomasson et al. (1989), Byrd & Howard (1992) and Vozikis & Caranicolas (1994). It can also be understood intuitively since a retrograde driving can not excite any 2-armed spiral666M32 has a mass of only a few percent of that of M31, so that, in order to drive a spiral structure whose amplitude is compatible with that observed, it needs to rely on a resonance. A simple back-of-the-envelope calculation shows that a companion on a retrograde orbit can not induce an =2 resonance, only an =1 one.. So, if the motion of M32 is indeed retrograde with respect to the sense of rotation in M31, one would expect to see a very tightly wound 1-armed leading spiral, comparable to a pseudo-ring, in a region compatible with the position and velocity of M32. Such a spiral component can indeed be found from the distribution of HII regions and OB associations, as has been shown by (1975), Simien et al. (1978) and Considère & Athanassoula (1982). This, together with other comparisons with the morphology and kinematics of M31, show that this is a plausible explanation to the M31 ring-like structure at a radius of roughly (, 1975; Athanassoula, 1978b; Simien et al. , 1978).
Braun (1991) describes the spatial distribution of the HI gas in M31 by a global two-armed trailing spiral and obtains a good fit if he allows variations of the orientation of the galaxy plane both with radius and azimuth (i.e. local line of nodes). He notes that these mid-plane departures lack bisymmetry and also make the existence of a massive dark halo unnecessary. He mentions two possibilities for the driving of the two-armed spiral, namely the bar-like triaxial bulge (Stark, 1977; , 1982, ; etc) and the nearby companion M32. He favours the second alternative due to the substantial departures from a planar gas distribution. Since he does not give a dynamical model providing information on whether the mass and velocity of M31 are compatible with the observed spiral features, it is not possible to assess this further.
(2006) also propose a model relying on M32, but without invoking any resonance. This, however, produces only a very large number of arms ( of the order of 10, see the central right panel of their Fig. 3) and no ring-like structure, i.e. a structure very unlike what is observed. Furthermore, if they use a mass of M32 in agreement with observations (Mateo, 1998), they find that ‘very little effect is seen in the M31 disc’, in agreement with what could be foreseen from the simple explanations given above. They, thus, artificially increase the mass of M32 by a factor of 5 with respect to Mateo’s estimate, suggesting that M32 could be more massive than originally thought.
How does our proposed bar fare with the observed pseudo-ring? Taking for the semi-major axis length of the bar a value of , as proposed in Sect. 3.2, we can set constraints on the location of corotation, which should necessarily be outside the bar (Contopoulos, 1980). Hydrodynamic simulations (Athanassoula, 1992b) have given a range of for the corotation radius and this agrees well with observational predictions (Elmegreen, 1996; , 2003, etc). This places corotation in the range . Assuming a flat rotation we then will have the outer Lindblad resonance of this pattern at . It should be noted that this error bar is based only on the range found from the hydrodynamical simulations, while, if we we took into account uncertainties on the end of the bar and on the form of the rotation curve, the error bar would be considerably larger. Thus, if the rotation curve in the relevant region is slightly rising (as shown e.g. in Carignan et al. , 2006), the location of the outer Lindblad resonance would be somewhat further out. For example, assuming that the velocity increases roughly as places outer Lindblad at . Barred galaxies are known to have outer rings and both analytical work (e.g. Schwarz, 1981) and statistical analysis of the ring radii (Athanassoula et al. , 1982; Buta, 1995) argue that these are placed at the outer Lindblad resonance. Given the uncertainties, we can say that the location of the ring in M31 is consistent with its being an outer ring due to the bar.
The two alternative explanations leading to a reasonable reproduction of the M31 ring are thus both linked to resonances. In the first one, the pseudo-ring is a very tightly wound one-armed spiral formed by a resonance with M32 rotating in a retrograde orbit around M31. In the second one, it would be formed at the outer Lindblad resonance of the bar. Is there any way of discriminating between the two alternatives? An argument in favour of the first explanation is that the observed ring is a pseudo-ring and its deviations from a ring are more of the than of the type. This, however, is not a strong argument, since these deviations could be due to the effect of M32 on a pre-existing closed outer ring. An argument in favour of the second explanation is that it is statistically more likely, and would make M31 a more ordinary galaxy, its pseudo-ring in good agreement with a structure commonly found in a large fraction of barred galaxies. Of course this is not on its own a sufficient reason to eliminate the first explanation, particularly since, if M31 was at a larger distance and observed with lower resolution, the tightly wound one-armed spiral would be confused with a standard outer ring so that several such structures could be actually observed and mis-interpreted. A more in depth modeling of M31 would be necessary to distinguish between the two possible explanations, or, better still, to produce a model in which both the effects of the bar and of the companions are taken into account. At this stage, we can only say that the second explanation is statistically more likely, but we still need to model the effect of M32 on the ring to see whether it is compatible with the observations.
5.3 Relative lengths of the bar and of the boxy bulge
Because of its viewing angle (near to but not quite edge-on), M31 brings crucial input to the issue of the relative bar and boxy bulge lengths. Both orbital structure studies and -body simulations argue that the extent of the boxy (or equivalently the peanut, or ‘X’) structure is shorter than that of the bar (Skokos, Patsis & Athanassoula, Skokos et al. 2002, Patsis et al. 2002, A05). Observational confirmation, however, is non-trivial, since the length of the bar can only be measured in near face-on galaxies and the length of the boxy bulge only in edge-on galaxies. The main input thus comes from edge-on galaxies on which the extent of the boxy bulge can be measured directly, while the length of the bar is inferred from the length of the plateau of the light profile on a cut along the equatorial plane (e.g. Lütticke et al. 2000; AM02; Bureau & Athanassoula 2005; A05). This measurement, however, is not very accurate, since the end of the plateau tapers off into the disc. It, nevertheless, provided clear evidence that the bar extends further out than the boxy bulge. M31 allows for a different way of comparing the two extents. Measuring along the major axis, one can delineate the region where the isophotes are boxy-like and the region where they have elongations pointing along the bar major axis, i.e. the regions named in Sect. 2 the boxy and the flat bar regions. The extent of these two regions provides us with the length of the boxy bulge and the length of the bar, respectively. This is well illustrated in Fig. 1. Here the length of the bar is obtained from the face-on views (lower panels) and shown with the full vertical solid lines, which are continued on the two other panels to show where the end of the bar lies in the edge-on and M31-like viewing angles. The length of the boxy bulge is obtained from the edge-on view (upper panels) and plotted with the dashed vertical lines, which are continued on the two other panels to show where the end of the boxy bulge lies in the face-on and M31-like viewing angles. Looking at the middle panel we see that the extent of the regions with the boxy isophotes and the extent of the region with the elongation towards the bar major axis indeed provide us with the boxy bulge length and the bar length, respectively.
Unfortunately, these lengths are not easy to measure directly from the isophotes. A better determination can be obtained from isophotal fits and calculation of the and coefficients along them. Such fits will be made and discussed in Paper II. The measurements we have here, although not as accurate, are still sufficient for inferring the type of periodic orbit families which are involved in the building of M31’s box. Using for bar semi-major axis length the value of and for the boxy bulge extent the value calculated by Stark & Binney (1994), i.e. gives a ratio of 1.4. Although this number has a large uncertainty, as discussed in the previous sections, it seems safe to say that it is less than 2. This limit is important since it gives us indications that the main families building the peanut are those linked to the higher order vertical resonances (e.g. families x1v3, or x1v4) and excludes the x1v1 family (Patsis, Skokos & Athanassoula, Patsis et al. 2002). It would be important to repeat this calculation for a number of galaxies seen at roughly the same orientation as M31 and showing similar features, to see whether the higher order families are always the most probable building blocks for boxy bulges.
5.4 Miscellanea
The comparisons of simulations to observations argue that M31 has two types of bulges, a boxy/peanut bulge and a classical bulge. In that it is not unique. In fact, judging from the fact that we see in many far-from-edge-on early type barred galaxies both a classical bulge and a strong bar (indicating the presence of a boxy/peanut bulge), a large fraction of early type barred galaxies should have the two types of bulges. In late types, there should be many cases with both a discy bulge (A05) and a boxy/peanut bulge, but the fraction will be more difficult to assess. Finally, in many galaxies all three types of bulges could coexist.
Our two ‘best’ models presented here are not meant to be an exact fit to M31. We presented four fiducial models to argue that M31 is barred and to set constraints on its bar properties. We have thus outlined a class of models which would give reasonable fits. Surely, by looking through a large number of models within that class it would have been possible to find some that gave better fits. This task, however, does not seem warranted for two reasons in particular. First, the free parameter space is very large. Indeed, little is known on the mass distribution of the halo (shape and radial profile) and even less about its velocity distribution. Even for the visible material, there is a lot of freedom in selecting . Furthermore, M31 has two companions, which will induce asymmetries which any thorough modeling should also take into account. Thus, a full model for M31 is well beyond the scope of this paper.
Sofue et al. (1994), using B, V, R and I photometry of the center-most parts of M31, revealed a small inner bar of semi-major axis length about . Its axial ratio is approximately 3 and it has dark lanes on its leading edges which are slightly curving in the trailing sense. This small bar has about the same colour and, therefore the same population as the bulge stars. Such inner bars are found in the innermost parts of roughly 30% to 40% of bars (Laine et al. , 2002; Erwin & Sparke, 2002).
The local group contains three large spiral galaxies – namely our own Galaxy, M31 and M33 – and all three were initially considered as unbarred. de Vaucouleurs, based on the so-called forbidden gas velocities towards the galactic center, proposed first in 1964 that our galaxy was barred and this is now considered as a well established fact (for a review see Dehnen, 2002b, and references therein). The first arguments that M31 is barred came in 1956 (Lindblad, 1956), and we have presented in this paper a number of strong arguments supporting this. Finally, images in the red, or NIR of M33 show that the spiral arms in that galaxy do not reach the center and that in between them there is indication of a small bar. It thus looks like the two, or perhaps even the three, largest spirals in our local group are barred. This is in good agreement with the results found in the NIR from larger samples of disc galaxies (Eskridge et al. , 2000; , Grosbøl et al. 2004; , 1999), showing that the vast majority of spirals is barred, although in some cases the bar is small.
The isophotal shapes of M31 are very characteristic of boxy galaxies, providing straightforward evidence for the existence of the bar. As previously discussed, NGC 7582 and NGC 4442 have a similar orientation. In particular, the isophotes of the latter (Bettoni & Galletta, 1994) have characteristics very similar to those of M31 (see their Fig. 2). As in M31, we can distinguish there the boxy and the flat bar region, as well as a similar skewness. Since these features are easily identified, it would be important to study a number of galaxies seen at roughly the same orientation as M31 and showing similar characteristics, in order to get more information on the relative extents of the peanut and the bar and from that infer which orbital families constitute the building blocks for boxy bulges.
6 Summary
In this paper we argue that M31 is a barred galaxy. Its bar is not as easily distinguished as it is in galaxies nearer to face-on, but it still leaves a number of strong clues, both in the photometry and in the kinematics. Our arguments are based on comparisons with -body simulations. Rather than using only one simulation, which would have allowed us to point out only the generic bar properties in M31, we use four models with a range of bar properties. In this way we can argue that there is a bar, as well as try to constrain the properties of this bar. Our four models are called MD, MH, MDB and MHB, respectively, for continuity with previous works. MD has the weakest of the four bars and MH the strongest. MDB and MHB have a classical bulge as well, contrary to the other two models which have only the boxy version.
Comparison between the isodensity curves from our models, projected in the same orientations as M31, and the M31 isophotes argues very strongly for the existence of a bar. It also allows us to say that MH is a very unlikely candidate for the M31 bar, since this model has a characteristic pinching of the isophotes in the central parts, totally absent from the observed isophotes of M31. The MD model is also a rather unlikely candidate, because its isodensities do not show the required shapes. On the other hand, the isodensities of our MDB and MHB models reproduce well the observed isophotes. Both show two distinct regions with characteristic isophotal shapes. The inner of the two regions is dominated in the models by the boxy bulge and so we call it the boxy region. From the similarity of the isodensities and the isophotes in this region we can infer that in M31 also it is dominated by the boxy bulge. Outside this region extends in the models the flat (vertically thin) bar, which gives to the isodensities characteristic elongations towards a direction near, but somewhat offset from the galaxy major axis. We call this region the flat bar region. Again these isophotal shapes are found in the M31 isophotes and we can thus attribute them to a bar. The M31 isodensities show also a characteristic skewness, which can be well reproduced by our MDB and MHB models provided the angle between the bar and the galaxy major axes is within a given range of values.
We also compared radial luminosity profiles from M31 – made along slits parallel to the galaxy major axis and offset either to the SE, or to the NW – to radial density profiles obtained from the models in the same way. Here again the bar has left a number of clues. The humps and asymmetries on the observed luminosity profiles argue clearly for the existence of a strongly non-axisymmetric component, such as a bar. Comparisons with the -body results allow us to constrain the models. Model MD can not reproduce observed luminosity profiles, while model MH reproduces them badly. It is again models MDB and MHB that give good fits. These comparisons also give constraints on the value of the angle between the galaxy and the bar major axes and the range thus obtained agrees well with that obtained with the help of the isophotes. Furthermore, these comparisons allow to give a rough estimate of the length of the bar major axis, which we can estimate to be of the order of .
The PVDs observed in the HI show also characteristic bar signatures. In particular there are two branches separated by an empty space. The inner branch is due to gas in the central region and the second one to gas outside the main bar region. The empty space is due to the lack of gas in the main bar region. These PVD diagrams also set constraints on the bar position angle and length. Both are in good agreement with the values found from the photometry.
From all these comparisons we can conclude that there exists very strong evidence that M31 is barred. In our two best models the bar is neither too strong, nor too weak and its major axis has a position angle of roughly 45∘, i.e. there is angle of about 20∘ between the galaxy and the bar semimajor axes in the plane of the galaxy. These models have both a classical and a boxy bulge. The length of the latter is smaller than that of the bar and the most probable backbone for the M31 boxy bulge are periodic families from families of the x1-tree, bifurcating from the x1 family at a higher vertical resonance, such as the the x1v3 or x1v4. A bar such as that of our models could create an outer ring, whose location would be in agreement with the pseudo-ring observed in M31 at roughly . This gives a second, alternative, explanation for the pseudo-ring.
Acknowledgments
We thank A. Bosma, S. Majewski, M. Bureau, P. Patsis and G. Aronica for stimulating discussions on boxy bulges and bars. EA thanks Jean-Charles Lambert for computing assistance. EA thanks the INSU/CNRS, the region PACA and the University of Aix-Marseille I for funds to develop the computing facilities used for the simulations discussed in this paper. RLB was funded under National Science Foundation grant AST-0307842 and a Space Interferometry Mission Key Project Grant, NASA/JPL contract 1228235, awarded to Steven Majewski (Principal Investigator). She thanks the University of Virginia Center for Undergraduate Research and the Harrison Undergraduate Research Awards program. This publication makes use of data products from the Two Micron All Sky Survey, which is a joint project of the University of Massachusetts and the Infrared Processing and Analysis Center/California Institute of Technology, funded by the National Aeronautics and Space Administration and the National Science Foundation.
References
- Athanassoula (1978a) Athanassoula, E., 1978a, A&A, 69, 395
- Athanassoula (1978b) Athanassoula, E., 1978b, In ‘ Structure and properties of nearby galaxies”, Symposium U.A.I. No 77, eds. E. Berkhuisen & R. Wielebinski, Reidel, Dordrecht, 163
- Athanassoula (1992a) Athanassoula, E., 1992a, MNRAS, 259, 345
- Athanassoula (1992b) Athanassoula, E., 1992b, MNRAS, 259, 328
- Athanassoula (2002) Athanassoula, E., 2002, ApJ, 569, L83 (A02)
- Athanassoula (2003) Athanassoula, E., 2003, MNRAS, 341, 1179
- Athanassoula (2005a) Athanassoula, E., 2005a, MNRAS, 358, 1477 (A05)
- Athanassoula (2005b) Athanassoula, E., 2005b, Cel. Mech. and Dyn. Astr., 91, 9
- Athanassoula et al. (1982) Athanassoula, E., Bosma, A., Creze, M., Schwarz, M. P., 1982, A&A, 107, 101
- Athanassoula & Bureau (1999) Athanassoula, E., Bureau M., 1999, ApJ, 522, 699
- Athanassoula & Misiriotis (2002) Athanassoula, E., Misiriotis, A. 2002, MNRAS, 330, 35 (AM02)
- Athanassoula et al. (1990) Athanassoula, E., Morin, S., Wozniak, H., Puy, D., Pierce, M. J., Lombard, J., Bosma, A., 1990, MNRAS, 245, 130
- Beaton+ (2006) Beaton, R. et al. 2006, ApJ submitted and astro-ph/0605239 (paper II)
- Bettoni & Galletta (1994) Bettoni, D., Galletta, G., 1994, A&A, 281, 1
- Bosma (1978) Bosma, A., 1978, Ph D thesis, Groningen
- Bosma (1981) Bosma, A., 1981, AJ, 86, 1825
- Braun (1991) Braun, R., 1991, ApJ, 372, 54
- Brinks & Shane (1984) Brinks, E., Shane, W. W., 1984, A&AS, 55, 179
- Brinks & Burton (1984) Brinks, E., Burton, W. B. 1984, A&A, 141, 195
- Bureau & Athanassoula (1999) Bureau M., Athanassoula, E., 1999, ApJ, 522, 686
- Bureau & Athanassoula (2005) Bureau M., Athanassoula, E., 2005, ApJ, 626, 159
- Bureau & Freeman (1999) Bureau M., Freeman K. C., 1999, AJ, 118, 2158
- Buta (1986) Buta, R. J., 1986, ApJS, 61, 609
- Buta (1995) Buta, R. J., 1995, ApJS, 96, 39
- Byrd & Howard (1992) Byrd G. G., Howard S., 1992, AJ, 103, 1089
- Carignan et al. (2006) Carignan, C., Chemin, L., Huchtmeier, W. K., Lockman, F. J., 2006, ApJ, in press
- Chung & Bureau (2004) Chung, A., Bureau M., 2004, AJ, 127, 3192
- Considère & Athanassoula (1982) Considère, S., Athanassoula, E., 1982, A&A, 111, 28
- Contopoulos (1980) Contopoulos, G., 1980, A&A, 81, 198
- Dehnen (2000) Dehnen, W., 2000, ApJ, 536, L39
- Dehnen (2002a) Dehnen, W., 2002a, J. Comp. Phys., 179, 27
- Dehnen (2002b) Dehnen, W., 2002b, In ‘Disks of Galaxies : Kinematics, Dynamics and perturbations’, eds. E. Athanassoula, A. Bosma and R. Mujica, PASP, 275, 105
- Elmegreen (1996) Elmegreen, B. G., 1996, In “Barred Galaxies”, eds. R. Buta, D. A. Crocker and B. G. Elmegreen, PASP, 91, 197
- Elmegreen & Elmegreen (1985) Elmegreen, B. G., Elmegreen, D. M., 1985, ApJ, 288, 438
- Erwin & Sparke (2002) Erwin, P., Sparke, L. S., 2002, AJ, 124, 65
- Eskridge et al. (2000) Eskridge P. B. et al. , 2000, AJ, 119, 536
- (37) Ferrers, N. M. 1877, Q.J. Pure Appl. Math., 14, 1
- (38) Gerssen, J., Kuijken, K., Merrifield, M. 2003, MNRAS, 345, 261
- (39) Gordon, K. D. et al. 2006, ApJ, 638, L87
- (40) Grosbøl, P., Patsis, P. A., Pompei, E., 2004, A&A, 423, 849
- (41) Hernquist, L., 1990, ApJ, 356, 359
- (42) Hernquist, L., 1993, ApJS, 86, 389
- (43) Hodge, P. W., Kennicutt, R. C. 1982, AJ, 87, 264
- (44) Holland, S., 1998, AJ, 115, 1916
- (45) Kalnajs, A. J. 1975, in “La Dynamique des galaxies spirales”, ed. L. Weliachew, editions CNRS, 241, 103
- (46) Knapen, J. H., 1999, in “The Evolution of Galaxies on Cosmical Timescales”, ed. J. E. Beckman and T. J. Mahoney, PASP 187, 72
- Kuijken & Merrifield (1995) Kuijken, K., Merrifield, M. R., 1995, ApJ, 443, L13
- Laine et al. (2002) Laine, S., Shlosman, I., Knapen, J. H., Peletier, R. F., 2002, ApJ, 567, 97
- Lindblad (1956) Lindblad, B., 1956, Stockholms Observatorium Annaler, Band 19, No. 2
- Lütticke et al. (2000) Lütticke, R., Dettmar, R.-J., Pohlen, M., 2000, A&A, 362, 435
- Merrifield & Kuijken (1999) Merrifield M. R., Kuijken K., 1999, A&A, 345, L47
- Mateo (1998) Mateo, M. L. 1998, ARA&A, 36, 435
- Patsis et al. (2002) Patsis, P. A., Athanassoula, E., Grosbøl, P.,Skokos, Ch., 2002, MNRAS, 335, 1049
- (54) Patsis, P. A., Skokos, H., Athanassoula, E., 2002, MNRAS, 208, 437
- Peterson et al. (1978) Peterson, C. J., Rubin, V. C., Ford, K., Thonnard, N., 1978, ApJ, 219, 31
- Quillen et al. (1997) Quillen, A. C., Kuchinski, L. E., Frogel, J. A., DePoy, D. L., 1997, ApJ, 481, 179
- Richter & Högner (1963) Richter, N., Högner, W., 1963, AN, 287, 261
- Rubin (1994) Rubin, V., 1994, AJ, 108, 456
- Rubin & Ford (1970) Rubin, V., Ford, 1970, ApJ, 159, 379
- Schwarz (1981) Schwarz, M. P., 1981, ApJ, 247, 77
- Simien et al. (1978) Simien, F., Athanassoula, E., Pellet, A., Monnet, G., Maucherat, A., Courtes, G., A&A, 67, 73
- (62) Skokos, H., Patsis, P. A., Athanassoula, E., 2002, MNRAS, 333, 847
- Sofue et al. (1994) Sofue, Y., Yoshida, S., Aoki, T., Soyano, T., Tarusawa, K., Hamabe, M., Wakamatsu, K., 1994, PASJ, 46, 1
- Stark (1977) Stark, A. A. 1977, ApJ, 213, 368
- Stark & Binney (1994) Stark, A. A., Binney J., ApJ, 1994, ApJ, 426, L31
- Toomre (1964) Toomre, A., 1964, ApJ, 139, 1217
- Thomasson et al. (1989) Thomasson, M., Donner, K. J., Sundelius, B., Byrd, G. G., Huang, T.-Y., Valtonen, M. J., 1989, A&A, 211, 25
- deVaucouleurs (1958) de Vaucouleurs, G.. 1958, ApJ, 128, 465
- Vozikis & Caranicolas (1994) Vozikis, Ch. L, Caranicolas, N. D., 1994, A&A, 288, 448
- Walterbos & Kennicutt (1988) Walterbos, R. A. M., Kennicutt, R. C., 1988, A&A, 198, 61