Probing the Pulsar Wind Nebula of PSR B0355+54
Abstract
We present XMM-Newton and Chandra X-ray observations of the middle-aged radio pulsar PSR B0355+54. Our X-ray observations reveal emission not only from the pulsar itself, but also from a compact diffuse component extending in the opposite direction to the pulsar’s proper motion. There is also evidence for the presence of fainter diffuse emission extending from the point source. The compact diffuse feature is well-fitted with a power-law, the index of which is consistent with the values found for other pulsar wind nebulae. The morphology of the diffuse component is similar to the ram-pressure confined pulsar wind nebulae detected for other sources. The X-ray emission from the pulsar itself is described well by a thermal plus power-law fit, with the thermal emission most likely originating in a hot polar cap.
Subject headings:
pulsars: individual (PSR B0355+54) – stars: neutron – X-rays: stars1. Introduction
Isolated pulsars constitute one of the most powerful laboratories for studying particle acceleration in astrophysics. A significant fraction of the energy from rotation-powered pulsars is converted into a wind (Rees & Gunn, 1974), which travels at a velocity close to the speed of light. The interaction of this pulsar wind with the ambient medium produces a shock and acceleration of the relativistic particles at the shock generates synchrotron emission. This non-thermal diffuse emission manifests itself as a pulsar wind nebulae (PWN) or plerion at radio and X-ray energies (e.g. Rees & Gunn, 1974; Gaensler, 2001). Due to the short synchrotron lifetimes of high energy electrons, X-ray emission from a PWN directly traces the current energetics of the pulsar. The spectral and morphological characteristics of an X-ray PWN therefore reveal the structure and composition of the pulsar wind and the orientation of the pulsar’s spin axis and/or velocity vector.
The middle-aged 156 ms radio pulsar PSR B0355+54 is known to emit X-rays (Helfand, 1983; Seward & Wang, 1988; Slane, 1994) and gamma-rays (Bhat et al., 1990). Helfand (1983) reported the first detection in X-rays of the source using data from Einstein, stating that emission extended from the pulsar. However, Seward & Wang (1988) analyzed the Einstein data and concluded that while there was evidence for weak emission from the source position, emission from the pulsar itself was not detected. Nevertheless, they did not rule out the possibility that the emission could be associated with a PWN. Slane (1994) detected PSR B0355+54 in a 20 ks ROSAT observation, but owing to the lack of counts it was not feasible to perform a spectral analysis. The analysis of the ROSAT data also led to the detection of faint extended emission from the pulsar position, but Slane (1994) did not believe there was enough evidence to support a link between the source and the extended emission.
In this paper, we report on XMM-Newton and Chandra observations of PSR B0355+54 which we use to investigate the presence of diffuse emission that can be attributed to a PWN.
2. Observations and Data Reduction
PSR B0355+54 was observed with XMM-Newton on 2002 February 10 for 29 ks. We used data from the European Photon Imaging Camera (EPIC) PN instrument (Strüder et al., 2001) for the spatial, spectral and timing analysis. The PN was configured in small window mode and the thin blocking filter was used. Data from the MOS1 instrument (Turner et al., 2001) was also used for the spatial analysis. The MOS1 was operated in full window mode with the medium filter. We reduced the EPIC data with the XMM-Newton Science Analysis System (SAS version 6.1.0). In order to maximize the signal-to-noise ratio for our XMM-Newton observation, we filtered the data to include only single, double, triple and quadruple photon events for the MOS1, and only single and double photon events for the PN. Data were filtered to exclude events that may be incorrect, for example those next to the edges of the CCDs and next to bad pixels. We only included photons with energies in the range keV.
PSR B0355+54 was observed for 66 ks on 2004 July 16 with the ACIS-S array on Chandra in the very faint timed exposure imaging mode. We performed standard data processing using CIAO version 3.2. The data were filtered to restrict the energy range to keV and to exclude times of high background.
3. Spatial Analysis
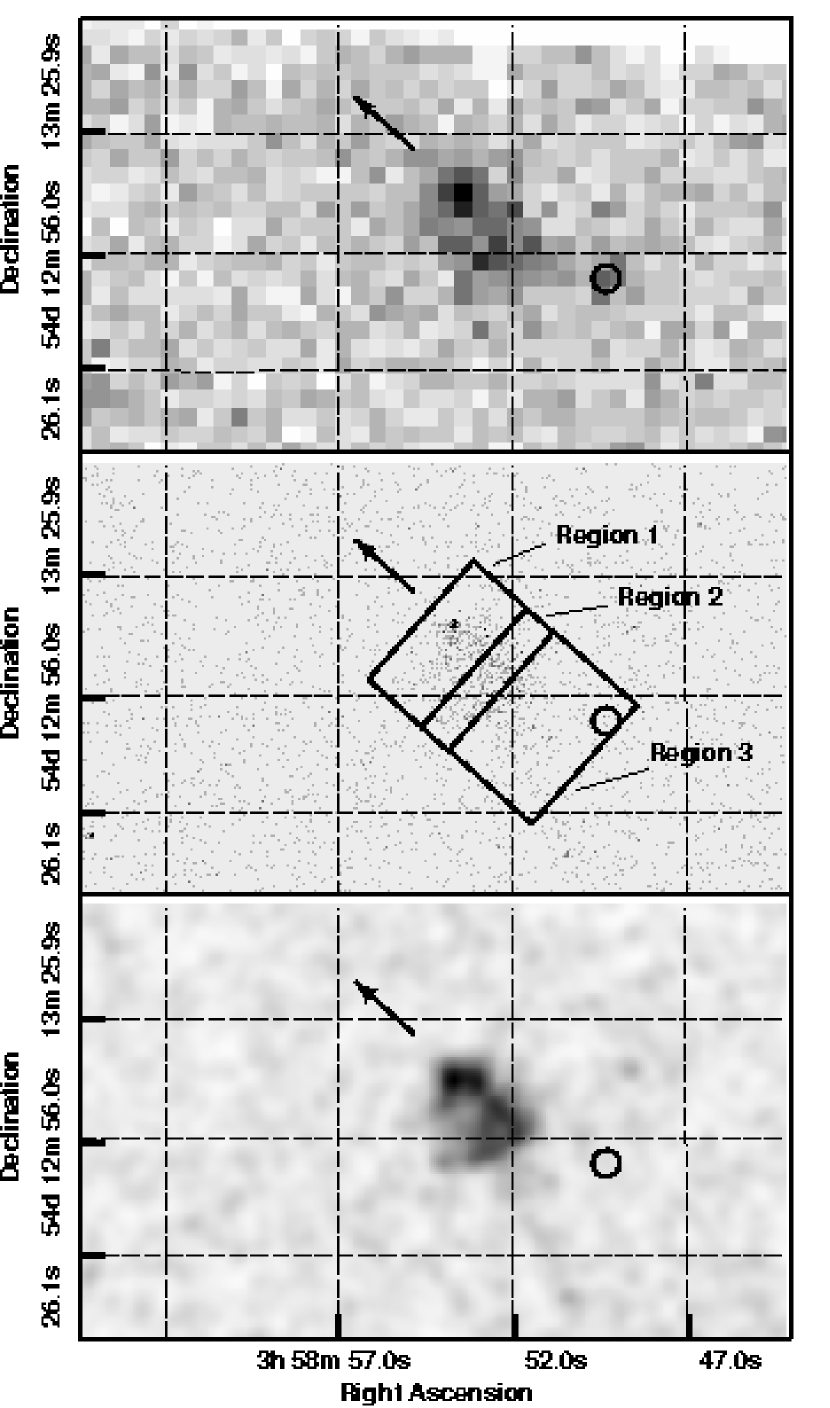
Initial inspection of the images created from the EPIC-PN and EPIC-MOS1 data show relatively strong emission at the pulsar position and evidence for extended emission near to PSR B0355+54 (see Figure 1, top panel). We generated a mosaic of the PN and MOS1 images and measured the X-ray source positions using the SAS source detection tool EDETECT_CHAIN. We compared the positions of the field stars in our observation with the positions from optical catalogs to determine an astrometric correction. This correction was applied to the X-ray coordinates of the pulsar, resulting in R. A. = , decl. = (J2000), with an rms error of . This position lies from the radio position.
To confirm the presence and examine the extent of the diffuse emission in the XMM-Newton data we have compared the detected PN emission with that for a point source. We calculated the intensity for the pulsar by using bilinear interpolation at regularly spaced points along the direction of proper motion of PSR B0355+54 (Chatterjee et al., 2004). We compared this profile with the XMM-Newton point-spread function (PSF) for the PN at 1.5 keV, which we generated using the King profile parameters included in the XMM-Newton calibration file ”XRT3_XPSF_0006.CCF.plt”111See http://xmm.vilspa.esa.es/docs/documents/CAL-SRN-0100-0-0.ps.gz for more information. In Figure 2 (top panel) we show the profiles for the pulsar and the PN PSF.
The positions of the X-ray sources for the ACIS data were determined using the CIAO source detection tool WAVDETECT. The image does not contain enough sources with known counterparts to perform an astrometric correction to the coordinates. A point source is detected at R. A. = , decl. = (J2000), which is away from the radio pulsar position. This source is consistent with being the X-ray counterpart of the pulsar.


The ACIS image also reveals a faint tail of emission in the opposite direction to the pulsar’s proper motion (see Figure 1, middle and bottom panels). Again we determined the net counts from the source and diffuse emission at regularly spaced intervals along the direction of the pulsar’s proper motion. We generated a PSF for PSR B0355+54 using the Chandra PSF library evaluated at 1.5 keV and the location relevant to our source. The PSF was normalized to the total counts in PSR B0355+54. We calculated the net counts for the PSF in the same intervals as for PSR B0355+54. The source and PSF profiles are shown in Figure 2 (bottom panel).
The XMM-Newton PN image shows emission south west of the pulsar which could be a source, however, there is no corresponding emission at this position in the Chandra ACIS image (see Figure 1). We performed wavelet analysis on the Chandra data which confirms there is no source detected. Comparison of the XMM-Newton field of PSR B0355+54 with the Digitized Sky Survey does not show any optical source at the position of the south west emission. If the emission in the XMM-Newton data is real, it suggests that the diffuse emission could be varying over time.
We smoothed the Chandra ACIS image with a Gaussian of width (Figure 1, bottom panel), the resulting image suggests that there are two regions of enhanced diffuse emission – one near to the pulsar and the other away. The intensity profiles for the XMM-Newton and Chandra data indicate that the core of the X-ray emission lies within of the pulsar position. Both emission profiles indicate that the diffuse emission extends out to , with the bulk of the emission lying within of PSR B0355+54. The profiles also show evidence for a dip in the emission at agreeing with the smoothed ACIS image.

Detection of emission from PSR B0355+54 at distances of to from the source position i.e. on a larger scale than shown in Figure 1, have been reported by Helfand (1983), Seward & Wang (1988) and Slane (1994), see also Tepedelenlioǧlu & Ögelman (2005). Visual inspection of a smoothed version of the MOS1 image indicates that there is a region of enhanced emission extending a few arcminutes south of the pulsar, orientated closer to North than the diffuse emission we have reported above. The intensity of the MOS1 emission in this direction was determined using bilinear interpolation at regularly spaced intervals from the source. We show in Figure 3 the distribution of counts as a function of distance from the source compared to the mean background. Our analysis suggests that there is an excess of counts at and from the point source.
| Model | (dof) | ||||
|---|---|---|---|---|---|
| ( cm-2) | ( K) | (erg cm-2 s-1) | |||
| PL | 0.7 (16) | ||||
| BB | 1.0 (16) | ||||
| BB + PL | 0.7 (14) | ||||
| NSA | 0.9 (16) | ||||
| NSA + PL | 0.8 (14) |
Note. — The last column is the unabsorbed flux in the 0.3–10 keV range. In the case of the NSA model the mass and radius of the neutron star are fixed at and km, respectively, and the magnetic field of the neutron star is fixed at G. The errors quoted are the 90% uncertainties.
4. Spectral Analysis
In order to investigate the properties of the X-ray emission from PSR B0355+54 and the compact () diffuse nebula, we compared the spectra extracted from different spatial regions. Our results from the spatial analysis suggest that the core of the pulsar emission lies within of the pulsar’s position. However, in the case of the XMM-Newton data, this size of aperture does not contain enough counts for a meaningful analysis.
The pulsar spectrum has been extracted from the XMM-Newton observation using a circular region of radius , centered on the pulsar’s radio position. The background was extracted from a region of similar size offset from the pulsar position. The total counts contained in the source region is 1143 with an estimated 562 from background. The spectrum was regrouped by requiring at least 50 counts per spectral bin. We created a photon redistribution matrix (RMF) and ancillary region file (ARF) for the spectrum. The subsequent spectral fitting and analysis was performed using XSPEC, version 11.3.1.
We modeled the spectrum in the keV range. Initially we fitted the spectrum with single-component models including absorbed power-law, blackbody and magnetized, pure H atmospheric (Pavlov et al., 1995) models. The spectrum is best-fitted with a power-law with index and column density cm-2. This value for the power-law index is similar to the values found for other PWNe (e.g. Kaspi et al., 2005). The Galactic hydrogen column in the direction of PSR B0355+54 is cm-2. The fit results in an unabsorbed 0.3–10 keV energy flux of ergs cm-2 s-1. We also fitted the spectrum with blackbody plus power-law and atmospheric plus power-law models, both modified by photoelectric absorption. The multi-component models give similar values for reduced , however the temperatures implied by the fits are poorly constrained. It is likely that the presence of the pulsar wind nebula, and being unable to separate the pulsar core and diffuse emission, effects our ability to constrain the thermal component in the spectral fits of the XMM-Newton data. The results of the XMM-Newton spectral fitting are given in Table 1. The XMM-Newton spectrum with the best-fitting power-law model is shown in Figure 4.

For the Chandra data we extracted a spectrum for the core of the pulsar emission from a circular region of radius centered on the radio position. An annulus centered on the pulsar position was used to extract the background, with inner and outer radii of and , respectively. We find a total of 244 counts contained in the source region, with 29 counts attributed to background. We created the RMF and ARF files using standard CIAO tools. Before fitting the spectrum we regrouped the data, requiring a minimum of 15 counts per spectral bin.
We fitted the spectrum in the energy range keV using the same models as for the XMM-Newton data. In the first instance we let the neutral hydrogen column density be a free parameter; however this led to unreasonably small values for . Subsequently we fixed the column density at the value found from the power-law fit to the XMM-Newton spectrum of PSR B0355+54. We find that the Chandra spectrum can also be characterized by a power-law. The model has a power-law index of which is consistent within the 90% uncertainties to the value found from the XMM-Newton data. However, in the case of the Chandra data we find that a thermal plus power-law model provides a better fit statistically. The data are equally well-fitted by a blackbody plus power-law and a magnetized, pure H atmospheric (Pavlov et al., 1995, “nsa” model in XSPEC) plus power-law model. The results of the Chandra spectral fitting are given in Table 2.
| Region | Model | (dof) | ||||
|---|---|---|---|---|---|---|
| ( K) | km | (erg cm-2 s-1) | ||||
| Core | PL | 0.5 (34) | ||||
| BB | 1.4 (34) | |||||
| BB + PL | 0.3 (32) | |||||
| NSA | 0.48 | 9.5 | 3.6 (34) | |||
| NSA + PL | 0.4 (32) | |||||
| Diffuse – all | PL | 1.0 (50) | ||||
| Diffuse – 1 | PL | 1.0 (16) | ||||
| Diffuse – 2 | PL | 1.4 (16) | ||||
| Diffuse – 3 | PL | 1.2 (17) |
Note. — The neutral hydrogen column density has been fixed at cm-2 in all of the fits. The last column is the unabsorbed flux in the 0.3–10 keV range. In the case of the NSA model the distance to the source is fixed at kpc, the mass of the neutron star is fixed at , and the magnetic field of the neutron star is fixed at G. The errors quoted are the 90% uncertainties.
For the blackbody plus power-law model the best-fit parameters are a power-law index of and temperature of K. Using a distance to the source of kpc (Chatterjee et al., 2004), this implies a blackbody emitting radius of km. This value is too small to be reconciled with the radius of the neutron star and would indicate that the origin of the emission is a hot polar cap. We find an unabsorbed 0.3–10 keV energy flux of ergs cm-2 s-1. The magnetized, pure H atmospheric plus power-law model best-fit parameters are a power-law index of , temperature of K, and a radius for the neutron star of km. For this fit the distance to the source and the mass of the neutron star were fixed at kpc and , respectively. The magnetic field of the neutron star was fixed at G (this is a good approximation since the pulsar magnetic field as inferred from radio timing properties is G, Hobbs et al. 2004; Manchester et al. 2005). The unabsorbed 0.3–10 keV energy flux for this fit is ergs cm-2 s-1. The Chandra spectrum of the core emission from PSR B0355+54 is shown in Figure 5 with the best-fitting blackbody plus power-law model (top) and magnetized, pure H atmospheric plus power-law model (bottom).


To analyze the compact diffuse emission we created a new events file in which the emission from the pulsar core was removed. We extracted a spectrum for the diffuse component from a rectangular region of , centered on the emission and orientated along the direction of the pulsar’s proper motion. The background was extracted from a region of similar size offset from the diffuse emission. The diffuse component extraction region contains 1207 counts, with an estimated 414 counts due to background. We created the RMF and ARF files using standard CIAO tools. Before fitting the spectrum we regrouped the data, requiring a minimum of 15 counts per spectral bin. We modeled the spectrum over keV with an absorbed power-law, keeping the column density fixed at cm-2. The best-fit has a power-law index of and unabsorbed 0.3–10 keV energy flux of ergs cm-2 s-1.


In order to investigate the possibility of spectral evolution along the extended X-ray emission we created spectra for three regions of the compact diffuse emission. The sizes of the regions were chosen with the aim of having similar numbers of counts in each region. The three extraction regions, orientated along the direction of proper motion, are as follows, region 1: , contains a total of 396 counts with 130 attributed to background, region 2: , contains a total of 356 counts with 69 attributed to background, region 3: , contains a total of 454 counts with 214 attributed to background (see Figure 1 (middle panel)). The background was extracted from the same region as above. We created response files for each region and regrouped the spectra, requiring a minimum of 15 counts per spectral bin. The spectra were fitted in the keV energy range with a power-law and fixed column density of cm-2. We find the best-fit power-law indices for regions 1–3 are , and , respectively. Due to the uncertainties on the indices the presence of any spectral variability remains unclear. The unabsorbed 0.3–10 keV energy fluxes are , and ergs cm-2 s-1, respectively. The Chandra spectra of the diffuse emission from regions 1–3 are shown in Figure 6 (first–third panel) with the best-fitting power-law models.
We have also tried to determine if there are any spectral changes by using the hardness ratio , which is defined as the ratio of counts above 2.0 keV to that below 2.0 keV. For the whole of the compact diffuse component we find . Regions 1, 2 and 3 have , and , respectively. Due to the uncertainties, no particular trends in hardness ratio can be determined from one region to the next.
5. Timing Analysis
We barycentrically corrected the photon arrival times in the XMM-Newton PN event file before performing the temporal analysis. We extracted data for the source from circular regions of and centered on the pulsar position. The total counts encompassed in these regions are 391 and 1143 respectively, with the background contributing 151 and 562 counts, respectively.
In order to search for an X-ray modulation at the PSR B0355+54 spin frequency, we first determined a predicted pulse frequency at the epoch of our XMM-Newton observations, assuming a linear spin-down rate and using the radio measurements (Hobbs et al., 2004; Manchester et al., 2005). We calculate Hz at the midpoint of our observation (MJD 52315.7). As glitches and/or deviations from a linear spin-down may alter the period evolution, we then searched for a pulsed signal over a wider frequency range centered on Hz. We searched for pulsed emission using two methods. In the first method we implement the test (Buccheri et al., 1983), with the number of harmonics being varied from 1 to 5. In the second method we calculate the Rayleigh statistic (de Jager, 1991; Mardia, 1972) and then calculate the maximum likelihood periodogram (MLP; see e.g. Zane et al. 2002) using the statistic (Cash, 1979) to determine significant periodicities in the data sets.
The frequency search of the data extracted from an aperture of radius does not yield any significant peaks near to the predicted frequency with either search method. From our spatial analysis we know that the core of PSR B0355+54’s emission lies within of the pulsar position. We have therefore also searched for pulsed modulations in data extracted from a smaller aperture, however we have used a radius of as any smaller does not encompass enough counts for a meaningful analysis.

The most significant -statistic occurs for . With the number of harmonics equal to one, the -statistic corresponds to the well known Rayleigh statistic. We find three peaks with % significance in the MLP, all with corresponding peaks from the -test (see Figure 7). The dominant peak from the -test occurs at Hz, with the corresponding peak in the MLP occurring at Hz. The uncertainties quoted are the 68% confidence limits on the position of the peak. Both frequencies are consistent, within the 68% contour, with the predicted pulse frequency, and with each other within the 90% contour. The second most prominent peak from the -test, and the corresponding peak in the MLP, are not consistent with the predicted pulse frequency.
While we have detected a frequency that is in agreement with the predicted pulse frequency for PSR B0355+54 we caution that the peak has a probability of chance occurrence of . Further observations of the source are needed to show whether the modulation detected is in fact pulsed X-ray emission from PSR B0355+54. We have folded the data on the predicted pulse frequency and the frequency found from the -test (see Figure 8); by fitting the profiles with a sinusoid we find that the modulation amplitude for the former is % and % for the latter.


6. Discussion
Our spatial analysis of the XMM-Newton and Chandra observations of PSR B0355+54 have not only revealed X-rays from the pulsar, but have provided definitive proof of diffuse emission extending in the opposite direction to the pulsar’s proper motion. Similar detections of extended emission have been seen for other sources (e.g. N157B, Wang & Gotthelf 1998; PSR B1757-24, Frail & Kulkarni 1991; Kaspi et al. 2001; PSR B1957+20, Stappers et al. 2003; PSR B1951+32, Li et al. 2005), and have been interpreted as emission from a ram-pressure confined PWN.
We cannot separate the core and diffuse emission components for the XMM-Newton data and find that the spectrum can be well-fitted with a power-law model with index , similar to the value found for other PWNe (Kaspi et al., 2005). The nebular emission is most likely dominating the spectrum. The core emission from the Chandra data can be well-fitted by a thermal plus power-law model. A fit with a blackbody plus power-law model gives K and . The fitted blackbody flux corresponds to an emitting radius of km, where the distance to the source is 1.04 kpc. In this case, the size of the emitting region implies that the flux originates from a hot polar cap. We can also fit the spectrum with a pure H, magnetized atmospheric plus power-law model. With the distance to the source fixed at 1.04 kpc, this fit results in K, and km. Taking into account the possible detection of pulsed emission from PSR B0355+54 it is likely that the emitting region is a hot polar cap.
It is suggested that the presence of a PWN is related to the spin-down power of the pulsar, and for sources with the PWN emission efficiency is significantly reduced (Frail & Scharringhausen, 1997; Gaensler et al., 2000; Gotthelf, 2003). For PSR B0355+54 , making it one of a handful of sources with spin-down power below this limit with a detectable PWN (cf. Geminga, Caraveo et al. 2003). Using the results from the blackbody plus power-law fit to the core emission detected with Chandra we determine an isotropic unabsorbed luminosity in the 0.3–10 keV band of erg s-1. With erg s-1 for PSR B0355+54, this leads to a conversion efficiency of . So in fact, we find that the conversion efficiency of the point source is similar to the values found for other pulsars (see e.g. Becker & Trümper, 1997; Gaensler et al., 2004). Our analysis also indicates that the compact diffuse component is more luminous than the point source, with a conversion efficiency of in the 0.3–10 keV range. This result is again consistent with other sources (Becker & Trümper, 1997). In addition, it is reported that when the pulsar spin-down energy is the morphology of the PWN seems to transition from toroidal to a jet/tail (Kaspi et al., 2005). Our measurements of PSR B0355+54 appear to agree with this trend.
The morphology of the diffuse emission depends on how the interaction with the interstellar medium (ISM) or supernova remnant constrains the flow of particles (e.g. Reynolds & Chevalier, 1984). For a pulsar that is moving with a supersonic space velocity, the interaction of the supersonic flow with the ambient medium causes the speed of the flow to decrease sharply, while the density increases, forming a bow shock. In addition to the bow shock, which is at some distance ahead of the pulsar, a reverse shock is formed nearer to the source which terminates the pulsar wind.
The results of the spatial analysis of the XMM-Newton PN and Chandra ACIS data of PSR B0355+54 indicate that the bulk of the diffuse emission extends [0.25( kpc) pc] downstream from the pulsar. Using the measurements of the pulsar’s proper motion (Chatterjee et al., 2004) we find that the transverse velocity of PSR B0355+54 is km s-1. This implies that the time taken for the pulsar to have traversed the length of the diffuse emission is yr. In addition, by considering the analysis of the XMM-Newton MOS1 data we find that the diffuse emission may extend as far as [1.51( kpc) pc] from the point source. This results in a travel time of yr for the pulsar. Following the work of Wang & Gotthelf (1998) (see also Kaspi et al. 2001) the synchrotron lifetime of an electron of energy (in keV) can be defined as yr, where is the magnetic field in units of G. Assuming that the dominant loss mechanism is synchrotron emission, i.e. G, and that the energy of the photon is keV, then yr. This indicates that the diffuse emission that we detect is not due to particles deposited by the pulsar as it traveled through space. Hence, there must be a constant supply of wind particles traveling at velocities greater than the space velocity of the pulsar. In addition, the particle flow velocity must be high enough such that the time for the flow to cross the length of the diffuse emission is less than the radiative lifetime of the particles.
Using the Chandra data we have modeled the spectrum of the compact diffuse emission, excluding the contribution from the pulsar, finding that the data can be well-fitted with a power-law. In other sources the power-law is seen to soften as one moves away from the pulsar position (see e.g. Slane et al., 2002; Li et al., 2005; Kaspi et al., 2005). An increase in the spectral index is expected as the particles will be cooler, i.e. older, at greater distance from the pulsar. Our results indicate that we are detecting relatively hard emission, but due to the uncertainties, we are unable to comment on any changes in the spectral slope. To measure cooling the PWN must be of an adequate size, it may be that for PSR B0355+54 the compact diffuse region is not large enough for a substantial change in power-law index to be measured, and there are too few counts in the more extended diffuse region to perform a spectral analysis. It is noted however that by comparing the spectral indices from the blackbody plus power-law fit to the core emission and the power-law fit to the compact diffuse emission we do detect an increase in of .
Gaensler et al. (2004) have presented a detailed analysis of the diffuse X-ray emission associated with the radio source G359.23-0.82, also known as “the Mouse”. Their hydrodynamic simulations show that there are a number of regions that can be defined in a pulsar bow shock. These include a pulsar wind cavity, shocked pulsar wind material, contact discontinuity (CD) and shocked ISM.
The energetic shocked particles from the pulsar are confined by the CD, the position of which denotes the transition to the shocked ISM. Following the method of Gaensler et al. (2004) we have estimated the distance between the peak of the emission from PSR B0355+54 and the sharp cut-off in brightness ahead of the pulsar. Using the same limit as Gaensler et al. (2004) i.e. where the X-ray surface brightness falls by , we find a distance of , giving the CD a projected radius of pc. Here, and in the following, we have used a distance to the pulsar of 1.04 kpc (Chatterjee et al., 2004). From Eq. (1) of Gaensler et al. (2004) we can estimate the radius of the forward termination shock (TS), pc. This corresponds to an angular distance of . Comparing our values to those for the Mouse implies that the emission in front of the pulsar is more compact in PSR B0355+54 than for the Mouse. In both cases the close proximity of the forward TS to the peak X-ray emission renders the TS undetectable. Using our results and Eq. (2) of Gaensler et al. (2004) we find that PSR B0355+54 produces a ram pressure of ergs cm-3. Assuming cosmic abundances, this gives km s-1, where is the number density of the ambient medium, so for PSR B0355+54 we determine cm-3, which is not unrealistic.
Additional information can be obtained by equating the pressure of the pulsar wind (assumed isotropic), to that of the ambient medium. By introducing the Mach number , where is the adiabatic sound speed in the ambient medium, and using the same prescription as Gaensler et al. (2004) for a representative ISM pressure (i.e. erg cm-3, with and is the Boltzmann’s constant), this gives:
| (1) |
from which we can obtain an estimate of the Mach number. We find that for PSR B0355+54 the sound speed of the medium lies in the range km s-1. The three principal phases of the ISM are generally named cold, warm and hot and are characterized by typical sound speed values of 1, 10 or 100 km s-1; according to this denomination our result implies that the pulsar is moving in either a cold or mildly warm ambient gas. For comparison, in the case of the Mouse, Gaensler et al. (2004) found that the most probable pulsar velocity requires that the pulsar is moving through a warm phase of the ISM.
Gaensler et al. (2004) also discuss the possible detection of the backward TS in their data. Their simulations show that this feature has a closed surface, while the CD and bow shock are unrestricted. The backward TS should lie much further away from the pulsar than the forward TS, i.e. . In principle this means that the backward TS may be detectable. The possible dip we see in the profiles for the PSR B0355+54 data could indicate the presence of the backward TS. The angular separation of the dip in our data is , a value consistent with that for the Mouse. For a backward TS, Gaensler et al. (2004) predict that there would be a lack of spectral evolution, a result we have found for the diffuse emission of PSR B0355+54. However, we note that the feature in the Mouse data (and simulations) is quite compact in the north-south direction in comparison to the PSR B0355+54 feature. In addition, the number of counts we detect for PSR B0355+54 may hinder our investigation of the presence of such a feature. Deeper observations are needed to probe further the PWN of PSR B0355+54.
A few days before submission of this paper, Tepedelenlioǧlu & Ögelman submitted a paper based on the same (public) observations to ApJL (astro-ph/0512209).
References
- Becker & Trümper (1997) Becker, W., Trümper, J. 1997, A&A, 326, 682
- Bhat et al. (1990) Bhat, P. N., Acharya, B. S., Gandhi, V. N., Ramana Murthy, P. V., Sathyanarayana, G. P., Vishwanath, P. R. 1990, A&A, 236, 1
- Buccheri et al. (1983) Buccheri, R., et al. 1983, A&A, 128, 245
- Caraveo et al. (2003) Caraveo, P. A., Bignami, G. F., DeLuca, A., Mereghetti, S., Pellizzoni, A., Mignani, R., Tur, A., Becker, W. 2003, Science, 301, 1345
- Cash (1979) Cash, W. 1979, ApJ, 228, 939
- Chatterjee et al. (2004) Chatterjee, S., Cordes, J. M., Vlemmings, W. H. T., Arzoumanian, Z., Goss, W. M., Lazio, T. J. W. 2004, ApJ, 604, 339
- de Jager (1991) de Jager, O. C. 1991, ApJ, 378, 286
- Frail & Kulkarni (1991) Frail, D. A., Kulkarni, S. R. 1991, Nature, 352, 785
- Frail & Scharringhausen (1997) Frail, D. A., Scharringhausen, B. R. 1997, ApJ, 480, 364
- Gaensler et al. (2000) Gaensler, B. M., Stappers, B. W., Frail, D. A., Moffett, D. A., Johnston, S., Chatterjee, S. 2000, MNRAS, 318, 58
- Gaensler (2001) Gaensler, B. M. 2001, in Young Supernova Remnants, eds. S. S. Holt & U. Hwang, AIP Conference Proceedings, 565, 295
- Gaensler et al. (2004) Gaensler, B. M., van der Swaluw, E., Camilo, F., Kaspi, V. M., Baganoff, F. K., Yusef-Zadeh, F., Manchester, R. N. 2004, ApJ, 616, 383
- Gotthelf (2003) Gotthelf, E. V. 2003, ApJ, 591, 361
- Helfand (1983) Helfand, D. J. 1983, in IAU Symp. 101, Supernova Remnants and Their X-ray Emission, eds. J. Danzinger & P. Gorenstein, Dordrecht: Reidel, 471
- Hobbs et al. (2004) Hobbs, G., Lyne, A. G., Kramer, M., Martin, C. E., Jordan, C. 2004, MNRAS, 353, 1311
- Kaspi et al. (2001) Kaspi, V. M., Gotthelf, E. V., Gaensler, B. M., Lyutikov, M. 2001, ApJ, 562, 163
- Kaspi et al. (2005) Kaspi, V. M., Roberts, M. S. E., Harding, A. K. 2005, in Compact Stellar X-ray Sources, ed. W. H. G. Lewin & M. van der Klis (Cambridge: Cambridge Univ. Press), in press
- Li et al. (2005) Li, X. H., Lu, F. J., Li, T. P. 2005, ApJ, 628, 931
- Manchester et al. (2005) Manchester, R. N., Hobbs, G. B., Teoh, A., Hobbs, M. 2005, AJ, 129, 1993
- Mardia (1972) Mardia, K. V. 1972, Statistics of Directional Data (London: Academic)
- Pavlov et al. (1995) Pavlov, G. G., Shibanov, Y. A., Zavlin, V. E., Meyer, R. D. 1995, in The Lives of Neutron Stars eds. A. Alpar, U. Kilizóglu & J. van Paradijs, Kluwer Academic Publishers, p. 71
- Pavlov et al. (2001) Pavlov, G. G., Kargaltsev, O. Y., Sanwal, D., Garmire, G. P. 2001, ApJ, 554, 189
- Rees & Gunn (1974) Rees, M. J., Gunn, J. E. 1974, MNRAS, 167, 1
- Reynolds & Chevalier (1984) Reynolds, S. P., Chevalier, R. A., 1984, ApJ, 278, 630
- Seward & Wang (1988) Seward, F. D., Wang, Z.-R. 1988, ApJ, 332, 199
- Slane (1994) Slane, P. 1994, ApJ, 437, 458
- Slane et al. (2002) Slane, P. O., Helfand, D. J., Murray, S. S. 2002, ApJ, 571, 45
- Stappers et al. (2003) Stappers, B. W., Gaensler, B. M., Kaspi, V. M., van der Klis, M., Lewin, W. H. G. 2003, Sci, 299, 1372
- Strüder et al. (2001) Strüder, L., et al. 2001, A&A, 365, L18
- Tepedelenlioǧlu & Ögelman (2005) Tepedelenlioǧlu, E., Ögelman, H. 2005, ApJL, submitted (astro-ph/0512209)
- Turner et al. (2001) Turner, M. J. L., et al. 2001, A&A, 365, 27
- Wang & Gotthelf (1998) Wang, Q. D., Gotthelf, E. V. 1998, ApJ, 494, 623
- Weisskopf et al. (2000) Weisskopf, M. C. 2000, ApJ, 536, 81
- Zane et al. (2002) Zane, S., et al. 2002, MNRAS, 334, 345