11email: giuseppe.galletta@unipd.it, 11email: rodighiero@pd.astro.it 22institutetext: INAF - Osservatorio Astronomico di Padova, Vicolo dell’Osservatorio 5, I-35122, Padova
22email: bettoni@pd.astro.it, 22email: jesus.varela@oapd.inaf.it 33institutetext: Instituto de Astrofísica de Andalucía (C.S.I.C.) Apartado 3004, 18080 Granada, Spain
33email: moles@iaa.es
Isolated galaxies: residual of primordial building blocks?
Abstract
Context. The mass assembly is believed to be the dominant process of early galaxy formation. This mechanism of galaxy building can proceed either by repeated major mergers with other systems, or by means of accretion of matter from the surrounding regions.
Aims. In this paper we compare the properties of local disk galaxies that appear isolated, i.e. not tidally affected by other galaxies during the last few Gyr within the volume given by km s-1, with those galaxies at values from 0.25 to 5.
Methods. Effective radii for 203 isolated galaxies and 1645 galaxies from the RC3 have been collected and the two samples have been analyzed statistically. A similar comparison has been made with half light radii studied at high from the literature.
Results. We found that isolated galaxies are in general smaller than other present epoch galaxies from the RC3. We notice the lack of systems larger than 7 kpc among them. Their size distribution appears to be similar to that of galaxies at . The models of the merging history also indicate that the isolated galaxies did stop their merging process at about that redshift, evolving passively since then. The galaxy density seems to have remained unchanged since that epoch
Conclusions. Isolated galaxies appears to be the end products of the merging process as proposed in the hierarchical accretion scenario at around . For this class of galaxies this was the last significant merging event in their lives and have evolved passively since then. This is confirmed by the analytical estimate of the merging fraction with and by the comparison with sizes of distant galaxies.
Key Words.:
Galaxies: formation – Galaxies: evolution – Galaxies: high redshift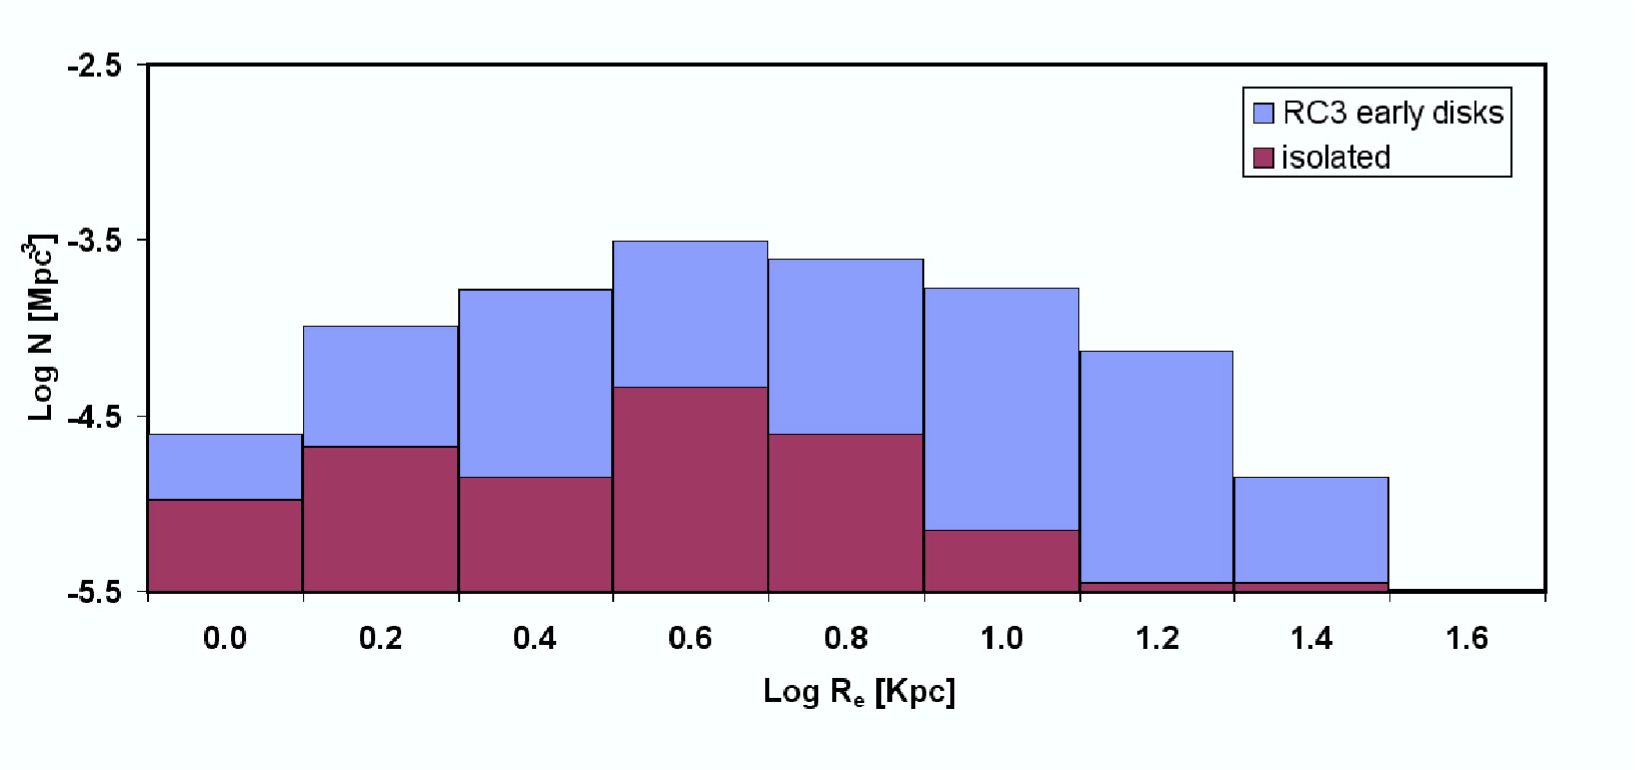
1 Introduction
The mass assembly is believed to be the dominant process of early galaxy formation. This mechanism of galaxy building can proceed either by repeated major mergers with other similar systems, or by means of accretion of matter from the surrounding regions. Some of these processes are still active at the present epoch, as in the cases of interacting pairs (Arp 1966; Arp & Madore 1987; Vorontsov-Velyaminov 1959; Moles et al. 2004), while other galaxies show the mark of gas- or star- accretion processes happened in the past, in the form of polar rings or of matter rotating with spin opposite to the main galaxy body (counterrotation). In all cases, the accretion process increases the final galaxy mass and powers its evolution.
The merging or accretion processes are in addition independent from the original galaxy morphological type, so in principle galaxies of every morphological type may increase their sizes with the cosmic time, from the first, smaller building blocks to the giant galaxies at the center of higher density environments.
According to the most extended view, galaxies form by accretion, very probably starting from clumpy systems similar to those observed in the Hubble Ultra Deep Field, later evolving to small exponential disks that grow from the inside out. They start with a dense halo and dense disk with spiral arms. The exponential structure of these earlier galaxies is predicted by model simulations, where different feeding mechanisms are considered (Abadi et al. 2003; Governato et al. 2004; Robertson et al. 2006). Once started, the small spirals should grow, by adding material to the outer regions. The galaxy increase his visible size by accreting material and feeding the star formation processes from the center outwards. Often strong interactions between galaxies may destroy these structure by merging or cannibalising. This picture is supported by the observation of an increase in size for galaxies at different redshifts, as we shall discuss in the next sections (Ferguson et al. 2004; De Mello et al. 2006; Papovich et al. 2005). The building from inside out may be supported also by a color gradient detected in galaxies at lower redshift (Papovich et al. 2005). The color evolution according to the process of galaxy formation above described have been investigated by semi-analytical models also (Cattaneo et al. 2006). According to some authors (Elmegreen et al. 2005; Noeske et al. 2006) the small disk galaxies observed in the Ultra Deep Field may be the dense, inner regions of present-epoch small disk galaxies.
The efficiency of the process to build large galaxies depends on the initial local density, so galaxies that are initially in lower density environments have a lower chance to have large merging events with others galaxies or to accrete matter and should, in principle, be smaller and less evolved than the average.
In a previous paper (Varela et al. 2004, here and after Paper I) we presented a Catalogue of disk galaxies that appear isolated on the basis of the physical criterion that they were not tidally affected by other galaxies in their evolution during the last few Gyr. Within the volume given by km s-1, 12% of the original sample galaxies satisfy this criterion. We found that they markedly differ in size, morphology, luminosity and color indices from galaxies that are in higher density environments.
Within the hierarchical galaxy formation frame these properties indicate that the building process was stopped long time ago and they were left to evolve only passively from then. In other words, if the building of the galaxies has proceeded by nested merging of smaller building blocks, these isolated galaxies, selected because they were not involved in significant merge events in the last part of their life, are in evolutionary stages as close as it can be to their high redshift counterparts.
In the present work we consider these galaxies and their properties in the light of the recently available data on high redshifts systems, to see whether both kind of objects similarly reflect the galaxy population at those epochs.
2 The size of isolated galaxies
2.1 Comparison with normal galaxies
In Paper I we compared the size and other properties of the isolated galaxies in the Catalogue we built with that of a sample of perturbed galaxies, in mild interaction with neighbors. We found that isolated galaxies are smaller, bluer, less massive and more frequently late type spirals than the perturbed galaxies. These facts agree with the scenario of early disks formation described in the Introduction. Here we follow the analysis comparing the size of isolated objects in our sample with a larger sample of stellar systems with similar morphological types extracted from the RC3 (de Vaucouleurs et al. 1991) and LEDA (Paturel et al. 1997) catalogues. We discarded from these large samples all the galaxies already classified as isolated so, even if this cannot exclude that among the galaxies present in these huge compilations some isolated galaxies may exist, they are a fair representation of non-isolated systems.
Isolated galaxies in Paper I were extracted from the CfA2 catalogue (Huchra et al. 2000) with a clear physical criterion, namely, to have no sizable companions within a volume large enough to ensure that they could not be affected in their evolution by other systems in the last Gyr. Other practical criteria were 1) to have the redshift available, to establish the absolute magnitude and physical size; 2) to be within a volume limited by km/s; 3) to have morphological types from S0 to Sc (-3 t 5); 4) to be at Galactic latitude b 40∘and declination . All the selected 203 galaxies have measured diameters at the 25 mag arcsec-2 isophote, D25, whereas only 38 have also the effective diameter, Ae, measured.
We have applied the same kind of constraints, excluding that of being isolated, to the RC3 catalogue, in order to build a big enough comparison sample. We found data for 1645 systems, with 826 disk galaxies. Among them only 483 (325 disks) have measured effective diameters. After the conversion of the radii in kpc, we built histograms of size distribution taking the RC3 and isolated galaxy samples binned every log =0.2 kpc and normalized on the volume of space defined by our adopted selection criteria. The histograms showing the difference in effective radii between local samples (RC3 and isolated) are shown in Figure 1, with galaxy sizes ranging from 1 kpc to 30 kpc.
It is clear that the two distributions look different, since systems with larger than about 10 kpc are very rare among isolated galaxies. This translates in a difference in their respective median values, that amount to 0.489 (3.08 kpc) for the RC3 galaxies, whereas for isolated galaxies it is only 0.369 (2.34 kpc). Both the T-test and the F-Test give that the difference between the median values is statistically significant at the 95% level.
The clear difference in size distribution between isolated and non-isolated objects would then reflect the difference in evolutionary histories between both families, that, following the standard views, is dominated by merging and accretion. If the larger galaxies are formed as the final step of a series of collisions and merging processes between close systems, this difference indicates that this process stopped much earlier for isolated objects than for the others.
2.2 Merging fractions at different values
The previous result indicates that isolated galaxies were not altered by any significant merging process for a large fraction of their histories. To identify the epoch when these galaxies were excluded from the more general evolving processes, we have considered the models that describe the merging process and its history with the redshift. The merging fraction of galaxies at different epochs is generally expressed by (Patton et al. 2000)
were and are parameters which values change from author to author. Thus, Patton et al. (2000) assumes a constant merging fraction of the form , while Le Fèvre et al. (2000), using more data, finds and . More recently, Conselice et al. (2003) have found that both values are different if massive or small galaxies are considered at different redshift ranges. They found ranging from 0.004 and 0.07 and ranging from 0.5 and 3.7 or higher.
Note that this approach assumes a constant local density ( constant) or describes the local density changes assuming a different slope for merging rates with . More accurate models may be considered for a fine-tuning of the resulting numbers.
Assuming the literature values, we estimated the fraction of galaxies that have undergone mergers since , following the method of Patton et al. (2000) by means of the formula:
The percentage of surviving galaxies, that ”avoided” a merger since is then
| Notes | |||||
| Conselice et al. (2003) | |||||
| 0.06 | 0.5 | 88.0% | 12.0% | 3.8 | M |
| 0.07 | 0.4 | 88.4% | 11.6% | 3.7 | M |
| 0.07 | 0.7 | 88.5% | 11.5% | 2.9 | M |
| 0.004 | 3.7 | - | - | 5 | M |
| Le Fèvre et al. (2000) | |||||
| 0.019 | 3.25 | 88.1% | 11.9% | 1.7 | - |
We may estimate when the merging process may have stopped for them by calculating, with different values of and , at what redshift z the percentage of surviving galaxies is equal to the observed percentage of isolated galaxies, that is 11.62% of the original CfA2 sample, being 203 over 1745 (Varela et al. 2004). This is shown in Table 1, assuming different values for and from literature (Conselice et al. 2003; Le Fèvre et al. 2000). The model of Conselice et al. (2003) is divided in absolute magnitude bins, characterised by different values. The values in the Table indicate that all the galaxies have undergone several mergers since their formation, because for 5 the ( )rem value is greater than 100%. Therefore, according to this result, our isolated galaxies may hardly to be residuals of the original blocks that have built the present-epoch galaxies, and none of those blocks could have survived with its pristine properties until now. However, it appears that the present fraction of isolated systems is close to that at redshift between 1.7 and 3.8, that would imply that the merging process was stopped at that epoch for such a fraction of galaxies. This prevented them to merge again producing larger size galaxies, as shown in Figure 1, and to evolve as the other, non-isolated.
2.3 Comparison with the sizes of galaxies at higher redshifts.
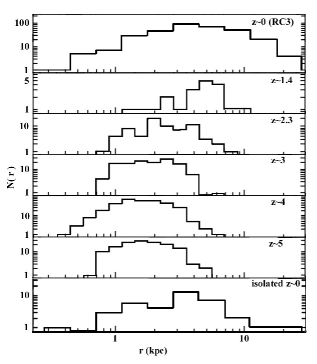
Looking back in time, we may expect to see an epoch in which the galaxy size distribution was similar to that of present day isolated galaxies. This latter may be then compared with that of galaxies observed at higher redshifts. Ferguson et al. (2004); Papovich et al. (2005); De Mello et al. (2006) have shown that an evolution of the physical size exists for galaxies from to . To compare our data with these ones, we plotted all the values in linear scale (kpc).
The resulting histograms for local and distant samples are shown in Figure 2, where the sizes of the galaxies in the largest, local existing sample are plotted together with the sizes of galaxies at several redshift intervals (Ferguson et al. 2004).
Indeed, galaxies at different intervals are normally observed in different rest wavelength intervals, so the comparison is not so straightforward. Ferguson et al. (2004) selected galaxies from the HST Advanced Camera Survey (ACS) that are observed in their UV rest-frame. The local galaxies are on the contrary studied on B images. The Ferguson et al. (2004) selection may favour galaxies with large UV luminosities, that are morphologically different from present-day systems and whose dimensions measured at UV band may not represent the whole galaxy size, but only that of the star forming regions (De Mello et al. 2006; Elmegreen et al. 2005). However, according to Lotz et al. (2005), the galaxy morphology does not appears to change if galaxies are observed between 1.5 4. This means that clumpy objects will appear with similar morphology in this redshift intervals.
By comparing sizes between galaxies selected from UV data and scaled to B-rest frame, with that of galaxies selected in the NIR, scaled to the same rest frame, De Mello et al. (2006) find that the median size of UV selected galaxies appear larger by 21% than that of systems selected in the NIR. This may result from selecting in FUV the brightest and bigger starburst galaxies, missing the smaller and less active objects. However, this is not always true for all the samples in the literature. Thus, the size distribution plotted in Figure 4 of Papovich et al. (2005) around (B-rest frame) has a peak at 2 kpc as that of Ferguson et al. (2004), but it is narrower.
Another source of error in comparing effective radii available for RC3 and isolated galaxies with the half radii adopted by Ferguson et al. (2004) may derive from the different methods used. Effective radii are computed in large galaxies by means of integration of the total luminosity in nested apertures, using then numerical method to extrapolate the total magnitude and the radius containing half of the luminosity. On the other side, the study of galaxies at high redshift and small apparent sizes is often performed with different techniques. In the case of the galaxies studied by Ferguson et al. (2004) the program SExtractor has been used, with particular assumptions on the fit parameters (see Ferguson et al. 2004). Adopting the same values for the parameters as Ferguson et al. (2004), we have calculated the effective radii for the 713 galaxies observed in the field of Abell 85 cluster (Varela et al. in preparation) using SExtractor but also using GASPHOT (Pignatelli et al. 2006), program which performs a surface brightness distribution and then gives more accurate effective radii. In general, effective radii calculated with SExtractor are systematically smaller than the values obtained using other packages, being lower than 20% for galaxies smaller than 5 arcsec in the analyzed images(0.4 arcsec/pixels scale).
The sizes plotted by Ferguson et al. (2004) derive from HST Advanced Camera for Surveys data with a scale of 0.05 arcsec pix-1 and the apparent size of their farthest galaxies falls in the above range of pixel sizes. So, we may expect that the histograms plotted in Figure 2 may be shifted toward higher sizes by 20% at maximum, or from 7 kpc to 8.4 kpc in intrinsic size. This shift however does not significantly change our results and, therefore, we can confirm that large systems are very scarce in the distribution of the size of galaxies in the range 1.4 5. They are, in that sense, similar to local isolated galaxies.
When plotted on the same scale, the peak of size distribution of distant galaxies moves toward higher values, while larger and larger galaxies are built at expenses of the smallest stellar systems, that are phagocytated inside bigger ones. The comparison with RC3 confirms this trend. The present-day galaxies of RC3 have a peak size at effective radii bigger than galaxies at higher . Isolated galaxies have a peak size falling close to that of the distant galaxies of Ferguson et al. (2004) at redshifts between 1 and 2.
In addition to the shift of the peak toward larger radii with decreasing , in Figure 2 it is visible also a lack of systems with effective radii larger than 7 kpc (corresponding to 1 arcsec at ) in the distant samples. This indicates that galaxies larger than 7 kpc (approximately the size of a galaxy like M33) are not yet formed in the Universe or are very rare, still at . On the contrary in RC3, at , they represent 22.5% of the total and in the isolated galaxies sample are 10.5%. We may deduce that isolated galaxies have not take part to the merging processes happened after .
Our data can be compared with the theoretical values of the mean galaxy size with redshift calculated assuming different cosmological scaling laws. These laws describe the size evolution in an expanding Universe and are related to the assumed cosmological geometry. The geometric effect may be described by simple functions (e.g. or ) and adds to the gradual increase with time of the physical size, depicted by hierarchical models, due to the accretion of matter from the environment or from the merger with smaller companions along the galaxy lifetime. In the literature, the scaling laws predict an increase of this parameter with (Ferguson et al. 2004). This is also confirmed by various recent observations up to redshift (Ferguson et al. 2004; Cassata et al. 2005).
Our result on mean size of the whole local disk population ( kpc from RC3), that results greater than the mean sizes of all the galaxies samples at higher redshifts (Ferguson et al. 2004; Cassata et al. 2005), is in full agreement with the predictions of these models at low redshift. In addition, the mean size of isolated galaxies ( kpc) is consistent with the galaxy mean size expected and observed at between 1.5 and 3.
2.4 Density evolution.
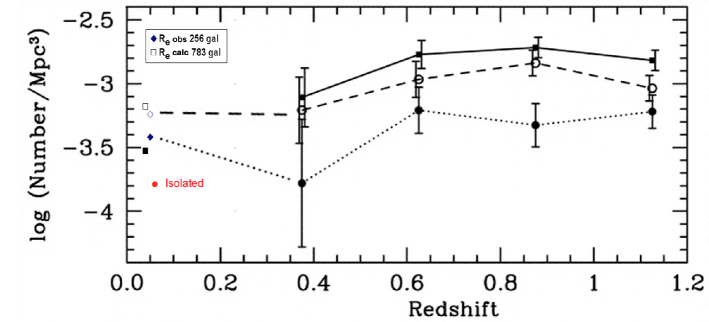
We further check this hypothesis by looking at the density evolution of disk galaxies. Ravindranath et al. (2004) have computed the observed number density of disk galaxies in the GOODS CDF-S field and they found no significant evolution from redshift out to . They divided the sample into small disks ( kpc) and large disks ( kpc). Within the uncertainties, neither sample shows a strong evolution and remains almost constant.
The kpc selection criterion for small disks matches the typical size of our isolated disks sample (median kpc). As we mentioned above, along the cosmic time smaller galaxies should have undergone only minor merging episodes, as suggested by the hierarchical growth of galaxy structures. If the number density of small disks is constant from to , this might support our suggestion on the isolated population and on the disk population in general. Ravindranath et al. (2004) conclude that luminous disk galaxies were present with roughly the same abundances at as at low redshift (), and are likely to have undergone only a modest luminosity evolution (and then a modest number of merger events).
To better constrain the results in the lower redshift bin, where the GOODS statistics is quite poor, we adopt the RC3 sample to estimate the local density of disks. Assuming the same value of Ravindranath et al. (2004), in order to discriminate between small and large disks, we found a density that is still consistent with a non evolutionary scenario for the density of disk galaxies. This is shown in Figure 3, where we extend the plot of Fig. 5 of Ravindranath et al. (2004) to .
We adopt the same size value for kpc to separate local small disks (filled lower symbols) and local large disks (upper empty symbols).
3 Conclusions
From the above discussion it appears that isolated galaxies could be important to understand the history of the galaxy building processes at redshift larger than 1.4. The similarity of properties between high redshift galaxies and the local isolated objects we have selected, indicates that, within the frame of hierarchical galaxy formation, these local isolated galaxies would have been out of the process since that epoch.
Indeed, our isolated systems are rather small, with only a fraction of 10% having kpc, at variance with the fraction of 22.5% that we find in the sample of RC3 non isolated galaxies selected within the same volume and with the same specifications. The median effective radius amounts to 2.3 kpc for the isolated galaxies, while for RC3 this value is 3.1 kpc.
The fraction of isolated galaxies in the large sample we explored amounts to 11.7% (see Paper I). This figure can be compared with the predictions from models of hierarchical galaxy formation, that allow to calculate percentage of ”surviving” galaxies, that is, the fraction of galaxies not affected by merging at a given epoch. Even if different authors use different parameter values to describe the merging evolution, we have found that for a rather large set of parameters the results are similar, around 12% at . This is very close to the percentage of isolated local galaxies we found, what let us to conclude that isolated galaxies knew their last merging event by that epoch.
To further explore this possibility we have compared the sizes, given by the effective radii, of the isolated galaxies with these of systems at and at . The results is that the similar sizes are found for both families in a rather narrow z-range, close to 1.4. Therefore, isolated galaxies with sizes larger than 7 kpc as those in our RC3 sample continued the building process built after , at variance with our local isolated galaxies.
We also considered the possible density evolution of galaxies as a function of their size. We find that neither the density of galaxies smaller than kpc, nor that of galaxies larger than kpc have evolved since . Our RC3 data confirms this lack of evolution to now.
All the above results suggest that isolated galaxies were definitively assembled at , when the merging process stopped due to the low density environment, and have evolved passively since then.
The merging history could thus be retraced looking at local galaxies in gradually richer environments.
Acknowledgements.
This paper has been partially funded by the contract 60A02-2077/05 Fondi 2005 - University of Padua. MM acknowledges a grant by the Spanish Ministerio de Educación y Ciencia, reference AYA2002.01241. We would like to thank Dr. Prada for helpful discussion. GR acknowledge Prof. Franceschini for useful discussions. The authors also thanks the referee for useful comments.References
- Abadi et al. (2003) Abadi, M.G., Navarro, J. F., Steinmetz M., Eke, V. R., 2003, ApJ, 597, 21
- Arp (1966) Arp, H. 1966, Atlas of Peculiar Galaxies Publisher: California Institute of Technology, Pasaadena, CA, 1966.
- Arp & Madore (1987) Arp, H. C., & Madore, B. F. 1987, A Catalog of Southern Peculiar Galaxies and Associations Publisher: Cambridge University Press, 1987.
- Cassata et al. (2005) Cassata, P., Cimatti, A., Franceschini, A., Daddi, E., Pignatelli, E., Fasano, G., Rodighiero, G., Pozzetti, L., Mignoli, M., Renzini, A. 2005, MNRAS, 357, 903
- Cattaneo et al. (2006) Cattaneo, A., Dekel, A., Devriendt, J., Guiderdoni, B., Blaizot, J., 2006, astro-ph/0601295
- Conselice et al. (2003) Conselice, C. J., Bershady, M. A., Dickinson, M., & Papovich, C. 2003, AJ, 126, 1183
- De Mello et al. (2006) De Mello, D. F., et al. 2006, AJ, 131, 216
- de Vaucouleurs et al. (1991) de Vaucouleurs G., de Vaucouleurs A., Corwin H.G., Buta R.J., Paturel G., Fouque P., 1991, Third Reference Catalogue of Bright Galaxies (RC3), Springer-Verlag: New York
- Elmegreen et al. (2005) Elmegreen, B. G. et al. 2005, ApJ, 634, 101
- Ferguson et al. (2004) Ferguson, H. C., et al. 2004, ApJL, 600, L107
- Governato et al. (2004) Governato, F., et al. 2004, ApJ, 607, 688
- Huchra et al. (2000) Huchra et al. 2000, CfA2 Catalogue of galaxy redshift, Center for Astrophysics.
- Le Fèvre et al. (2000) Le Fèvre, O., et al. 2000, MNRAS, 311, 565
- Lotz et al. (2005) Lotz, J.M.., et al. 2006, ApJ, 636, 592
- Moles et al. (2004) Moles, M., Bettoni, D., Fasano, G., Kjærgaard, P., Varela, J., 2004, A&A, 418, 495
- Noeske et al. (2006) Noeske, K. G:, et al. 2006, ApJ, 640, L143
- Papovich et al. (2005) Papovich, C., et al. 2005, ApJ, 631, 101
- Patton et al. (2000) Patton, D. R., Carlberg, R. G., Marzke, R. O., Pritchet, C. J., da Costa, L. N., & Pellegrini, P. S. 2000, ApJ, 536, 153
- Paturel et al. (1997) Paturel, G., Andernach, H., Bottinelli, L., Di Nella, H., Durand, N., Garnier, R., Gouguenheim, L., Lanoix, P., Martinet,M.C., Petit, C., Rousseau, J., Theureau, G., Vauglin, I., 1997, A&AS, 124, 109
- Pignatelli et al. (2006) Pignatelli, E., Fasano, G., & Cassata, P. 2006, A&A, 446, 373
- Ravindranath et al. (2004) Ravindranath, S., et al. 2004, ApJ, 604, L9
- Robertson et al. (2006) Robertson, B., et al. 2006, ApJ, in press
- Varela et al. (2004) Varela, J., Moles, M., Márquez, I., Galletta, G., Masegosa, J., & Bettoni, D. 2004, A&A, 420, 873
- Vorontsov-Velyaminov (1959) Vorontsov-Velyaminov, B. A. 1959, Atlas and catalog of interacting galaxies (1959)