119–126
Optical recombination lines as probes of conditions in planetary nebulae
Abstract
Since the last IAU symposium on planetary nebulae (PNe), several deep spectroscopic surveys of the relatively faint optical recombination lines (ORLs) emitted by heavy element ions in PNe and H ii regions have been completed. New diagnostic tools have been developed thanks to progress in the calculations of basic atomic data. Together, they have led to a better understanding of the physical conditions under which the various types of emission lines arise. The studies have strengthened the previous conjecture that nebulae contain another component of cold, high metallicity gas, which is too cool to excite any significant optical or UV CELs and is thus invisible via such lines. The existence of such a plasma component in PNe and possibly also in H ii regions provides a natural solution to the long-standing problem in nebular astrophysics, i.e. the dichotomy of nebular plasma diagnostics and abundance determinations using ORLs and continua on the one hand and collisionally excited lines (CELs) on the other.
keywords:
ISM: abundances, planetary nebulae: general, atomic processes1 The dichotomy between ORLs and CELs
Observations and analyses of emission line nebulae, PNe and H ii regions, are widely used to obtain elemental abundances in our own Galaxy and beyond. A detailed knowledge of the physical conditions under which the lines arise and a full understanding of their excitation mechanisms are of paramount importance for the reliability and accuracy of the results, and consequently for the study of stellar nucleosynthesis and the chemical evolution of galaxies. However, observations in the last decade of the relatively faint ORLs from heavy element ions have yielded elemental abundances that are consistently higher than values derived from the traditional method based on strong CELs. The discrepancy between ORL and CEL abundances first drew attention and became an issue of dispute ever since IUE measurements in the early 1980s of the ultraviolet C iii] 1907,1909 CELs yielded systematically lower C2+/H+ abundance ratios than values derived from the C ii 4267 ORL. Similarly, in another major dilemma, it is also found that ’s deduced from the Balmer discontinuity of H i recombination spectra are systematically lower than those derived from the [O iii] forbidden line ratio, a discrepancy first reported by Peimbert (1971). For most PNe, the ORL/CEL abundance discrepancy factors (adf’s) typically lie in the range 1.6–3.2, but with a significant tail extending to much higher values. Liu et al. (1995) and Luo et al. (2001) found an adf of for NGC 7009, while Liu et al. (2000) derived an adf of for NGC 6153 and Liu et al. (2001) obtained adf’s of and 20 for Bulge PNe M 2-36 and M 1-42, respectively. The highest adf recorded hitherto for a PN is for Hf 2-2 (Liu 2003; Liu et al. 2006).
2 Interpretation
It is now widely accepted that both types of the above-mentioned discrepancies are real rather than caused by e.g. errors in atomic data or observational uncertainties. The discrepancies are traditionally interpreted in terms of large fluctuations (Peimbert 1967) and/or inhomogeneities (Rubin 1989; Viegas & Clegg 1994). Yet there is no direct measurement pointing to the existence of large fluctuations in PNe and physical causes that might lead to them remain unclear. More importantly, the paradigm fails to explain the wide range of data extending from the UV to the IR that are available now (Liu 2003, 2005; but see the review by M. Peimbert in the volume for a different view):
-
1.
The value of the adf is found to be uncorrelated with the excitation energy or the critical density of the CEL involved, as one would expect if fluctuations and/or inhomogeneities are the root cause;
-
2.
IR fine-structure lines such as [O iii] 52- and 88-m, which have K and are therefore insensitive to and fluctuations, yield ionic abundances comparable to UV/optical CELs. This is true for all PNe analyzed hitherto, including those of densities lower than the critical densities of the IR fine-structure lines;
-
3.
Values of the adf larger than 5 are difficult to explain by such effects;
-
4.
The fluctuation scenario implicitly requires the nebular heavy element abundances to be the higher ORL values. Yet such abundances are often much higher than the solar value making it very difficult to reconcile with the current theory of stellar evolution for low- and intermediate-mass stars.
-
5.
Imaging and spatially resolved spectroscopic observations have yielded small values for , Peimbert’s parameter of fluctuations (e.g. Rubin et al. 2002 for NGC 7009).
An alternative interpretation was presented by Liu et al. (2000). In their analysis of NGC 6153, Liu et al. concluded that the nebula must contain another previously unknown component of ionized gas, cold and highly enriched in heavy elements. The conjecture was strongly supported by the later discovery of very low Balmer jump ’s in two PNe of large adf’s, 3680 K in M 1-42 (adf = 22; Liu et al. 2001) and 900 K in Hf 2-2 (adf = 71; Liu 2003; Liu et al. 2006). Both PNe have a typical [O iii] forbidden line temperature of K. Further evidence pointing to the presence of a cold component of metal-rich plasma was provided by the analyses of He i and O ii ORLs as well as by detailed photoionization modeling that incorporates H-deficient inclusions embedded in a nebula of “normal” composition (c.f. Liu 2003, 2005 and references therein).
In what follows, I will summarize progress achieved on this important problem since the last IAU symposium on PNe. Additional discussions on the topic can be found in this volume in articles by Peimbert, by Barlow, Liu & Hales and by Tsamis et al.
3 ORL spectroscopic surveys
Several deep optical spectroscopic surveys, allowing detailed nebular plasma diagnostics and abundance analyses using the relatively weak hydrogen and helium recombination continua and ORLs from heavy element ions, have been carried out and published for several dozens of Galactic disk and Bulge PNe and for a number of Galactic and extragalactic H ii regions. Tsamis et al. (2003b, 2004) studied 12 Galactic and 3 Magellanic PNe. Liu et al. (2004ab) analyzed 12 Galactic PNe. Robertson-Tessi & Garnett (2005) and Wesson et al. (2005) surveyed 6 and 23 Galactic PNe, respectively. Finally, Wang & Liu (2006, in preparation; c.f. their contribution in this volume) observed 25 Galactic Bulge and 6 disk PNe. Detailed studies for individual nebulae since 2001 were presented by Liu et al. (2001; M 1-42 and M 2-36), Garnett & Dinerstein (2001a; NGC 6720), Zhang & Liu (2003; M 2-24), Shen, Liu & Danziger (2003; Me 1-1), Wesson, Liu & Barlow (2003; Abell 30), Ruiz et al. (2003; NGC 5307), Peimbert et al. (2004; NGC 5315), Ercolano et al. (2004; NGC 1501), Wesson & Liu (2004; NGC 6543), Sharpee et al. (2004; IC 418), Zhang et al. (2005; NGC 7027) and Liu et al. (2006; Hf 2-2). In total, about 90 PNe have been studied using ORLs. For H ii regions, observations were presented by Esteban et al. (2002) for 4 extragalactic giant H ii regions (NGC 604 in M 33, NGC 5461 and 5471 in M 101 and NGC 2363), Tsamis et al. (2003a) for 3 Galactic (M 42, M 17 and NGC 3576) and 3 Magellanic (30 Doradus, LMC N 11B and SMC N 66) nebulae, Peimbert (2003) for 30 Doradus, Esteban et al. (2004) for M 42 and García-Rojas et al. (2004, 2005 and 2006) for NGC 3576, S 311, M 16, M 20 and NGC 3603.
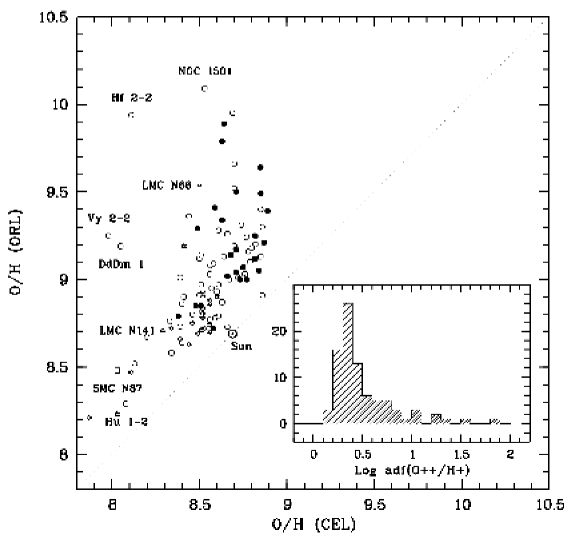
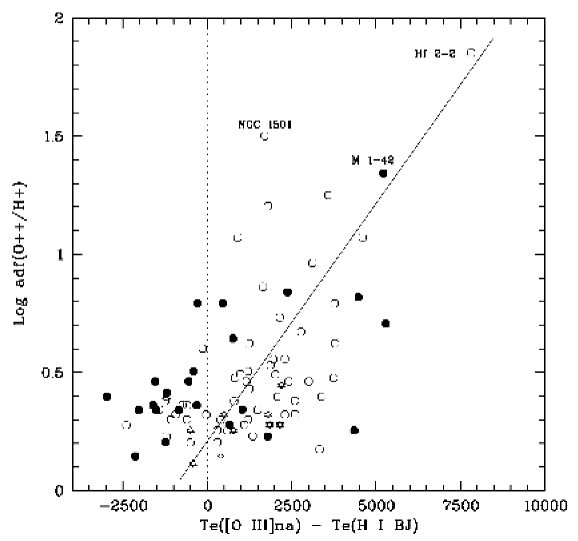
The left panel of Fig. 1 compares O/H deduced from ORLs and from CELs for PNe and H ii regions. For all nebulae, ORL abundances are higher than the corresponding CEL values. In addition, except for a few halo PNe, O/H abundances deduced from ORLs are higher than the solar value of 8.69 (Lodders 2003) for almost all Galactic PNe, by up to a factor of 25 (1.4 dex) in the most extreme case. The insert shows a histogram of adf(O2+/H+) for 86 PNe. The distribution peaks at 0.35 dex, or a factor of 2. Approximately 10% and 20% of PNe have adf’s larger than 10 and 5, respectively. The right panel of Fig. 1 plots adf(O2+/H+) against ([O iii])(BJ), the difference between ’s derived from the [O iii] forbidden lines and from the Balmer jump of the H i recombination spectrum. As noted by Liu et al. (2001) there is a positive correlation between the two quantities. For Hf 2-2, the most extreme PNe found so far, adf = 71 and (BJ) K, compared to ([O iii]) K (Liu et al. 2006).
Large, evolved, low surface brightness, low excitation PNe tend to have large adf’s (Garnett & Dinerstein 2001b; Tsamis et al. 2004; Liu et al. 2004b). For a given PN, adf increases towards the centre (Garnett & Dinerstein 2001a; Liu et al. 2000; Luo & Liu 2003; Liu et al. 2006). Similar patterns were observed earlier in several PNe in the case of C2+/H+ (e.g. Barker 1987). It seems that as the main nebula expands and decreases in surface brightness, cold H-deficient inclusions become dominant in emitting ORLs.
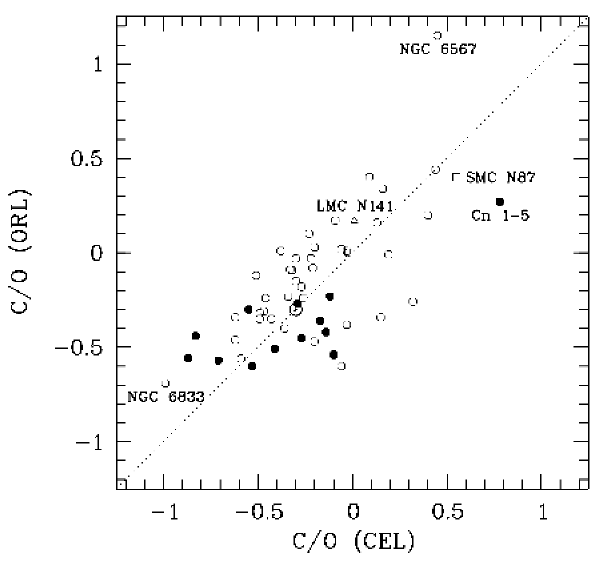
For all abundant second-row elements studied, X/H (X = C, N, O and Ne) deduced from ORLs are all enhanced compared to the CEL values by about the same amount for a given nebula. Abundance ratios, such as C/O, N/O and Ne/O deduced from two types of lines are therefore comparable. The left panel of Fig. 2 shows that C/O ratios deduced from ORLs and from CELs agree well. The agreement is less satisfactory for N/O and Ne/O – ORLs tend to yield higher values than CELs, by 0.2 and 0.4 dex, respectively. The discrepancies are probably caused by uncertainties in the effective recombination coefficients for N ii and Ne ii. We still lack high quality calculations of effective recombination coefficients for the 3d – 4f transitions. Note that Fig. 2 shows that Bulge PNe have lower C/O ratios than disk ones by approximately 0.2 dex.
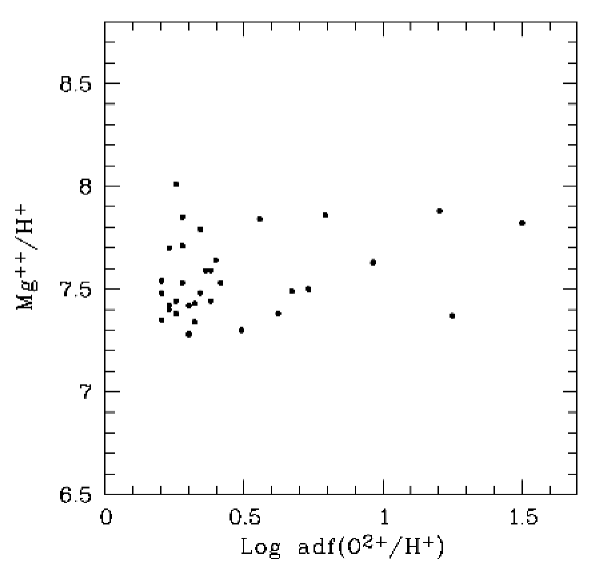
In contrast, for the third-row element Mg, values of Mg2+/H+, which to a good approximation equals Mg/H, deduced from the Mg ii 3d–4f 4481 ORL, are nearly constant for a wide range of adf and are almost identical to the solar value (Barlow et al. 2003; Liu et al. 2004b). As pointed out by Barlow et al. (2003), depletion of Mg onto dust grains is unlikely significant for ionized gaseous nebulae. Data on Mg abundances from CELs are scarce, due to the lack of lines in the optical. For a few high excitation PNe for which IR observations of the [Mg iv] 4.4m and [Mg v] 5.6m lines are available (Liu et al. 2004b; Zhang et al. 2005b), the data appear to imply adf(Mg/H) . It seems that the large ORL/CEL abundance discrepancies observed for second-row elements are not present for magnesium. The result poses a serious constraint on the possible origins of H-deficient inclusions that are postulated to exist in PNe and possibly also in H ii regions.
4 Nebular conditions as probed by recombination lines and continua
The bi-abundance model proposed by Liu et al. (2000) assumes that most of the observed flux of ORLs are emitted by cold, H-deficient inclusions embedded in the nebula and predicts that, for a given nebula, ([O iii]) (H i BJ) (He i) (O ii) (Liu 2003; Péquignot et al. 2003). The predictions are supported and strengthened by new observations and diagnostics developed since the last IAU symposium on PNe. Table 1 compares ’s and ’s deduced from CELs and from ORLs/continua for PNe with adf . Two peculiar PNe, M 2-24 (adf = 17, Zhang & Liu 2003) and M 3-27 (adf = 5.5, Wesson, Liu & Barlow 2005) have been excluded from the list.
| Nebula | adf(O++/H+) | ([O iii]) | (CELs) | (BJ) | (BD) | (He i) | (O ii) |
|---|---|---|---|---|---|---|---|
| (K) | (cm-3) | (K) | (cm-3) | (K) | (K) | ||
| NGC 7009 | 4.7 | 9980 | 3.6 | 7200 | 3.8 | 5040 | 420 |
| H 1-41 | 5.1 | 9800 | 3.0 | 4500 | 2930 | 288 | |
| NGC 2440 | 5.4 | 16150 | 3.8 | 14000 | 288 | ||
| Vy 1-2 | 6.2 | 10400 | 3.4 | 6630 | 4430 | 3450 | |
| IC 4699 | 6.2 | 11720 | 3.3 | 12000 | 2460 | 288 | |
| NGC 6439 | 6.2 | 10360 | 3.7 | 9900 | 5.5 | 4900 | 851 |
| M 3-33 | 6.6 | 10380 | 3.3 | 5900 | 5020 | 1465 | |
| M 2-36 | 6.9 | 8380 | 3.6 | 6000 | 3.8 | 2790 | 520 |
| IC 2003 | 7.3 | 12650 | 3.5 | 11000 | 3.0 | 5600 | 288 |
| NGC 6153 | 9.2 | 9120 | 3.5 | 6000 | 3.8 | 3350 | 350 |
| LMC N66 | 11.0 | 18150 | 3.6 | ||||
| DdDm 1 | 11.8 | 12300 | 3.6 | 11400 | 3.8 | 3500 | |
| Vy 2-2 | 11.8 | 13910 | 4.2 | 9300 | 1890 | 1260 | |
| NGC 2022 | 16.0 | 15000 | 3.2 | 13200 | 15900 | 288 | |
| NGC 40 | 17.8 | 10600 | 3.1 | 7000 | 3.2 | 10240 | |
| M 1-42 | 22.0 | 9220 | 3.1 | 4000 | 3.7 | 2260 | 288 |
| NGC 1501 | 31.7 | 11100 | 3.0 | 9400 | |||
| Hf 2-2 | 71.2 | 8820 | 3.0 | 1000 | 2.6 | 940 | 630 |
-
References: NGC7009: Liu et al.(1995); H 1-41, IC 4699, NGC 6439, M 3-33: Wang & Liu (in preparation); NGC 2440, NGC 2022, LMC N 66: Tsamis et al. (2004); Vy 1-2, IC 2003, DdDm 1, Vy 2-2: Wesson, Liu & Barlow (2005); M 2-36, M 1-42: Liu et al. (2001); NGC 6153: Liu et al. (2000); NGC 40: Liu et al. (2004b); NGC 1501: Ercolano et al. (2004); Hf 2-2: Liu et al. (2006).
4.1 H i recombination spectrum
For nearly all PNe surveyed, (BJ) has been determined from the ratio of Balmer jump at 3646 Å to H 11 3770 of the H i recombination spectrum. Whereas the Balmer discontinuity is sensitive to , intensities of high-order Balmer lines () relative to a lower one (e.g. H 11) increase with and can thus be used to deduce under which H i lines are emitted. Zhang et al. (2004) deduced values of and from the Balmer jump and decrement, (BJ) and (BD), for a sample of 48 PNe. Apart from the well established relation that ([O iii]) (BJ), they also find that in general (BD) (CELs), the average density deduced from optical CELs (c.f. Table 1). In addition, they find that for many PNe, ([O iii]) deduced from the (4959 + 5007)/4363 ratio is lower than that yielded by the (4959 + 5007)/(52m + 88m) ratio, which is in contradiction with the predictions of fluctuations but can be explained by invoking modest inhomogeneities.
4.2 He i recombination spectrum
Liu (2003) used the He i 5876/4471 and 6678/4471 ratios to deduce the average of He i ORLs, (He i). Zhang et al. (2005a) proposed to use another ratio 7281/6678 and analyzed 48 PNe. The latter has the advantages of being less sensitive to uncertainties in flux calibration, reddening corrections and to optical depth effects of the metastable 2s 3S level, although the lines involved are weaker. The results show that (He i) (BJ), in line with the predictions of the bi-abundance model, but in stark contradiction with the scenario of fluctuations which predicts that (He i 7281/6678) (BJ). Another potential diagnostic to determine (He i), yet to be fully exploited, is the weak He i discontinuity at 3421 Å produced by recombinations of He+ to the 2p 3Po level (Liu & Danziger 1993; Zhang et al. 2005b). Recombinations of He++ to the level also produce a discontinuity at 5694 Å in the optical, which is however only observable in very high excitation PNe where helium is mostly doubly ionized (Liu & Danziger 1993).
4.3 O ii ORLs
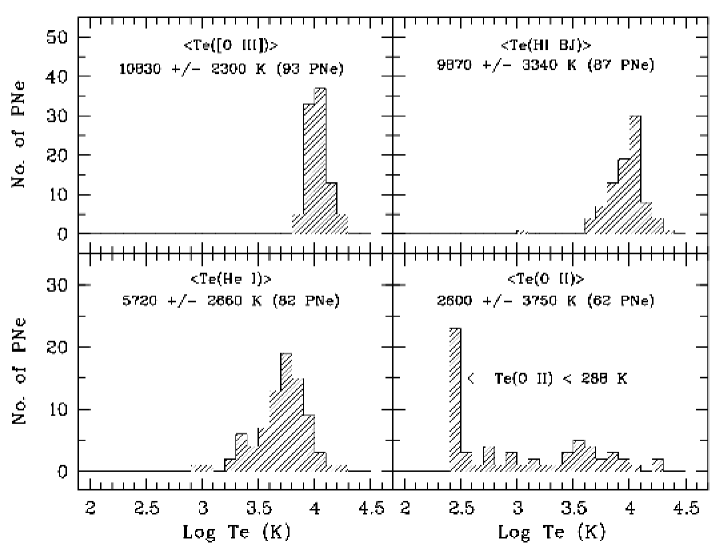
In their analysis of M 1-42 and M 2-36, Liu et al. (2001) noticed that while the relative intensities of O ii ORLs observed in those two PNe and in NGC 7009 (Liu et al. 1995) and NGC 6153 (Liu et al. 2000) agree well with the predictions of recombination theory, there are discrepancies. For example, relative to the strongest 4f – 4d transition 4f G[5] – 3d 4F9/2 4089, the intensity of the strongest 3p – 3s transition 3p 4D – 3s 4P5/2 4649 appears to be too weak by % compared to the predicted value calculated at (BJ). Later it became clear that the discrepancy was caused by the fact that the O ii ORLs arise from plasma of ’s far lower than (BJ) (Liu 2003). By comparing the observed 4089/4649 ratio with the theoretical value as a function of calculated down to 288 K, the average ’s under which O ii lines are emitted have been determined for a number of PNe (Tsamis et al. 2004; Liu et al. 2004b and Wesson et al. 2005). In general, (O ii) K (Table 1). Fig. 3 shows histograms of ([O iii]), (BJ), (He i) and (O ii). While (O ii) scatters over a wide range of values, presumably due to measurement uncertainties given the weakness of the lines, the diagram clearly shows that (O ii) (He i) (BJ) ([O iii]), as predicted by the bi-abundance model (Liu et al. 2000). Note that the width of the distribution increases from ([O iii]), through (BJ) and (He i) to (O ii). Parts of this increase are clearly caused by observational uncertainties as the measurements become increasingly difficult. Alternatively, it may well be that the relative importance of the postulated cold H-deficient inclusions and the main nebula in emitting ORLs varies from object to object; this contributes to the large scatter observed in (He i) and particularly in (O ii). This is consistent with the loose correlation observed between adf and ([O iii])(BJ) (Fig. 1).
Applying the same technique to the well known H-deficient knots in Abell 30, Wesson et al. (2003) showed that the prominent O ii ORLs emitted by those knots arise from plasma of – 2000 K. Note that the knots are O-rich, in contradiction to the prediction that they originate from ejecta of a late thermal pulse of the helium flash of a single star evolution and should therefore be C-rich (Iben et al. 1983).
Several PNe in our sample show O ii 4089/4649 ratios higher than the predicted value of 0.41 at 288 K, the lowest for which the effective recombination coefficients are available. Tsamis et al. (2004) detected a weak feature at 4116 Å in 3 PNe (NGC 3242, 5882 and 6818) and attributed it to Si iv 4s 2S1/2 – 4p 2P 4116.1. The other component of the multiplet, at 4088.8 Å, blends with O ii 4089.3. Assuming Si iv 4089/4116 = 2, they corrected the measured O ii 4089 flux for the presence of Si iv when calculating (O ii). For NGC 7009 listed in Table 1, our unpublished spectrum reveals a feature at 4116 Å. If we attribute it to Si iv and apply similar corrections, then (O ii) increases from the listed value of 420 K to 1310 K. On the other hand, the spectrum of another PN in Table 1, Vy 2-2, shows a feature at 4116 Å with an intensity that is higher than even that of the 4089 feature. In view of the facts that O2+/H+ derived from the 4089 feature, assuming it is entirely due to O ii 4089, is in good agreement with values derived from other O ii lines (Wesson, Liu & Barlow 2005), and that Si iv 4089/4116 = 2, it is unlikely that the 4116 feature detected in Vy 2-2 is entirely due to Si iv, even if Si iv is present in this nebula. We were unable to find a more plausible assignment for the 4116 feature.
Detailed analyses (Liu 2003; Tsamis et al. 2003) revealed that the relative intensities of O ii ORLs within a given multiplet deviate from the predictions of the recombination theory that has hitherto tacitly assumed that the ground fine-structure levels of recombining O++ ions, 2p2 3P0,1,2, are thermalized and populated according to the statistical weights (Storey 1994; Liu et al. 2000). The effects provide a means of determining the density under which the lines are emitted, and consequently the total mass of ionized gas required to reproduce their observed fluxes. An empirical calibration of the intensity of the 3p 4D – 3s 4P5/2 4649 transition relative to the total intensity of the whole multiplet as a function of forbidden line was presented by Ruiz et al. (2003). Ab initio calculations of effective recombination coefficients that take into account the populations of the individual fine-structure levels of the recombining ion as a function of have been carried out and preliminary results reported by Bastin & Storey (2005; c.f. also the contribution by the same authors in the volume). Applications of the data to observations yield densities that are higher than the diffuse gas, as one would expect if the cold high metallicity plasma that is postulated to be responsible for most of the observed emission of ORLs originates from evaporation of H-deficient condensations embedded in the nebula. Analysis also shows that the amount of metal deposited in those H-deficient clumps is substantial and comparable to that in the “normal” component (Liu et al. 2006).
In summary, a self-consistent picture has emerged that points to the presence of a new component of cold plasma that is highly enriched in helium and heavy elements and probably in the form of H-deficient inclusions embedded in the nebula. Its existence provides a natural solution to the long-standing dichotomy of nebular plasma diagnostics and abundance determinations using ORLs on the one hand and CELs on the other. The study has demonstrated that we have much to learn from those weak ORLs that are only revealed by deep high resolution spectroscopy. The diagnostic tools developed from the analysis of the O ii spectrum as outlined above can be easily extended to recombination spectra of other heavy element ions, such as C ii, N ii and Ne ii, though the observations would be even more demanding as the lines become even fainter. Indeed, analyses of available data on C ii and N ii ORLs, albeit sparse, yield corroborative evidence that they arise from plasma of K, as do the O ii ORLs.
Several scenarios for the possible origins of the postulated H-deficient inclusions have been proposed, including the “born-again” scenario (Iben et al. 1983), evaporating planetesimals (Liu 2003, 2005) and novae (Wesson et al. 2003). Further studies are clearly needed to discriminate between these possibilities.
References
- [Barker (1987)] Barker, T. 1987, ApJ 322, 922
- [Barlow et al. (2003)] Barlow, M. J., et al. 2003, in: S. Kwok, M. Dopita & R. Sutherland (eds.), Planetary Nebulae: Their Evolution and Role in the Universe (San Francisco: ASP), p.373
- [Bastin, R. & Storey (2005)] Bastin, R. & Storey, P. J. 2005, in: R. Szczerba, G. Stasinska & S. K. Gorny (eds.), Planetary Nebulae as Astronomical Tools (Springer, New York), AIP Conf. Proc., Vol. 804, p.63
- [Ercolano et al.(2004)] Ercolano, B., Wesson, R., Zhang, Y., et al. 2004, MNRAS 354, 558
- [Esteban et al.(2002)] Esteban, C., Peimbert, M., Torres-Peimbert, S., & Rodríguez, M. 2002, ApJ 581, 241
- [Esteban et al.(2004)] Esteban, C., Peimbert, M., García-Rojas, J., et al. 2004, MNRAS 355, 229
- [García-Rojas et al.(2004)] García-Rojas, J., Esteban, C., Peimbert, M., et al. 2004, ApJS 153, 501
- [García-Rojas et al.(2005)] García-Rojas, J., Esteban, C., Peimbert, A., et al. 2005, MNRAS 362, 301
- [García-Rojas et al.(2006)] García-Rojas, J., Esteban, C., Peimbert, M., et al. 2006, MNRAS 368, 253
- [Garnett & Dinerstein (2001a)] Garnett, D. & Dinerstein, H. L. 2001a, ApJ 558, 145
- [Garnett & Dinerstein (2001b)] Garnett, D. & Dinerstein, H. L. 2001b, RMxAA (Conf. Ser.) 10, 13
- [Iben, Kaler & Truran (1983)] Iben, I., Kaler, J. B. & Truran J. W. 1983, ApJ 264, 605
- [Liu (2003)] Liu, X.-W. 2003, in: S. Kwok, M. Dopita & R. Sutherland (eds.), Planetary Nebulae: Their Evolution and Role in the Universe (San Francisco: ASP), p.339
- [Liu (2005)] Liu, X.-W. 2005, in: J. Walsh, L. Stanghellini & N. Douglas (eds.), Planetary Nebulae beyond the Milky Way (Berlin: Springer-Verlag), p.169
- [Liu et al.(2006)] Liu, X.-W., Barlow, M. J., Zhang, Y., et al. 2006, MNRAS in press (astroph/0603215)
- [Liu & Danziger (1993)] Liu, X.-W. & Danziger, I. J. 1993, MNRAS 263, 256
- [Liu et al.(2004a)] Liu, Y., Liu, X.-W., Luo, S.-G. & Barlow, M. J. 2004a, MNRAS 353, 1231
- [Liu et al.(2004b)] Liu, Y., Liu, X.-W., Barlow, M. J. & Luo, S.-G. 2004b, MNRAS 353, 1251
- [Liu et al.(2001)] Liu, X.-W., Luo, S.-G., Barlow, M. J., Danziger, I. J. & Storey, P. J. 2001, MNRAS 327, 141
- [Liu et al.(2001)] Liu, X.-W., Storey, P. J., Barlow, M. J. & Clegg, R. E. S. 2001, MNRAS 272, 369
- [Lodders (2003)] Lodders, K. 2003, ApJ 591, 1220
- [Luo & Liu (2003)] Luo, S.-G. & Liu, X.-W. 2003, in: S. Kwok, M. Dopita & R. Sutherland (eds.), Planetary Nebulae: Their Evolution and Role in the Universe (San Francisco: ASP), p.393
- [Luo et al.(2001)] Luo, S.-G., Liu, X.-W. & Barlow, M. J. 2001, MNRAS 326, 1049
- [Peimbert (1967)] Peimbert, M. 1967, ApJ 150, 825
- [Peimbert (1971)] Peimbert, M. 1971, Bol. Obs. Tonantzintla Tacubaya 6, 29
- [Peimbert (2003)] Peimbert, M., Peimbert, A., Ruiz, M. T. & Esteban, C. 2004, ApJS 150, 431
- [Peimbert et al.(2004)] Peimbert, A. 2003, ApJ 584, 735
- [Péquignot et al. (2003)] Péquignot, D. et al. 2003, in: S. Kwok, M. Dopita & R. Sutherland (eds.), Planetary Nebulae: Their Evolution and Role in the Universe (San Francisco: ASP), p.347
- [Robertson-Tessi & Garnett (2005)] Robertson-Tessi, M. & Garnett, D. 2005, APJS 157, 371
- [Rubin (1989)] Rubin, R. H. 1989, ApJS 69, 897
- [Rubin et al. (2002)] Rubin, R. H., et al. 2002, MNRAS 334, 777
- [Ruiz et al.(2003)] Ruiz, M. T., Peimbert, A., Peimbert, M. & Esteban, C. 2003, ApJ 595, 247
- [Sharpee, Baldwin & Williams (2004)] Sharpee, B., Baldwin, J. A. & Williams, R. 2004, ApJ 615, 323
- [Shen, Liu & Danziger (2003)] Shen, Z.-X., Liu, X.-W. & Danziger, I. J. 2003, A&A 422, 563
- [Storey (1994)] Storey, P. J. 1994, A&A 282, 999
- [Tsamis et al.(2003a)] Tsamis, Y. G., Barlow, M. J., Liu, X.-W., et al. 2003a, MNRAS 338, 186
- [Tsamis et al.(2003b)] Tsamis, Y. G., Barlow, M. J., Liu, X.-W., et al. 2003b, MNRAS 345, 186
- [Tsamis et al.(2004)] Tsamis, Y. G., Barlow, M. J., Liu, X.-W., et al. 2004, MNRAS 353, 953
- [Viegas & Clegg (1994)] Viegas, S. & Clegg, R. E. S. 1994, MNRAS 271, 993
- [Wesson, Liu & Barlow (2003)] Wesson, R., Liu, X.-W. & Barlow, M. J. 2003, MNRAS 340, 253
- [Wesson & Liu (2004)] Wesson, R. & Liu, X.-W. 2004, MNRAS 351, 1026
- [Wesson, Liu & Barlow (2005)] Wesson, R., Liu, X.-W. & Barlow, M. J. 2005, MNRAS 362, 424
- [Zhang & Liu (2003)] Zhang, Y. & Liu, X.-W. 2003, A&A 404, 545
- [Zhang et al.(2004)] Zhang, Y., Liu, X.-W., Wesson, R., et al. 2004, MNRAS 351, 935
- [Zhang et al.(2005a)] Zhang, Y., Liu, X.-W., Liu, Y. & Rubin, R. H. 2005a, MNRAS 358, 457
- [Zhang et al.(2005b)] Zhang, Y., Liu, X.-W., Luo, S.-G., Péquignot, D. & Barlow, M. J. 2005b, A&A 442, 249
- [Zhang, Rubin & Liu (2005)] Zhang, Y., Rubin, R. H. & Liu, X.-W. 2005c, RevMexAA (Serie de Conf.) 23, 15