Interaction of a Moreton/EIT wave and a coronal hole
Abstract
We report high-cadence H observations of a distinct Moreton wave observed at Kanzelhöhe Solar Observatory associated with the 3B/X3.8 flare and CME event of 2005 January 17. The Moreton wave can be identified in about 40 H frames over a period of 7 min. The EIT wave is observed in only one frame but the derived propagation distance is close to that of the simultaneously measured Moreton wave fronts indicating that they are closely associated phenomena. The large angular extent of the Moreton wave allows us to study the wave kinematics in different propagation directions with respect to the location of a polar coronal hole (CH). In particular we find that the wave segment whose propagation direction is perpendicular to the CH boundary (“frontal encounter”) is stopped by the CH which is in accordance with observations reported from EIT waves (Thompson et al., 1998). However, we also find that at a tongue-shaped edge of the coronal hole, where the front orientation is perpendicular to the CH boundary (the wave “slides along” the boundary), the wave signatures can be found up to 100 Mm inside the CH. These findings are briefly discussed in the frame of recent modeling results.
1 Introduction
Moreton waves are arc-like propagating disturbances observed in chromospheric H images in association with solar flare/CME events (Moreton & Ramsey, 1960; Athay & Moreton, 1961). Uchida (1968) developed the theory that the Moreton waves are just the surface track of a fast-mode MHD wave which is coronal in nature. When the coronal wave front sweeps over the chromosphere, the enhanced pressure behind the wave front compresses the plasma which is observed as the typical down-up swing in H filtergrams. In recent years, the Extreme-ultraviolet Imaging Telescope (EIT) onboard the Solar and Heliospheric Observatory (SoHO) directly imaged many globally propagating disturbances in the low corona (e.g. Thompson et al., 1998, 1999), so-called EIT waves. Soon thereafter, coronal waves were also imaged in soft X-rays by the SXT/Yohkoh (e.g. Khan & Aurass, 2002; Hudson et al., 2003) and SXI/GOES-12 (Warmuth et al., 2005; Vršnak et al., 2006) instruments. Whether the EIT (and soft X-ray) waves are the coronal counterpart of Moreton waves as anticipated by Uchida’s model is still a matter of debate (e.g. Vršnak, 2005; Chen et al., 2005), in particular as EIT waves are on average a factor 2–3 slower than Moreton waves (Klassen et al. 2000; for a discussion on statistical selection effects see Warmuth et al. 2001). However, in cases where both the chromospheric Moreton and the coronal EIT wave were observed, they were lying on closely related kinematical curves providing strong evidence that, at least in these events, the Moreton waves are indeed the chromospheric counterpart of the coronal EIT waves (Thompson et al., 1999; Warmuth et al., 2001; Biesecker et al., 2002; Vršnak et al., 2002; Gilbert et al., 2004; Warmuth et al., 2004; Vršnak et al., 2006).
Some observations show that EIT waves tend to avoid active regions (ARs; Thompson et al., 1999; Wills-Davey & Thompson, 1999) and stop at the boundaries of coronal holes (CHs; Thompson et al., 1998) as well as near the separatrix between ARs where they may appear as a “stationary” front (Delannée & Aulanier, 1999). These observations were reproduced in numerical simulations treating EIT waves as fast-mode MHD waves (Wang, 2000; Wu et al., 2001; Ofman & Thompson, 2002) showing that the wave undergoes strong refraction and deflection when interacting with ARs and CHs, which are both high Alfvén velocity regions compared to the quiet Sun. Delannée & Aulanier (1999) and Chen et al. (2002, 2005) proposed different models where EIT waves are not real waves but the signature of a propagating perturbation related to magnetic field line opening in the wake of the associated CME.
Observational studies of the interaction of coronal waves with ARs and CHs are rare and usually hampered by the low cadence of the EIT instrument (12–15 min), which moreover restricts the studies to slow waves. In this paper we report high cadence H observations of a fast Moreton wave with well defined fronts extending over a large angular sector of 130∘ which can be followed up to 500 Mm from the wave ignition center, i.e. considerably farther out than Moreton waves are usually observed. Due to the 12-min cadence, the EIT wave can be observed solely in one single frame but is roughly co-spatial with the simultaneously observed Moreton wave fronts as expected from Uchida’s theory. The high-cadence H observations of this distinct Moreton wave provide us with the possibility to study in detail the interaction of the coronal wave as traced by its chromospheric ground track and a polar CH, which cannot be directly accessed in such detail with present coronal imagers.
2 Data and Observations
The Moreton wave associated with the 3B/X3.8 flare of 2005 January 17 (N15,W25; peak time 09:50 UT) was observed with high time cadence in full-disk H filtergrams at the Kanzelhöhe Solar Observatory (KSO; Otruba & Pötzi, 2003). KSO routinely takes full-disk H images with a cadence of 5–10 s and a spatial resolution of 22/pixel. When the flare-mode is triggered, additionally images in the red and blue wing of the H spectral line (at the off-band center wavelengths of H Å and H Å, respectively) are taken with a cadence of 60–80 s in each wing.
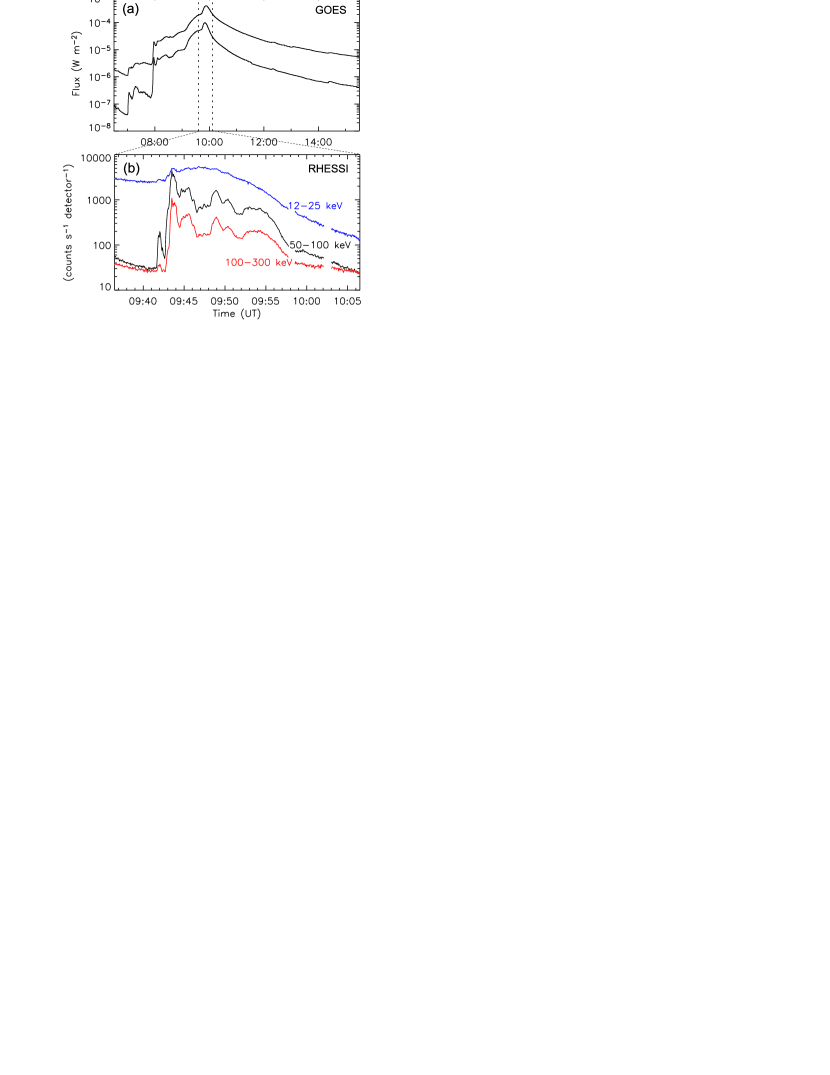
The flare evolution is complex and consists of several stages. The GOES flux (Fig. 1a) shows a sudden increase to M2 level around 8:00 UT, then gradually (over 100 min) increases further to the X2 level, and finally shows an impulsive enhancement at 09:40 UT which reaches the X4 peak at 09:50 UT. The Moreton wave is associated with this last peak. For this phase, also hard X-ray data from the Reuven Ramaty High Energy Solar Spectroscopic Imager (RHESSI; Lin et al. 2002) are available. Between about 09:41 and 09:58 UT spiky emission at high X-ray energies is observed (Figure 1b).
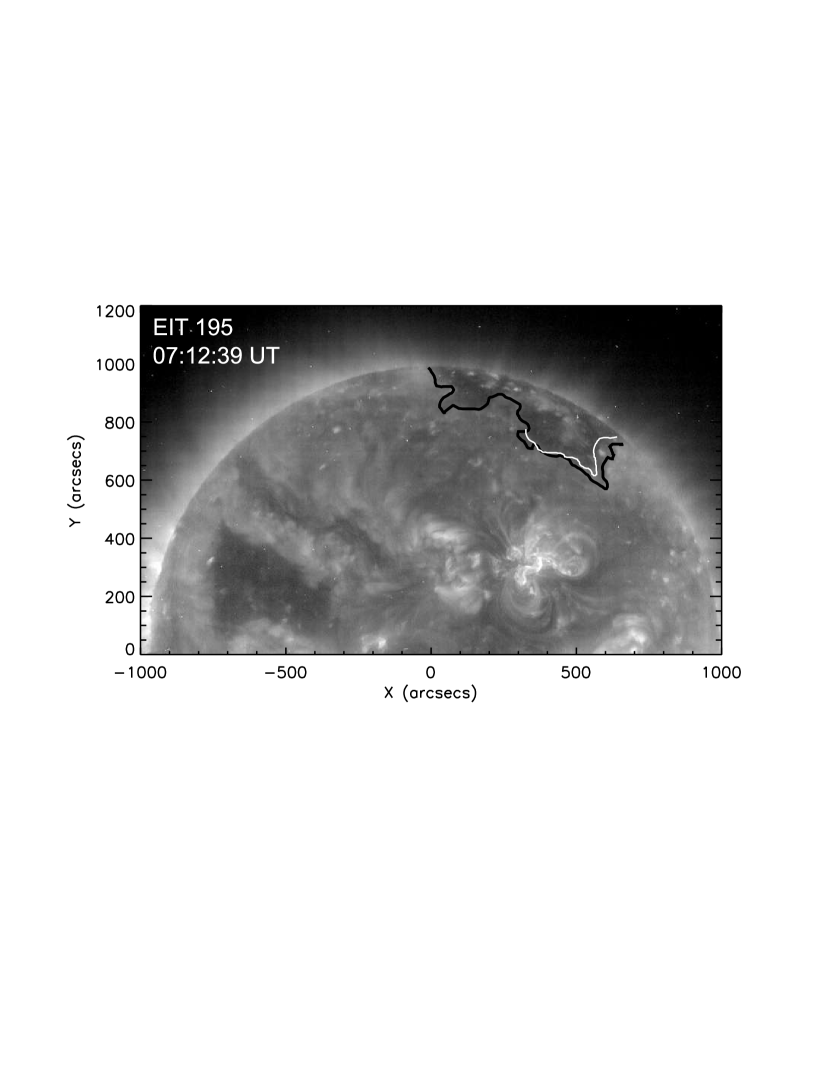
We also checked images from the Extreme-ultraviolet Imaging Telescope (EIT; Delaboudinière et al. 1995) for wave signatures and the location of the CH boundaries. Figure 2 shows an EIT Fe xii 195 Å (peak formation temperature of 1.6 MK) preflare image of the northern hemisphere of the Sun. The boundary of the polar CH, which is in the direction of propagation of the Moreton/EIT wave, is outlined on the image. Since the exact CH boundary is difficult to determine, we draw both the outer edge as well as an estimate of the diffuse inner edge of the CH boundary.
3 Results
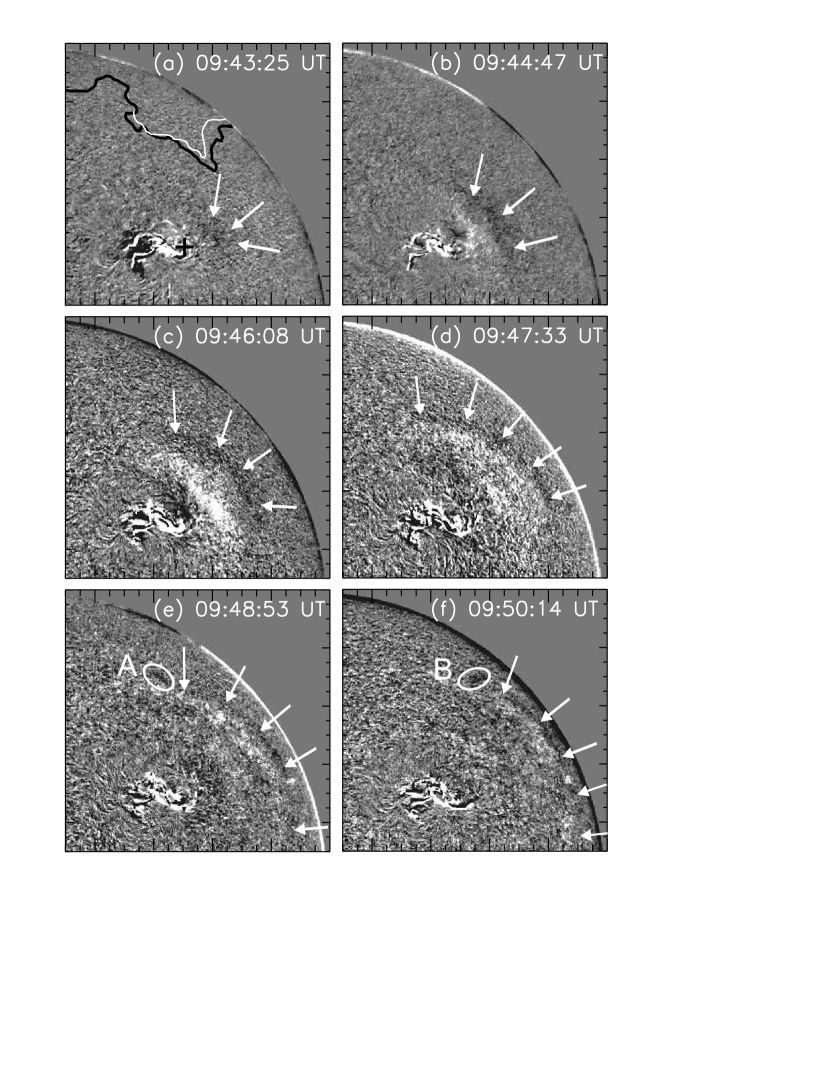
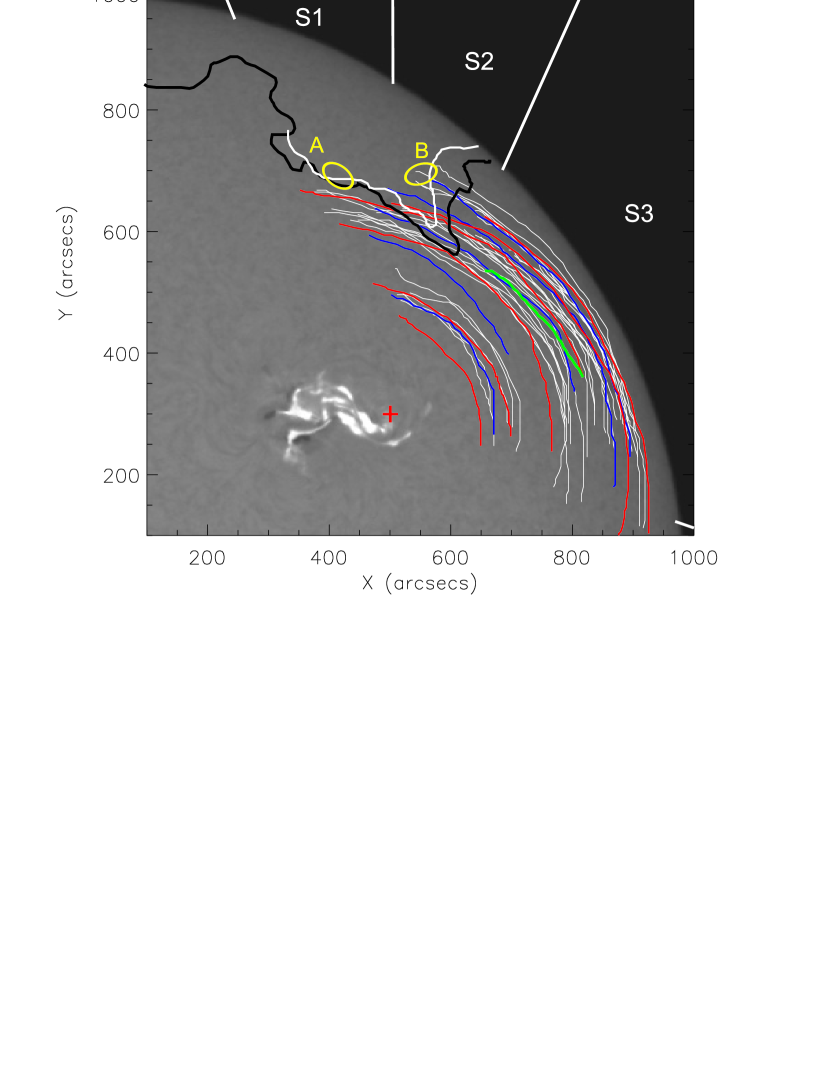
In total, the Moreton wave fronts could be identified in 30 images taken in the center, 6 images acquired in the red and 5 images in the blue wing of the H spectral line during the period 09:43:25 to 09:50:38 UT. Figure 3 shows a sequence of H Å running difference images of the Moreton wave. In Figure 4, the leading edges of all visually determined wave fronts are drawn on an H flare image. The boundaries of the polar CH (inner and outer estimates) determined from the EIT 195 Å image shown in Fig. 2 are also indicated in Figs. 3 and 4.
The Moreton wave fronts extend across a maximum sector of 130∘. When approaching the CH, there is a distinct change in the wave propagation characteristics leading to a distortion of the circular shape of the wavefront which can be directly seen, e.g., in Figs. 3d,e. From Figure 4 it is evident that the Moreton wave fronts partially intrude into the CH. The penetration depth depends on the estimated boundaries of the CH. However, even for the inner estimate, some wave fronts are observed inside the CH. Further evidence that the wave was able to intrude into the CH is provided by a feature located inside the CH (marked as “B” in Fig. 4) that was activated at the time when the wave passed its position. The wave also activated another feature (“A”) that is located along the border of the CH.
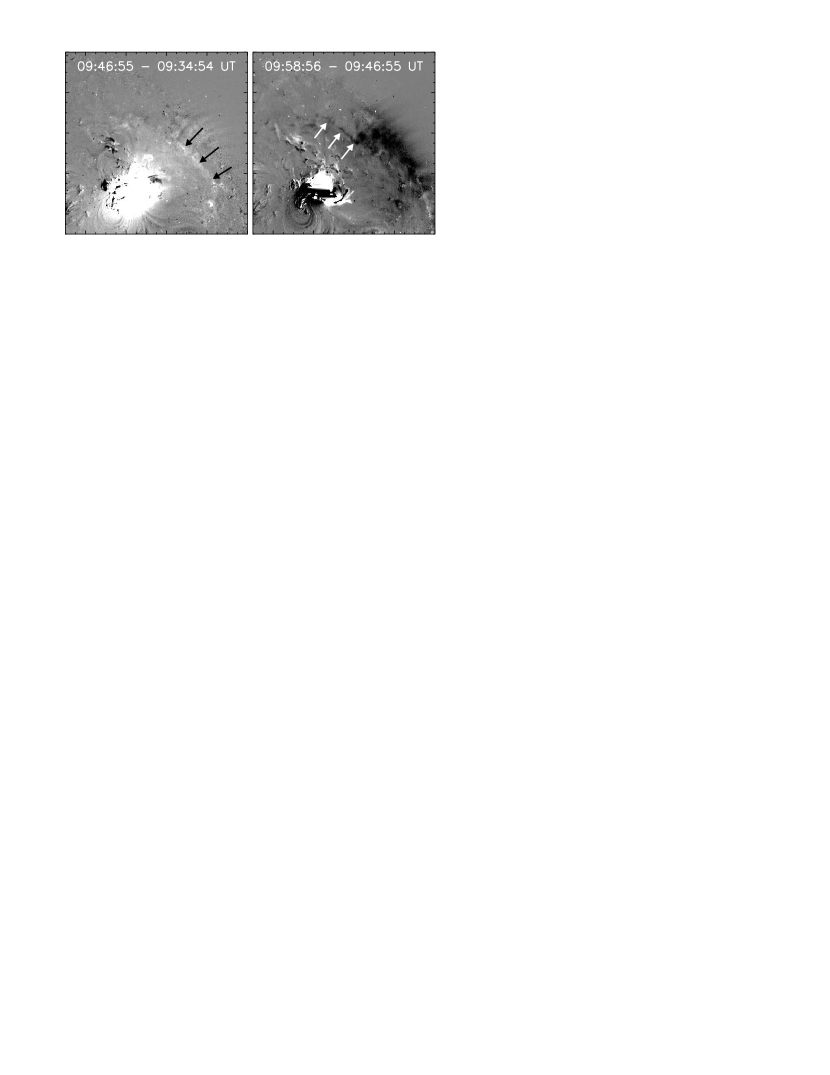
Figure 5 shows two EIT running difference images. Due to the low cadence of EIT (12 min), there is only one EIT wavefront visible on-disk at 09:46:55 UT (left panel). In the next EIT frame, the wave has already passed the disk and caused a coronal dimming behind it (right panel). The figure also reveals that a bright elongated feature located along the CH boundary (outer estimate) disappeared after the wave passage. Since this feature reappeared in later images (12 UT), it is possible that it was compressionally heated when hit by the wave, and was thus no longer visible in the EIT 195 Å passband. From the EIT observations we find no indication that the wave intruded into the CH. This may be related to the low image cadence of EIT which does not allow us to get insight into the EIT wave kinematics, or it may be a real difference between the EIT and H Moreton wave propagation characteristics.
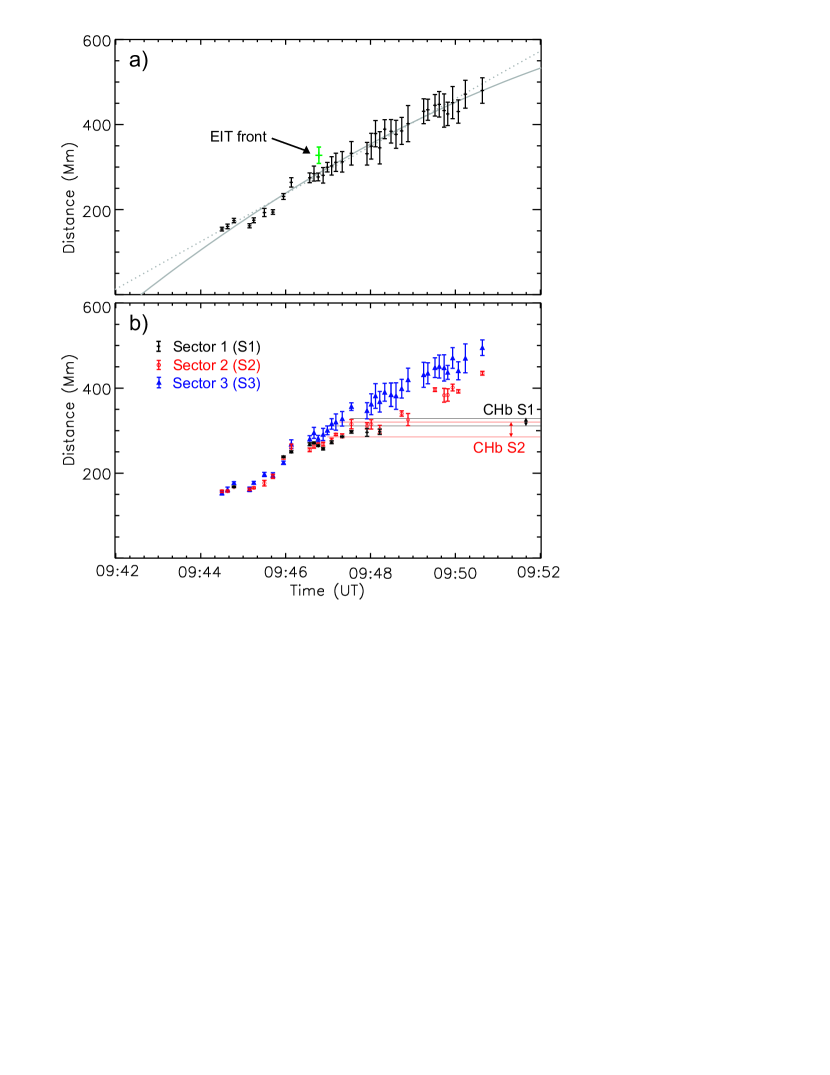
The Moreton wave ignition site was estimated by applying circular fits to the earliest observed H wave fronts, whereby the projection effect due to the spherical solar surface was taken into account (see Warmuth et al. 2004). We found the ignition site at and from Sun center, which is approximately NW from the centroid of the flare area impulsively activated during this time and outside the strong sunspots of the active region (cf. Fig 4). We then determined for each point of the wave front, i.e. considering its total angular extent, its distance from the wave ignition site measured along great circles on the solar surface. The derived time-distance diagram is plotted in Fig. 6a. At each instant the mean value derived from the distances of all points on one wave front together with the standard deviation (error bars) is plotted. The first wave front observed in H Å at 09:43:25 UT was ignored in the kinematical curves since it was very diffuse and therefore difficult to measure. In H, the wave propagation can be observed up to a distance of 500 Mm from the ignition site. This is considerably farther out than Moreton waves are usually observed. Warmuth et al. (2004) report an average value for the maximum distance of 300 Mm.
Also plotted in Fig. 6a are the results from a linear and quadratic least squares fit to the data. From the linear fit we obtain a mean wave speed of km s-1. The quadratic fit gives a significant deceleration of m s-2. From the quadratic fit we find a back-extrapolated start time of the wave of 09:42:40 UT s, from the linear fit it is 09:41:50 UT s. These start times point to the impulsive onset of the flare hard X-ray emission observed by RHESSI (see the first peak at 50–100 keV in Fig. 1). The distance derived from the EIT wave front at 09:46:55 UT indicates that the EIT wave is 50 Mm ahead but roughly co-spatial with the instantaneously observed Moreton wave fronts. This finding is in contrast to the statistical result that EIT waves are significantly (by a factor 2–3) slower than Moreton waves (Klassen et al., 2000) but agrees with Uchida’s sweeping skirt hypothesis in which the H Moreton wave is the chromospheric surface track of the coronal wave as observed by the EIT, SXT and SXI instruments.
In Fig. 6b, we present the time-distance diagram separately for three propagation sectors. Sector 1 includes the wave segment where the wave front and CH boundary are quasi parallel (“frontal encounter” of the wave). It is defined by the angular sector measured from the -axis with the wave center as origin. Sector 2 covers the direction of the western boundary of the CH (revealing a “tongue”-like shape) where the wave fronts impinge quasi-parallel as well as normal to the CH boundaries (defined by ). Sector 3 is in the direction that is unaffected by any CH boundary (defined by ). The three sectors are indicated in Fig. 4.
Up to about 09:46 UT all three kinematical curves are very similar. Thereafter, the wave segments of sectors 1 and 2 (i.e. in direction of the CH) slow down with respect to the undisturbed direction (sector 3). At 09:48:20 UT the wave segments in sector 1 stop at a distance of about 300 Mm, i.e. closely ahead of the CH boundary (see also Fig. 4). The wave propagating into the direction of the CH tongue (sector 2) also shows deceleration when approaching the CH, but some of the wavefronts intrude into the CH. At that time their propagation characteristics (inside the CH) are different from that of the wave segments propagating into sector 3, i.e. the undisturbed direction. In particular, their distance to the wave ignition center is about 60–90 Mm smaller than that of the wave front segments not disturbed by the CH, indicating that the wave fronts are significantly distorted by the presence of the CH.
4 Discussion and Conclusions
High cadence H observations of a distinct Moreton wave extending over an angular extent of 130∘ allowed us to study the propagation characteristics in different directions with regard to the presence of a polar CH. In particular we find that in the frontal encounter (sector 1), the wave stops at the CH boundary. On the other hand, at the western side of the CH where the front orientation is normal to the CH boundary, the wave can to a certain degree intrude into the CH. Depending on the different (i.e. inner/outer) CH boundary estimates we find a maximum penetration depth of 65 and 100 Mm, respectively. From the EIT observations we find no indication that the wave was able to intrude into the CH. This may be related to the low image cadence of EIT — while the Moreton wave can be measured in 40 frames, the EIT front is observed only in a single frame — or it may be a real difference between the EIT and H wave propagation characteristics.
In the MHD fast-mode hypothesis, the velocity of the coronal wave which propagates basically perpendicular to the magnetic field lines, is determined by the fast magnetosonic speed with the Alfvén speed and the sonic speed, where denotes the magnetic field strength, the mass density, the particle density, the temperature, the adiabatic exponent, the Boltzmann constant, the atomic mass unit, and the mean molecular mass. The Moreton wave of 17 January 2005 has its starting point at the NW border of AR 10720 and propagates through quiet Sun regions, partly into the direction of the northern polar CH. The higher magnetosonic speed in CHs compared to quiet Sun regions, which causes refraction and reflection of the wave at the CH, is mainly due to the higher Alfvén velocity in CHs. The density in CHs is about a factor 3–10 smaller compared to the quiet Sun (Gabriel, 1992; Young & Esser, 1999; Cranmer, 2000). Using the solar minimum magnetic field model by Banaszkiewicz et al. (1998) which is a reasonable representation of the large scale magnetic field outside ARs, we find that the global field is about a factor 3 smaller at the latitude of the wave initiation () than at 35–40∘, where the southern boundary of the CH is located. The temperature in CHs is up to a factor 2 smaller than the ambient coronal plasma. Thus, the Alfvén velocity in CHs is on average a factor 5–9 higher than in the ambient quiet Sun coronal plasma, whereas the sonic speed is about a factor 1.4 smaller. Assuming that in the corona the Alfvén velocity is significantly higher than the sonic speed (low- plasma), this implies that the fast magnetosonic speed in the CH is about 5–9 times higher than in the quiet corona. As argued by some authors (e.g. Wang, 2000), in quiet regions the plasma- could be of the order of unity and thus the sonic velocity comparable to the Alfvén velocity. However, also in this case the fast magnetosonic speed in the CHs is still considerably higher than in quiet regions, namely by a factor of 3–6.
The stopping of the wave at the CH boundary in the case of the “frontal encounter” was numerically simulated by Wang (2000) and Wu et al. (2001). As the wave approaches a region of high magnetosonic speed it is refracted away from that region and the wave propagation is halted (Wang, 2000; Wu et al., 2001). Due to the low values of the plasma-to-magnetic pressure ratio in the CH region, the mass motion is constrained (Wu et al., 2001) and the plasma piles up when the wave encounters the CH boundary. That could explain the activated (neutral line) feature “A”. There could be also a small transmitted component of the waves as seen in the simulations by Ofman & Thompson (2002). However, the magnitude of the transmitted component must be much smaller than that of the reflected component, and is therefore difficult to detect.
A related phenomenon is the leakage of a fast mode wave into the CH region (Wu et al., 2001). Our observations apparently reveal such a leakage at the western edge of the CH, where the wave passed the CH tongue. After passing the tongue we still see wave signatures within the CH region. Moreover, the wave caused there an activation of feature “B”. Since that happened in a different geometry (the wave is here “sliding along” the CH boundary), the activation was most likely due to the interaction of the wave flank that managed to penetrate into the CH from aside, and the pre-existing magnetic structure therein. Such a process is possibly similar to the wave/AR interaction modeled by Ofman & Thompson (2002), since ARs are as CHs high Alfvén/magnetosonic velocity regions. It was shown by Ofman & Thompson (2002) that when the fast magnetosonic wave encounters an AR it undergoes strong reflection and refraction. On the other hand, transient currents are induced within the AR, and the resulting Lorentz force causes dynamical distortion of the magnetic field structure. The resulting magnetic compression of plasma generates flows which could be seen as an AR activation, similar to what we observed by the activation of feature B inside the CH.
The present analysis shows the importance of high time cadence observations to interpret properly the phenomenon of the interaction of a coronal/Moreton wave with a CH. Up to now, conclusions were drawn only from EIT observations which are taken with low time cadence, and thus might miss important details.
References
- Athay & Moreton (1961) Athay, R. G. & Moreton, G. E. 1961, ApJ, 133, 935
- Banaszkiewicz et al. (1998) Banaszkiewicz, M., Axford, W. I., & McKenzie, J. F. 1998, A&A, 337, 940
- Biesecker et al. (2002) Biesecker, D. A., Myers, D. C., Thompson, B. J., Hammer, D. M., & Vourlidas, A. 2002, ApJ, 569, 1009
- Chen et al. (2005) Chen, P. F., Fang, C., & Shibata, K. 2005, ApJ, 622, 1202
- Chen et al. (2002) Chen, P. F., Wu, S. T., Shibata, K., & Fang, C. 2002, ApJ, 572, L99
- Cranmer (2000) Cranmer, S. 2000, in Encyclopedia of Astronomy and Astrophysics, Ed. P. Murdin, 496–501
- Delaboudinière & et al. (1995) Delaboudinière, J.-P., Artzner, G. E., Brunaud, J. et al. 1995, Sol. Phys., 162, 291
- Delannée & Aulanier (1999) Delannée, C. & Aulanier, G. 1999, Sol. Phys., 190, 107
- Gabriel (1992) Gabriel, A. 1992, in The Sun: A Laboratory for Astrophysics, Eds. J. T. Schmelz and J. C. Brown, NATO ASI Series 373, 277–296
- Gilbert et al. (2004) Gilbert, H. R., Holzer, T. E., Thompson, B. J., & Burkepile, J. T. 2004, ApJ, 607, 540
- Hudson et al. (2003) Hudson, H. S., Khan, J. I., Lemen, J. R., Nitta, N. V., & Uchida, Y. 2003, Sol. Phys., 212, 121
- Khan & Aurass (2002) Khan, J. I. & Aurass, H. 2002, A&A, 383, 1018
- Klassen et al. (2000) Klassen, A., Aurass, H., Mann, G., & Thompson, B. J. 2000, A&AS, 141, 357
- Lin & et al. (2002) Lin, R. P., Dennis, B. R., Hurford, G. J. et al. 2002, Sol. Phys., 210, 3
- Moreton & Ramsey (1960) Moreton, G. E. & Ramsey, H. E. 1960, PASP, 72, 357
- Ofman & Thompson (2002) Ofman, L. & Thompson, B. J. 2002, ApJ, 574, 440
- Otruba & Pötzi (2003) Otruba, W. & Pötzi, W. 2003, Hvar Observatory Bulletin, 27, 189
- Thompson et al. (1999) Thompson, B. J., Gurman, J. B., Neupert, W. M., Newmark, J. S., Delaboudinière, J.-P., St. Cyr, O. C., Stezelberger, S., Dere, K. P., Howard, R. A., & Michels, D. J. 1999, ApJ, 517, L151
- Thompson et al. (1998) Thompson, B. J., Plunkett, S. P., Gurman, J. B., Newmark, J. S., St. Cyr, O. C., & Michels, D. J. 1998, Geophys. Res. Lett., 25, 2465
- Uchida (1968) Uchida, Y. 1968, Sol. Phys., 4, 30
- Vršnak (2005) Vršnak, B. 2005, EOS Transactions, 86, 112
- Vršnak et al. (2002) Vršnak, B., Warmuth, A., Brajša, R., & Hanslmeier, A. 2002, A&A, 394, 299
- Vršnak et al. (2006) Vršnak, B., Warmuth, A., Temmer, M., Veronig, A., Magdalenić, J., Hillaris, A., & Karlický, M. 2006, A&A, 448, 739
- Wang (2000) Wang, Y.-M. 2000, ApJ, 543, L89
- Warmuth et al. (2005) Warmuth, A., Mann, G., & Aurass, H. 2005, ApJ, 626, L121
- Warmuth et al. (2001) Warmuth, A., Vršnak, B., Aurass, H., & Hanslmeier, A. 2001, ApJ, 560, L105
- Warmuth et al. (2004) Warmuth, A., Vršnak, B., Magdalenić, J., Hanslmeier, A., & Otruba, W. 2004, A&A, 418, 1101
- Wills-Davey & Thompson (1999) Wills-Davey, M. J. & Thompson, B. J. 1999, Sol. Phys., 190, 467
- Wu et al. (2001) Wu, S. T., Zheng, H., Wang, S., Thompson, B. J., Plunkett, S. P., Zhao, X. P., & Dryer, M. 2001, J. Geophys. Res., 106, 25089
- Young & Esser (1999) Young, P. R. & Esser, R. 1999, Space Science Reviews, 87, 345