Warm Dust and Spatially Variable PAH Emission
in the Dwarf Starburst
Galaxy NGC 1705
Abstract
We present Spitzer observations of the nearby dwarf starburst galaxy NGC 1705 obtained as part of the Spitzer Infrared Nearby Galaxies Survey. The galaxy morphology is very different shortward and longward of 5 m: optical and short-wavelength IRAC imaging shows an underlying red stellar population, with the central super star cluster (SSC) dominating the luminosity; longer-wavelength IRAC and MIPS imaging reveals warm dust emission arising from two off-nuclear regions that are offset by 250 pc from the SSC and that dominate the far-IR flux of the system. These regions show little extinction at optical wavelengths. The galaxy has a relatively low global dust mass ( 2 105 M⊙, implying a global dust-to-gas mass ratio 2–4 times lower than the Milky Way average, roughly consistent with the metallicity decrease). The off-nuclear dust emission appears to be powered by photons from the same stellar population responsible for the excitation of the observed H emission; these photons are unassociated with the SSC (though a contribution from embedded sources to the IR luminosity of the off-nuclear regions cannot be ruled out). Low-resolution IRS spectroscopy shows moderate-strength PAH emission in the 11.3 m band in the more luminous eastern peak; no PAH emission is detected in the SSC or the western dust emission complex. There is significant diffuse emission in the IRAC 8 m band after starlight has been removed by scaling shorter wavelength data; the fact that IRS spectroscopy shows spatially variable PAH emission strengths compared to the local continuum within this diffuse gas suggests caution in the interpretation of IRAC diffuse 8 m emission as arising from PAH carriers alone. The nebular metallicity of NGC 1705 falls at the transition level of 0.35 Z⊙ found by Engelbracht and collaborators, below which PAH emission is difficult to detect; the fact that a system at this metallicity shows spatially variable PAH emission demonstrates the complexity of interpreting diffuse 8 m emission in galaxies. NGC 1705 deviates significantly from the canonical far-infrared vs. radio correlation, having significant far-infrared emission but no detected radio continuum.
Subject headings:
galaxies: dwarf — galaxies: irregular — galaxies: ISM — galaxies: individual (NGC 1705) — infrared: galaxies1. Introduction
Local dwarf galaxies serve as potential examples of young galaxies in formation. Due in part to their typically low metal abundances, the characteristics of the interstellar medium (ISM) differ markedly from those in larger, more metal-rich systems. In cases where spatially and temporally concentrated star formation occurs, “dwarf starburst” galaxies inject energies into the ISM that can be a substantial fraction of their system binding energies; these bursts overwhelm the shallow potential wells of the parent galaxy and result in spectacular galactic winds (e.g., Heckman et al., 2001; Martin et al., 2002; Ott et al., 2003). Starbursts in low-mass dwarfs represent the low-luminosity end of the starburst superwind spectrum; outflows increase in strength up to the ultraluminous infrared galaxies (Heckman et al., 1990).
In extreme cases, single star clusters may input sufficient kinetic energy to drive galactic winds in dwarf galaxies. The responsible “super-star clusters”(SSCs) have typical ages 1 Gyr and dynamical masses 105–108 M⊙; the most massive may be globular cluster progenitors. While many massive starburst and interacting systems are able to attain the densities and pressures requisite for SSC formation (i.e., n 106 cm-3, P/k 108–109 cm-3 K, radii 5 pc; see O’Connell 2004 for a recent review), the formation rate and maximum luminosity of SSCs appear to generally scale with the total star formation rate; typically these clusters form a power-law mass distribution. Hence, massive, interacting galaxies such as the “Antennae” (NGC 4038/4039) are able to produce hundreds of massive young clusters (Whitmore & Schweizer, 1995). Dwarf galaxies, on the other hand, produce relatively few massive SSCs, and their formation may follow a different track than those of massive clusters in larger galaxies; the cluster luminosity functions appear to be discontinuous in dwarfs, with SSCs being much more massive than other clusters (though this may be a statistical effect; see Whitmore 2004).
At a distance of 5.1 0.6 Mpc (Tosi et al., 2001), NGC 1705 is one of the best-studied dwarf starburst galaxies. The optical emission is dominated by the “super-star cluster” (SSC) NGC 1705-1 (Meurer et al., 1995), a compact (effective radius 1.5 pc; Smith & Gallagher, 2001), massive (dynamical mass 105 M⊙; Ho & Filippenko, 1996) cluster of age 12 Myr (Vázquez et al., 2004). The age of the cluster and the amount of ionized gas relative to the UV luminosity are consistent with most of the O stars having died out, so the system may be more correctly deemed a “post-starburst” galaxy (Heckman & Leitherer, 1997). Dominant SSCs are comparatively rare in dwarf starburst galaxies, and NGC 1705 is one of the few systems where the luminosity of a single cluster dominates the galaxy’s UV light. The recent star formation is driving a multi-phase outflow from the disk, seen in the neutral, ionized, coronal, and X-ray emitting gas phases (Heckman & Leitherer, 1997; Hensler et al., 1998; Heckman et al., 2001). The H i dynamics show normal solid-body rotation, though extra-planar gas may also be involved with the outflow (Meurer et al., 1998).
NGC 1705 has undergone strong recent star formation; Annibali et al. (2003) compare synthetic color-magnitude diagrams to optical and near-infrared photometry to estimate a rate of 0.3 M⊙ yr-1; combining with the total H i mass of 1.04 108 M⊙ (using the integrated flux from Meurer et al. 1998 scaled to our adopted distance) implies a gas depletion timescale of only 0.35 Gyr. Given the galaxy’s recent starburst, its sub-solar nebular metallicity [Z 35% Z⊙ (using the solar oxygen abundance of Asplund et al. 2004); Lee & Skillman 2004], its gas-rich central disk (NH 1021 cm-2; Meurer et al. 1998), and the presence of a SSC, it presents an ideal example of a starbursting dwarf galaxy with an extreme star-forming ISM. We present Spitzer imaging and spectroscopy of this system, obtained as part of the Spitzer Infrared Nearby Galaxies Survey (SINGS; Kennicutt et al., 2003), with the aim of characterizing the nature of warm dust and PAH emission in the metal-poor, active ISM. This system has one of the highest current star formation rates of any dwarfs in the SINGS sample and is the only dwarf in the survey that contains a known SSC.
2. Observations and Data Reduction
For a complete overview of the SINGS observational strategies, see Kennicutt et al. (2003). NGC 1705 was observed in standard IRAC imaging mode (producing two 5.2′ 5.2′ fields, offset by 1′) and in MIPS scan mapping mode (covering 0.5∘, with foreground and background sources dominating the emission at 1.5 D25 and beyond). IRS spectral mapping was performed using all four modules; the resulting maps cover an area larger than the optical body in all modules. IRS and IRAC data were obtained in 2004 July (62.4 minutes in IRS long-low and short-low modules, and 18.5 minutes in IRAC imaging); MIPS data were obtained in 2004 September (58.6 minutes in all three modules).
All data were processed by the SINGS pipelines. The IRAC pipeline reduces basic calibrated data images; flux levels are uncertain at the 10% level due to systematics (see discussion of aperture correction effects in § 3). The MIPS Instrument Team Data Analysis Tool (Gordon et al., 2005) was used to process the MIPS data, while the Cubism tool (J. D. Smith et al., in preparation) was used for spectral extraction and analysis of the IRS data. Systematic uncertainties limit the absolute flux calibration to 10% in the MIPS 24 m band and to 20% in the MIPS 70 and 160 m bands; the flux uncertainty of the IRS data is 20%. The FWHMs of the MIPS PSFs are 6″, 18″, and 38″ at 24, 70, and 160 m, respectively. Global fluxes were measured after foreground/background source removal and background subtraction, using matched 105″ radius circular apertures, centered on the SSC, in all MIPS and IRAC wavebands; this radius is slightly larger than the fields of view shown in Figure 1. No emission associated with NGC 1705 is present outside the area shown in Figure 1. Since our measured global flux densities agree within the errors with those published in Dale et al. (2005), we adopt their values as our final global flux density measurements. The 11 m PAH map was created from the full spectral data cube by averaging the flux density over the wavelength region 11.115 – 11.860 m, and subtracting the average continuum in the flanking regions (10.805 – 11.115 m and 11.860 – 12.357 m).
The H image analyzed here was taken from the public archive of the Palomar/Las Campanas Imaging Atlas of Blue Compact Dwarf Galaxies (Gil de Paz et al., 2003). These images were obtained with the du Pont 100-inch telescope of the Las Campanas Observatory. The total flux of the galaxy was matched to the value presented in Gil de Paz et al. (2003); note that the SSC has been removed from the H image used in this paper.
3. Warm Dust and PAH Emission in NGC 1705
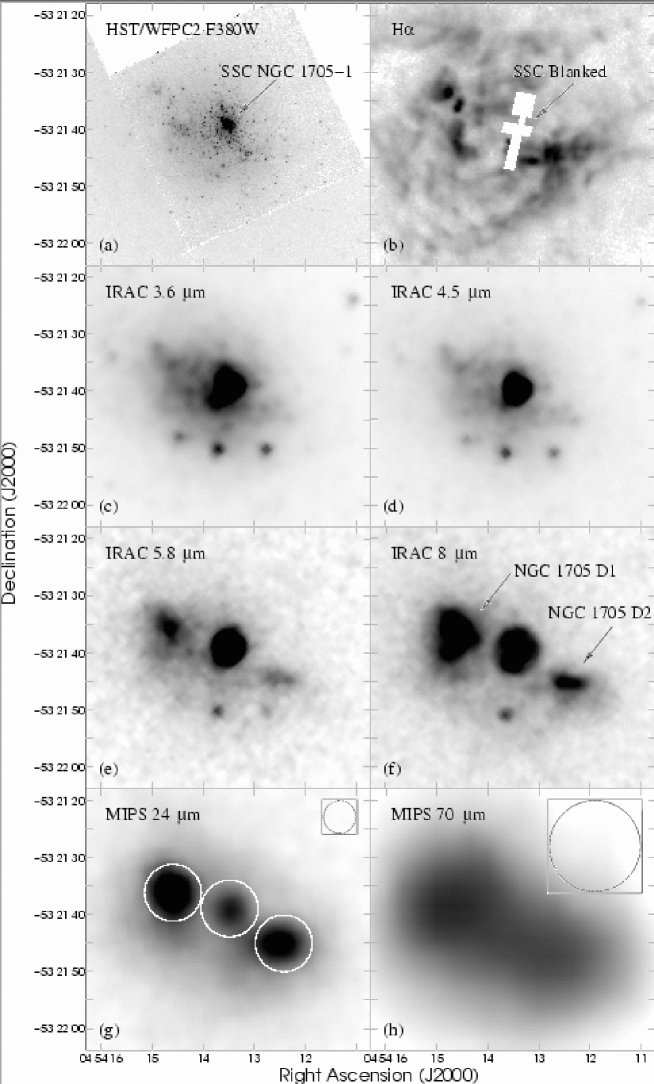
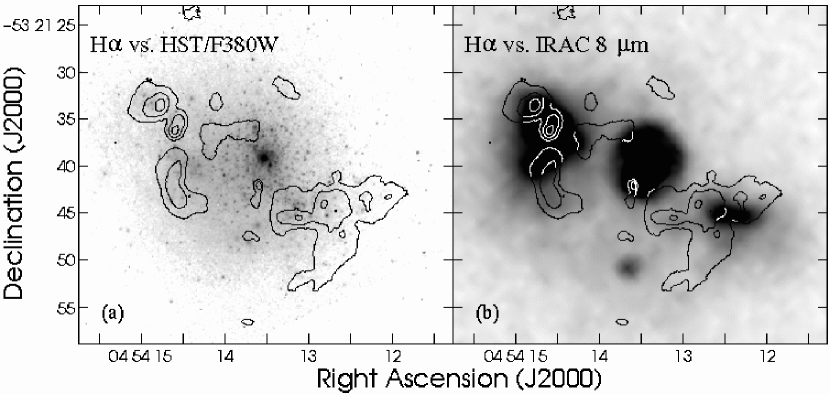
Figure 1 shows images of NGC 1705 at 8 different wavelengths. (a) shows the near-UV ( 380 nm) continuum, where the SSC is the brightest single UV source in the galaxy (producing more than 40% of the UV photons; Vázquez et al., 2004). There is an underlying stellar continuum containing a sizeable fraction of intermediate-mass stars: in the Planetary Camera field of view shown in Figure 1(a), Tosi et al. (2001) find that 50% of the detected stars have masses 3 M⊙ (corresponding to an age of 500 Myr), while 10% have masses 7 M⊙ (ages 60 Myr). H emission is present throughout the optical body of the system (see Figure 1b; note that the SSC has been blanked in this image); the highest-surface brightness emission is offset from the SSC by 250 pc, coincident with the morphology of dust observed in the longer-wavelength Spitzer bands (see below).
Moving into the near- and mid-infrared (IR), the IRAC 3.6 and 4.5 m images (see Figures 1c, d) are sensitive to the underlying red stellar population (typically consisting of young red supergiants and an older stellar population). The 3.6 m band is also known to contain some PAH emission bands (Helou et al., 2000; Lu et al., 2003; Helou et al., 2004) as well as emission from H ii gas processes (e.g., Wang et al., 2004). The IRAC 5.8 and 8 m bands (see Figures 1e, f) are primarily sensitive to dust and PAH emission, though a stellar component is present as well (e.g., Pahre et al., 2004). Note that the SSC retains a high surface brightness in the near- and mid-IR, though by 24 m the off-nuclear dust emission regions contribute the bulk of the global flux density (see Figure 1g).
| Parameter | NGC 1705 D1 | NGC 1705 D2 | SSC NGC 1705-1 | NGC 1705 Total Galaxy |
|---|---|---|---|---|
| (J2000) | 04:54:14.59 | 04:54:12.42 | 04:54:13.48 | 04:54:13.5 |
| (J2000) | 53:21:36.20 | 53:21:45.07 | 53:21:38.95 | 53:21:40 |
| H FluxbbDerived using the H image presented in Gil de Paz et al. (2003), assuming their global H flux; units of 10-13 erg s-1 cm-2. | 1.8 0.3 | 2.2 0.3 | 0.92 0.14 | 25.3 3.8 |
| IRAC 3.5 m Flux DensityaaAll measurements are in units of mJy, unless otherwise noted; Spitzer flux densities derived without aperture corrections. Apertures of radius 5.7″ are used to measure the flux densities presented, unless otherwise noted. | 1.8 0.2 | 0.8 0.08 | 6.6 0.7 | 28 3 |
| IRAC 4.5 m Flux DensityaaAll measurements are in units of mJy, unless otherwise noted; Spitzer flux densities derived without aperture corrections. Apertures of radius 5.7″ are used to measure the flux densities presented, unless otherwise noted. | 1.2 0.2 | 0.7 0.07 | 4.6 0.5 | 19 2 |
| IRAC 5.7 m Flux DensityaaAll measurements are in units of mJy, unless otherwise noted; Spitzer flux densities derived without aperture corrections. Apertures of radius 5.7″ are used to measure the flux densities presented, unless otherwise noted. | 1.9 0.2 | 0.9 0.09 | 4.1 0.5 | 12 2 |
| IRAC 7.9 m Flux DensityaaAll measurements are in units of mJy, unless otherwise noted; Spitzer flux densities derived without aperture corrections. Apertures of radius 5.7″ are used to measure the flux densities presented, unless otherwise noted. | 3.4 0.4 | 1.7 0.2 | 4.5 0.5 | 22 2 |
| MIPS 24 m Flux DensityaaAll measurements are in units of mJy, unless otherwise noted; Spitzer flux densities derived without aperture corrections. Apertures of radius 5.7″ are used to measure the flux densities presented, unless otherwise noted. | 6.0 0.6 | 4.8 0.5 | 3.9 0.4 | 52 5 |
| MIPS 70 m Flux DensityaaAll measurements are in units of mJy, unless otherwise noted; Spitzer flux densities derived without aperture corrections. Apertures of radius 5.7″ are used to measure the flux densities presented, unless otherwise noted. | 126 63ccFluxes of NGC 1705 D1 and D2 at 70 m are measured using apertures of 9″ radius (i.e., the FWHM of the 70 m beam). Errorbars reflect both systematics and the potential contribution from the SSC (estimated by assuming a flat SED as suggested from the data between 4.5 and 24 m). | 109 55ccFluxes of NGC 1705 D1 and D2 at 70 m are measured using apertures of 9″ radius (i.e., the FWHM of the 70 m beam). Errorbars reflect both systematics and the potential contribution from the SSC (estimated by assuming a flat SED as suggested from the data between 4.5 and 24 m). | N/A | 1090 220 |
| MIPS 160 m Flux DensityaaAll measurements are in units of mJy, unless otherwise noted; Spitzer flux densities derived without aperture corrections. Apertures of radius 5.7″ are used to measure the flux densities presented, unless otherwise noted. | N/A | N/A | N/A | 1200 250 |
There is a striking difference in the galaxy’s morphology shortward and longward of 5 m. There is a negligible amount of off-nuclear dust emission in the 4.5 m band, while longer wavelengths show two strong mid- and far-IR emission peaks that are offset from the SSC and coincident with the H surface brightness maxima. These dust emission regions, labeled as NGC 1705 D1 and D2 (see Figure 1f), are the highest-surface brightness regions in NGC 1705 in the MIPS bands (together contributing 25% of the 24 m global flux density; see below). We discuss the nature of the off-nuclear emission in more detail in § 3.1.
We measure the flux densities of the three individual dust emission peaks (NGC 1705 D1, D2, and NGC 1705 SSC-1), at a resolution slightly larger than that of the MIPS 24 m band (FWHM 5.7″), in the IRAC, MIPS 24 m, and H images. Fluxes were extracted using non-overlapping apertures of 10″ diameter, centered on the locations given in Table 3 and shown in Figure 1. Due to the distance and size of NGC 1705, we lose sufficient resolution by the 70 m band to distinguish the individual emission peaks. No aperture corrections were applied to the measured flux densities; aperture corrections for extended sources are estimated to be between 4–25% (e.g., Pahre et al., 2004). For point sources, the aperture corrections are estimated to be of order 5–7% in the IRAC bands for this aperture size, while at 24 m the correction may be as large as a factor of 2; this effect may be important for the discussion in § 3.1 and 3.2. The values listed in Table 3 demonstrate that the spectral energy distributions (SEDs) from both NGC 1705 D1 and D2 are beginning to rise towards a far-IR peak characteristic of dust emission in normal galaxies (see, e.g., Dale et al., 2005). The SED of the SSC, however, appears to flatten out by the MIPS 24 m band, suggesting that it contributes only a small fraction of the total far-IR luminosity of the system; SED model fits to each of the emission peaks is not feasible, given the lack of resolution at the longer MIPS wavelengths (but see Dale et al. 2005 and § 3.1 for the galaxy’s global SED and model fit).
3.1. The Origin and Characteristics of Nebular and Dust Emission at D1 and D2
As shown in Figures 1 and 2, both the IR and H emission peaks (NGC 1705 D1 and D2) are displaced from the SSC by 250 pc. Vázquez et al. (2004) use UV spectroscopy to demonstrate that the SSC produces the bulk of the UV luminosity of NGC 1705, but too few ionizing photons to produce the H emission seen hundreds of pc away at the locations of D1 and D2. Thus, young, massive stars (stellar masses in the range 10-30 M⊙, with corresponding main sequence lifetimes 5–30 Myr, depending on stellar evolution models and adopted metallicity; see Tosi et al. 2001 and Annibali et al. 2003) appear to be the source of the ionizing photons leading to the observed off-nuclear H emission.
To assess whether the stellar population creating this H emission also powers the observed dust emission at locations D1 and D2, it is instructive to compare the star formation rates derived from H and from the IR. Due to the distance of the system, the physical resolution at 70 and 160 m precludes the use of a total IR-based star formation rate for the individual peaks D1 and D2 (e.g., Dale & Helou, 2002). We instead apply the monochromatic calibration between H and 24 m luminosity derived in M 51 by Calzetti et al. (2005):
| (1) |
where L24 and LHα are the observed luminosities at 24 m and H, respectively; the intrinsic H/P ratio is assumed to be 8.734; and we apply the central wavelength of 24.0 m to convert the 24 m flux density to a luminosity measurement. Performing this comparison, we find that the observed 24 m luminosities of D1 and D2 are factors of 3 and 5 lower than predicted from the H luminosities alone. Note that extinction at H, while minimal [Lee & Skillman (2004) find only marginal AV values of 0.0 and 0.47 mag for D1 and D2, respectively], would make this discrepancy larger; aperture corrections at 24 m (which may be as large as a factor of two) will bring these values into better agreement.
A lower star formation rate derived from the IR compared to H has been found for other dwarf galaxies in the SINGS sample (Cannon et al. 2005; Walter et al., in prep.). This effect has been attributed, to first order, to the lower dust contents found in the metal-poor ISM. In NGC 1705, H and 24 m star formation rates agree within a factor of a few, suggesting that a substantial component of the dust emission at D1 and D2 is powered by re-radiation of photons from the same sources that are responsible for the H emission. The offset may be due to differences in ISM physics between metal-rich and metal-poor galaxies. While the energetics are comparable, we cannot rule out a contribution from embedded sources that do not contribute to the observed H emission. In this regard, it is worth noting that some low-metallicity galaxies harbor heavily-embedded star formation regions (e.g., SBS 0335052; Houck et al. 2004, Hunt et al. 2004).
An estimate of the dust mass in each component is not possible, given our inability to resolve the two peaks at 160 m. The total dust mass in NGC 1705 can be very simplistically estimated by applying the following relation:
| (2) |
where D is the distance to the galaxy, is the flux density, represents the absorption opacity of the dust at frequency (given in Li & Draine 2001), and is the Planck function evaluated at temperature T, derived by fitting a blackbody modified by a emissivity function to the 70 and 160 m data. As shown in Figure 3, such a single-temperature solution is unable to simultaneously fit the observed 24, 70 and 160 m data; the fit to the 70 and 160 m flux densities grossly underestimates the observed 24 m flux density, implying a two-component dust grain population (e.g., cool grains at 28 K, warmer grains at 55 K). Similar conclusions are reached based on ISO observations of nearby galaxies (Haas et al., 1998; Popescu et al., 2002; Hippelein et al., 2003).
The inability of a single blackbody function to fit the observed flux densities suggests that a more sophisticated model of the far-IR SED is needed. The SED models of Dale et al. (2001) and Dale & Helou (2002) provide a more robust treatment of the multiple grain populations that contribute to the far-IR emission in a galaxy (see Dale et al. 2005 for an application of this method to the entire SINGS sample). Using the fit parameters for the global SED of NGC 1705 presented in Dale et al. (2005) and shown in Figure 3, the models of Dale & Helou (2002) imply that the dust mass derived using single-temperature fitting (here, to the observed 70 and 160 m data) underestimates the true dust mass by a factor of 9. This application of the Dale & Helou (2002) models results in a global dust mass estimate of (3.8 1.9) 105 M⊙.
A third estimate of the dust mass in the galaxy can be found using the models of Li & Draine (2001, 2002). Here, radiation field strengths are varied via power-law distributions; PAH, silicate and graphite grains are illuminated and the resulting SEDs can be compared to the observations. The fit of these models to our observations is also shown in Figure 3. The observed SED is well-reproduced by 2.3 107 M⊙ of gas and dust, assuming the latter is of “LMC2-type” (see Weingartner & Draine 2001). The dust-to-gas ratio () of LMC2-type dust is estimated to be 0.003, which implies a total dust mass of 7 M⊙ (with an uncertainty of 50%) in NGC 1705.
Given the uncertainties, we consider the agreement of the dust mass estimates using the SED models of Dale et al. (2001) and Dale & Helou (2002) and the models of Li & Draine (2001, 2002) to be satisfactory. We adopt the mean value of these two estimates, (2.2 1.1) 105 M⊙, as the global dust mass of NGC 1705. Comparing this total dust mass with the H i mass measured in a matching aperture (8.9 107 M⊙; Meurer et al. 1998) implies a global of 2.5 10-3, uncertain by 50%. This value is a factor of 2–4 lower than the Galactic average values (MW 0.006–0.01; Sodroski et al. 1997, Li 2005), but larger than values found for the more metal-poor Small Magellanic Cloud (Z 23% Z⊙; Dufour 1984; average dust-to-gas ratios 10-30 times MW; Stanimirovic et al. 2000; Bot et al. 2004, Stanimirovic et al. 2005). If there is an additional amount of cold dust in NGC 1705 that radiates longward of 160 m (similar to what is seen in some dwarf galaxies with very cold SEDs; e.g., Tuffs et al. 2002), then this value will be a lower limit.
3.2. Quantifying PAH Emission Strengths

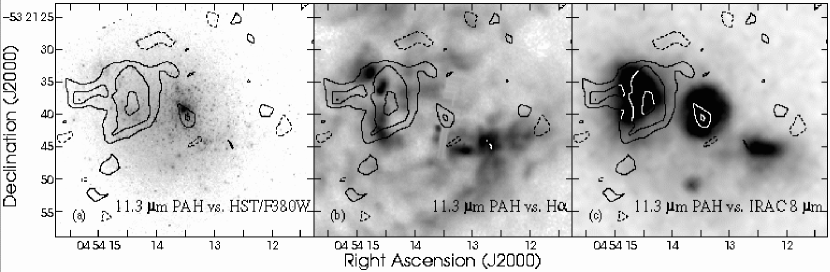
Since the IRAC 8 m band samples the 7.7 m PAH emission complex as well as the underlying warm dust continuum (see Regan et al., 2004; Engelbracht et al., 2005), it is instructive to quantify the amount of the diffuse emission at 8 m that is due to PAH emission. Using the Short-Low IRS module ( 6-14 m, R 100), a summation over the wavelength ranges surrounding the two brightest PAH bands (7.5-9.1 m and 10.7-11.7 m) yields a detection of the 11.3 m PAH complex in NGC 1705 D1 only, with a nominal rise in the continuum level surrounding the 7.7 m PAH feature (though of low S/N; see the spectrum of this region presented in Figure 4). There are no PAH bands detected in NGC 1705 D2 or towards the SSC. In the top panel of Figure 4 we also overlay a typical PAH-dominated spectrum from observations of the star-forming spiral galaxy NGC 7331 (Smith et al., 2004); note the agreement of the relative strengths of the 11.3 and 7.7 m PAH bands in NGC 1705 D1 with those of the example PAH spectrum.
Figure 5 shows contours of a (continuum subtracted) IRS spectral summation of the 11.3 m PAH emission, overlaid on the HST/WFPC2 F380W and H images. PAH emission is associated with high-surface brightness H emission in the eastern dust emission complex (NGC 1705 D1), suggesting that local radiation density is an important parameter that affects the appearance of emission from these molecules in the ISM (but note the trend of decreasing PAH emission strength with increasing radiation field density discussed in Madden, 2005). However, radiation field strength alone seems to be insufficient for the emergence of PAH emission: there is high surface brightness H emission associated with NGC 1705 D2, but no associated PAH emission is seen (see also the relative flux ratios in Table 3). Previous studies have detected the 7.7 and 11.3 m PAH bands in the diffuse ISM of the Milky Way, unassociated with regions of massive star formation and apparently excited by the local interstellar radiation field (Lemke et al., 1998). Other factors also likely play important roles in the production and destruction of PAH emission, including the local electron and gas densities (Ruiterkamp et al., 2002) and supernovae shocks (O’Halloran et al., 2006).

The extracted flux density in the 11.3 m PAH band in NGC 1705 D1 is found to be 2.4 0.8 mJy over a 0.745 m spectral region (see discussion in § 2). Given the low S/N ratio of the associated 7.7 m PAH feature in the IRS spectrum, its flux density can be estimated by assuming a uniform surface brightness over the same aperture size; from Figure 4, a peak value of 3.5 MJy sr-1 is representative. Scaled to the 10″ diameter circular aperture used for IRAC flux extraction, this corresponds to a flux density of 2.6 mJy. If the continuum intensity of 1 MJy sr-1 seen between 9 and 10 m is representative of the background under the 7.7 m feature, then this value will decrease to 1.8 mJy. These values can be compared with the residual emission in the IRAC 8 m band after continuum removal; the exemplary value of (IRAC 8 m) (0.232)(IRAC 3.5 m) used by Helou et al. (2004) yields a diffuse (stellar subtracted) 8 m flux density of 3.0 0.5 mJy (though note that a single scaling factor is likely not applicable to all galaxies). Depending on the underlying continuum levels, assumptions about the surface brightness distribution of the PAH emission, and the scaling factor used to remove the stellar continuum, it thus appears that most of the emission from region D1 in the IRAC 8 m band arises from PAH emission. This is also evident from inspection of Figure 4; the 7.7 m PAH complex is clearly detected in D1, but the spectrum of D2 is flat in this region.
These arguments imply that spatially variable PAH strengths compared to the underlying dust continuum make dissecting PAH and warm dust emission a complex issue. This is exemplified by region D2, which shows high surface brightness H, starlight-subtracted 8 m and dust emission but no detectable PAH features. Since the spectra of photodissociation regions (PDRs) and of H ii regions are quite different (e.g., Hollenbach & Tielens, 1997; Genzel & Cesarsky, 2000), the differences between D1 and D2 may have to do with how much of a PDR is left in one case vs the other. IRS spectra should be used to verify the presence and strength of PAH emission that may constitute an unknown fraction of the detected diffuse emission at 8 m.
While the spectra presented in Figure 4 are of relatively low S/N, they offer interesting comparisons of the physical conditions in the three regions probed. NGC 1705 D1 shows pronounced [S IV] 10.51 m emission, while this appears to be absent in D2 and the SSC. The [Ne II] 12.81 m line, which is blended with the 12.6 m PAH feature, appears in the spectra of both D1 and D2. The relative strengths of [S IV] and [Ne II] in D1 compared to D2 argue for a stronger radiation field in the former (see discussion in Thornley et al., 2000). The low S/N of the spectra precludes a detailed treatment of the ionization structure of the system. The spectrum of the SSC shows a broad peak around 10 m that may be suggestive of emission from amorphous silicates, either ultra small grains undergoing single-photon heating, or larger grains being heated to steady temperatures of 250 K (e.g., Draine & Li, 2001).
3.3. The Empirical PAH Transition Metallicity
Engelbracht et al. (2005) find a pronounced change in the strength of PAH emission as a function of metallicity in a sample of 34 star-forming galaxies. Above the level of 12+log(O/H) 8.2 ( 35% Z⊙), PAH emission is detected via diffuse 8 m emission and confirmed with IRS spectroscopy; at lower metallicities, PAH emission is weak or absent in their sample. NGC 1705 has a nebular metallicity equal to this transition point [12log(O/H) 8.21 0.05, measured at various locations throughout the central disk (including both D1 and D2); see Lee & Skillman 2004]; the variable PAH emission from different regions of the galaxy provides an interesting test case for this empirical relation.
Engelbracht et al. (2005) compare the 8/24 m ratio (R2) to the 4.5/8 m ratio (after the 4.5 m image has had an estimate of the underlying stellar continuum removed by scaling and subtracting the IRAC 3.5 m image; R1). The 8/24 m ratio clearly separates star forming galaxies according to both metallicity and the relative strengths of stellar and dust emission: metal-rich galaxies preferentially show high 8/24 m ratios and low ratios of stellar to dust emission at 8 m, while metal-poor galaxies show opposite trends. These color separations are interpreted to be caused, to first order, by the decreased emission strengths of PAH molecules in the low-metallicity ISM.
Computing the diagnostic color ratios as described in Engelbracht et al. (2005), we find (R1, R2) values of (0.05 0.005, 0.57 0.09), (0.14 0.009, 0.35 0.044), and (0.14 0.02, 0.42 0.06) for NGC 1705 D1, D2, and the total galaxy, respectively, using the values in Table 3. Note, however, that aperture corrections in the MIPS 24 m band can be significant for the 10″ diameter apertures used here (between 20–50%, depending on the extent of the source and the contamination from neighboring emission regions). Taken at face value, each of the R2 ratios is consistent with the average values found in the PAH-emitting galaxies of the Engelbracht et al. (2005) study (i.e., R 0.2). The R1 ratio of the PAH emission region, D1, falls exactly on the color boundary defined by Engelbracht et al. (2005); the two other regions show higher R1 ratios, consistent with values found for systems with PAH non-detections. If aperture corrections at 24 m are significant, the R2 ratio will decrease for regions D1 and D2 (but not for the global measurements), and the Engelbracht et al. (2005) diagnostic color ratios correctly separate the regions D1 and D2 into PAH-emitting and PAH-deficient, respectively.
3.4. Deviation from the Radio vs. Far-IR Correlation
In normal star-forming galaxies, there is a remarkably tight correlation between the total IR luminosity and the strength of radio continuum emission (see, e.g., de Jong et al. 1985, Helou et al. 1985, Condon 1992, and references therein). The tightness of the relation (scatter of less than 0.3 dex over multiple orders of magnitude) is especially remarkable, given that the physical processes that drive IR (re-radiation of absorbed photons by dust grains) and radio emission (typically nonthermal synchrotron emission, though a thermal free-free component can also contribute) are only indirectly associated with one another. Indeed, Bell (2003) shows that the relation holds for IR- and radio-deficient galaxies, but that these systems require a complex interplay of star formation, dust content and magnetic fields to produce the apparently linear relation in this regime.
We explore the relation between the global radio and IR luminosities of NGC 1705. The total IR (TIR) flux (derived by applying equation 4 from Dale & Helou 2002) and the radio continuum luminosity appear to be related via a constant value in star-forming galaxies [commonly denoted by the “q” parameter, where q log(STIR/SRC); see, e.g., Helou et al. 1985, Bell 2003]. Johnson et al. (2003) find a nondetection of NGC 1705 in the radio continuum at 6 cm, using data that are sufficiently sensitive to detect the Galactic W 49 star formation complex at the assumed distance of 5.1 Mpc (rms 0.05 mJy bm-1). Using the global flux densities of NGC 1705 in Table 3, we derive STIR 8 10-14 W m-2; assuming that “q” 2.64 (Bell, 2003) and that the radio emission is a mix of thermal and nonthermal processes (i.e., 0.7, where Sν ) for the extrapolation from 20 to 6 cm flux densities, this would imply an expected radio continuum flux density of 2 mJy. This is more than an order of magnitude higher than the Johnson et al. (2003) upper limit. Reducing the assumed value of “q” (e.g., q 2.34; Yun et al. 2001, though note that this value is derived using only information on the SED between 42–122 m) will increase the expected flux density by roughly 50%; assuming a stronger nonthermal component in the extrapolation from 1.4 to 4.8 GHz (e.g., 1.2, indicative of pure synchrotron emission) reduces the expected value by 50%. Applying a monochromatic “q” parameter (e.g., Murphy et al., 2006) yields similar estimates of the expected radio continuum flux density. Regardless of the extrapolation, it is clear that the radio continuum of NGC 1705 is extremely weak compared to the observed far-IR flux densities.
The detection, using these Spitzer data, of strong far-IR emission shows that there is significant dispersion amongst individual galaxies in the far-IR vs. radio correlation. Indeed, Bell (2003) suggests that this correlation is dependent on numerous factors and upon galaxy type, and that both the IR and radio luminosities of dwarf galaxies are suggested to significantly underestimate the true star formation rate. It is important to note, by comparison with the internal scatter in individual galaxies seen in the larger sample of Murphy et al. (2006), that the tightness of the global radio-IR correlation may depend on averaging over a significantly large number of emission regions. In dwarf galaxies, and starbursting dwarf galaxies in particular, the IR and radio emission are typically dominated by one (or at most a few) luminous star formation regions, allowing significant deviations from the relations seen in more massive galaxies. In larger starburst galaxies, a deficiency of radio continuum emission compared to the far-IR luminosity has been attributed to a very young ( few Myr), “nascent” starburst that has occured after an extended period ( 100 Myr) of quiescence (e.g., Roussel et al., 2003).
In the case of NGC 1705, which is IR-bright but radio-faint, the aforementioned galactic wind may play an important role in the lack of radio continuum emission. The young age of the SSC ( 12 Myr; Vázquez et al., 2004) implies that thermal emission associated with the UV photons of massive stars should still be strong (see timescale arguments in Condon 1992 and Cannon & Skillman 2004). Similarly, the “post-starburst” nature of the system (Heckman & Leitherer, 1997) and spatially resolved stellar photometry (Tosi et al., 2001; Annibali et al., 2003) have shown that most of the O stars associated with the strong burst of star formation have exploded as SNe, implying a strong synchrotron emission component. If the burst has “blown out” of the disk and is venting hot gas into the halo (as evidenced by UV absorption line spectroscopy and diffuse H and x-ray gas in the halo; see Hensler et al., 1998; Heckman et al., 2001; Veilleux et al., 2003), the energetic particles that give rise to radio continuum emission are likely escaping the disk (see also the discussion in Johnson et al., 2003).
4. Conclusions
We have presented observations of the nearby dwarf starburst galaxy NGC 1705 made with all three instruments on board the Spitzer Space Telescope. This is one of the few local dwarf galaxies known to host a SSC, and the only such system in the SINGS sample. The galaxy underwent a strong starburst some 15 Myr ago that produced the SSC and massive star formation in the field; this starburst is driving a multiphase outflow from the SSC region and this has dramatic consequences for the multiwavelength properties of the galaxy.
The galaxy morphology changes significantly longward and shortward of 5 m. Optical and short-wavelength IRAC imaging shows an underlying red stellar population, with the SSC dominating the luminosity. Longer-wavelength IRAC and MIPS imaging reveals warm dust emission arising from two off-nuclear regions that dominate the far-IR morphology of the system. Stellar and warm dust emission from the SSC is still prominent at 8 m, but the SED appears to flatten out toward longer wavelengths, suggesting that most of the warm dust emission arises from the off-nuclear regions. There is high surface brightness H emission associated with these dust emission peaks. The energy source for this off-nuclear nebular and dust emission, some 250 pc from the SSC, is likely young massive stars in these regions; some of these stars may be embedded, thus not contributing to the observed H luminosity. The lack of extinction toward the SSC (Heckman & Leitherer, 1997) and the modest warm dust emission of the SSC in the MIPS bands suggests that dust near the SSC may have been removed by the multi-phase outflow or evacuated by the high UV flux from the SSC.
We derive a total dust mass of (2.2 1.1) 105 M⊙. This value represents the mean of the dust mass estimates from using the SED models of Dale et al. (2001) and Dale & Helou (2002) and the models of Li & Draine (2001, 2002). A single-temperature blackbody function is unable to simultaneously fit the observed 24, 70 and 160 m flux densities. Both sets of SED models predict a higher dust mass than a single-temperature blackbody fit to the 70 and 160 m data points. Comparing to the H i mass implies a global dust-to-gas ratio 2–4 lower than the Galactic average.
The strong diffuse emission in the IRAC 8 m band is dominated by warm dust emission; IRS spectroscopy of the SSC and both off-nuclear sources shows 11.3 m PAH emission in the more luminous of the two dust emission peaks only (no PAH emission is associated with the SSC). This serves as a prudent reminder that IRAC diffuse 8 m emission traces both dust continuum and PAH emission, and that spectroscopy is essential for a robust separation of the two components. The fact that variable PAH emission strengths are seen in a galaxy with nebular metallicity equal to the empirical PAH threshold found by Engelbracht et al. (2005) highlights the complexity in interpreting the nature of diffuse 8 m emission.
Finally, we note that NGC 1705 appears to deviate significantly from the canonical far-IR vs. radio correlation, in the sense that strong far-IR emission is present, but radio continuum emission remains undetected at meaningful sensitivity levels. The galactic outflow may play an important role in affecting the radio continuum emission; if significant numbers of energetic particles are escaping into the halo, the radio continuum emission will be significantly suppressed compared to the total IR luminosity. Dwarf starburst galaxies, typically dominated by one massive star formation region, appear to be susceptible to strong variations in this ratio; the tightness of the radio-IR correlation may rely on a larger statistical sampling of star formation regions throughout an individual galaxy.
References
- Annibali et al. (2003) Annibali, F., Greggio, L., Tosi, M., Aloisi, A., & Leitherer, C. 2003, AJ, 126, 2752
- Asplund et al. (2004) Asplund, M., Grevesse, N., Sauval, A. J., Allende Prieto, C., & Kiselman, D. 2004, A&A, 417, 751
- Bell (2003) Bell, E. F. 2003, ApJ, 586, 794
- Bot et al. (2004) Bot, C., Boulanger, F., Lagache, G., Cambrésy, L., & Egret, D. 2004, A&A, 423, 567
- Calzetti et al. (2005) Calzetti, D., et al. 2005, ApJ, 633, 871
- Cannon & Skillman (2004) Cannon, J. M., & Skillman, E. D. 2004, ApJ, 610, 772
- Cannon et al. (2005) Cannon, J. M., et al. 2005, ApJ, 630, L37
- Condon (1992) Condon, J. J. 1992, ARA&A, 30, 575
- Dale et al. (2001) Dale, D. A., Helou, G., Contursi, A., Silbermann, N. A., & Kolhatkar, S. 2001, ApJ, 549, 215
- Dale & Helou (2002) Dale, D. A., & Helou, G. 2002, ApJ, 576, 159
- Dale et al. (2005) Dale, D. A., et al. 2005, ApJ, 633, 857
- de Jong et al. (1985) de Jong, T., Klein, U., Wielebinski, R., & Wunderlich, E. 1985, A&A, 147, L6
- Draine & Li (2001) Draine, B. T., & Li, A. 2001, ApJ, 551, 807
- Dufour (1984) Dufour, R. J. 1984, IAU Symp. 108: Structure and Evolution of the Magellanic Clouds, 108, 353
- Engelbracht et al. (2005) Engelbracht, C. W., Gordon, K. D., Rieke, G. H., Werner, M. W., Dale, D. A., & Latter, W. B. 2005, ApJ, 628, L29
- Genzel & Cesarsky (2000) Genzel, R., & Cesarsky, C. J. 2000, ARA&A, 38, 761
- Gil de Paz et al. (2003) Gil de Paz, A., Madore, B. F., & Pevunova, O. 2003, ApJS, 147, 29
- Gordon et al. (2005) Gordon, K.D., et al. 2005, PASP, 177, 503
- Haas et al. (1998) Haas, M., Lemke, D., Stickel, M., Hippelein, H., Kunkel, M., Herbstmeier, U., & Mattila, K. 1998, A&A, 338, L33
- Heckman et al. (1990) Heckman, T. M., Armus, L., & Miley, G. K. 1990, ApJS, 74, 833
- Heckman & Leitherer (1997) Heckman, T. M., & Leitherer, C. 1997, AJ, 114, 69
- Heckman et al. (2001) Heckman, T. M., Sembach, K. R., Meurer, G. R., Strickland, D. K., Martin, C. L., Calzetti, D., & Leitherer, C. 2001, ApJ, 554, 1021
- Helou et al. (1985) Helou, G., Soifer, B. T., & Rowan-Robinson, M. 1985, ApJ, 298, L7
- Helou et al. (2000) Helou, G., Lu, N. Y., Werner, M. W., Malhotra, S., & Silbermann, N. 2000, ApJ, 532, L21
- Helou et al. (2004) Helou, G., et al. 2004, ApJS, 154, 253
- Hensler et al. (1998) Hensler, G., Dickow, R., Junkes, N., & Gallagher, J. S. 1998, ApJ, 502, L17
- Hippelein et al. (2003) Hippelein, H., Haas, M., Tuffs, R. J., Lemke, D., Stickel, M., Klaas, U., Völk, H. J. 2003, A&A, 407, 137
- Ho & Filippenko (1996) Ho, L. C., & Filippenko, A. V. 1996, ApJ, 472, 600
- Hollenbach & Tielens (1997) Hollenbach, D. J., & Tielens, A. G. G. M. 1997, ARA&A, 35, 179
- Houck et al. (2004) Houck, J. R., et al. 2004, ApJS, 154, 211
- Hunt et al. (2004) Hunt, L. K., Dyer, K. K., Thuan, T. X., & Ulvestad, J. S. 2004, ApJ, 606, 853
- Johnson et al. (2003) Johnson, K. E., Indebetouw, R., & Pisano, D. J. 2003, AJ, 126, 101
- Kennicutt et al. (2003) Kennicutt, R. C., et al. 2003, PASP, 115, 928
- Lee & Skillman (2004) Lee, H., & Skillman, E. D. 2004, ApJ, 614, 698
- Lemke et al. (1998) Lemke, D., Mattila, K., Lehtinen, K., Laureijs, R. J., Liljestrom, T., Leger, A., & Herbstmeier, U. 1998, A&A, 331, 742
- Li (2005) Li, A. 2005, in Penetrating Bars Through Masks of Cosmic Dust, ed. D. L. Block, I. Puerani, K. C. Freeman, R. Groess, & E. K. Block (Dordrecht: Springer), 535
- Li & Draine (2001) Li, A., & Draine, B. T. 2001, ApJ, 554, 778
- Li & Draine (2002) Li, A., & Draine, B. T. 2002, ApJ, 576, 762
- Lu et al. (2003) Lu, N., et al. 2003, ApJ, 588, 199
- Madden (2005) Madden, S. C. 2005, AIP Conf. Proc. 761: The Spectral Energy Distributions of Gas-Rich Galaxies: Confronting Models with Data, 761, 223
- Martin et al. (2002) Martin, C. L., Kobulnicky, H. A., & Heckman, T. M. 2002, ApJ, 574, 663
- Meurer et al. (1995) Meurer, G. R., Heckman, T. M., Leitherer, C., Kinney, A., Robert, C., & Garnett, D. R. 1995, AJ, 110, 2665
- Meurer et al. (1998) Meurer, G. R., Staveley-Smith, L., & Killeen, N. E. B. 1998, MNRAS, 300, 705
- Murphy et al. (2006) Murphy, E. J., et al. 2006, ApJ, in press (astro-ph/0510227)
- O’Connell (2004) O’Connell, R. W. 2004, ASP Conf. Ser. 322: The Formation and Evolution of Massive Young Star Clusters, 322, 551
- O’Halloran et al. (2006) O’Halloran, B., Satyapal, S., & Dudik, R. P. 2006, ApJ, in press (astro-ph/0512404)
- Ott et al. (2003) Ott, J., Martin, C. L., & Walter, F. 2003, ApJ, 594, 776
- Pahre et al. (2004) Pahre, M. A., Ashby, M. L. N., Fazio, G. G., & Willner, S. P. 2004, ApJS, 154, 229
- Popescu et al. (2002) Popescu, C. C., Tuffs, R. J., Völk, H. J., Pierini, D., & Madore, B. F. 2002, ApJ, 567, 221
- Regan et al. (2004) Regan, M. W., et al. 2004, ApJS, 154, 204
- Roussel et al. (2003) Roussel, H., Helou, G., Beck, R., Condon, J. J., Bosma, A., Matthews, K., & Jarrett, T. H. 2003, ApJ, 593, 733
- Ruiterkamp et al. (2002) Ruiterkamp, R., Halasinski, T., Salama, F., Foing, B. H., Allamandola, L. J., Schmidt, W., & Ehrenfreund, P. 2002, A&A, 390, 1153
- Smith et al. (2004) Smith, J. D. T., et al. 2004, ApJS, 154, 199
- Smith & Gallagher (2001) Smith, L. J., & Gallagher, J. S. 2001, MNRAS, 326, 1027
- Sodroski et al. (1997) Sodroski, T. J., Odegard, N., Arendt, R. G., Dwek, E., Weiland, J. L., Hauser, M. G., & Kelsall, T. 1997, ApJ, 480, 173
- Stanimirovic et al. (2000) Stanimirovic, S., Staveley-Smith, L., van der Hulst, J. M., Bontekoe, T. R., Kester, D. J. M., & Jones, P. A. 2000, MNRAS, 315, 791
- Stanimirovic et al. (2005) Stanimirovic, S., et al. 2005, American Astronomical Society Meeting Abstracts, 206, 12.12
- Thornley et al. (2000) Thornley, M. D., Schreiber, N. M. F., Lutz, D., Genzel, R., Spoon, H. W. W., Kunze, D., & Sternberg, A. 2000, ApJ, 539, 641
- Tosi et al. (2001) Tosi, M., Sabbi, E., Bellazzini, M., Aloisi, A., Greggio, L., Leitherer, C., & Montegriffo, P. 2001, AJ, 122, 1271
- Vázquez et al. (2004) Vázquez, G. A., Leitherer, C., Heckman, T. M., Lennon, D. J., de Mello, D. F., Meurer, G. R., & Martin, C. L. 2004, ApJ, 600, 162
- Veilleux et al. (2003) Veilleux, S., Shopbell, P. L., Rupke, D. S., Bland-Hawthorn, J., & Cecil, G. 2003, AJ, 126, 2185
- Wang et al. (2004) Wang, Z., et al. 2004, ApJS, 154, 193
- Weingartner & Draine (2001) Weingartner, J. C., & Draine, B. T. 2001, ApJ, 548, 296
- Whitmore & Schweizer (1995) Whitmore, B. C., & Schweizer, F. 1995, AJ, 109, 960
- Whitmore (2004) Whitmore, B. C. 2004, ASP Conf. Ser. 322: The Formation and Evolution of Massive Young Star Clusters, 322, 419
- Yun et al. (2001) Yun, M. S., Reddy, N. A., & Condon, J. J. 2001, ApJ, 554, 803