Spatially Resolved Spitzer Spectroscopy of the Starburst Nucleus in NGC 5253
Abstract
We present new Spitzer Space Telescope data on the nearby, low-metallicity starburst galaxy NGC 5253, from the Infrared Array Camera IRAC and the Infrared Spectrograph IRS111The IRS was a collaborative venture between Cornell University and Ball Aerospace Corporation funded by NASA through the Jet Propulsion Laboratory and the Ames Research Center.. The mid-IR luminosity profile of NGC 5253 is clearly dominated by an unresolved cluster near the center, which outshines the rest of the galaxy at longer wavelengths. We find that the [Ne III]/[Ne II] ratio decreases from at the center to at a distance of pc. The [S IV]/[S III] follows the [Ne III]/[Ne II] ratio remarkably well, being about times lower at all distances. Our spectra reveal for the first time PAH emission feature at 11.3m and its equivalent width increases significantly with distance from the center. The good anti-correlation between the PAH strength and the product between hardness and luminosity of the UV radiation field suggests photo-destruction of the PAH molecules in the central region. The high-excitation [OIV]25.91m line was detected at W cm-2. Our results demonstrate the importance of spatially resolved mid-IR spectroscopy.
Subject headings:
ISM: lines and bands - Galaxies: individual (NGC 5253) - Galaxies: ISM - Galaxies: starburst - Infrared: galaxies1. Introduction
NGC 5253 is a nearby, low-metallicity dwarf galaxy with a recent starburst, which is responsible for its infrared luminosity of (Beck et al., 1996). Distance estimates vary from Mpc (Gibson et al., 2000) to Mpc (Thim et al., 2003); here we will assume 4.0 Mpc, corresponding to 19.4 pc/. With its low metallicity of only about (Kobulnicky et al., 1999) NGC 5253 is an excellent target to study starbursts in a low-metallicity environment. The spectral signatures of Wolf-Rayet (WR) stars suggest a very recent starburst (Beck et al. (1996); Schaerer et al. (1997)). Cresci et al. (2005) detected 115 star clusters using optical and near-infrared VLT images at an age range of 3-19 Myr. Turner et al. (1998) found a compact radio source representing a hidden super star cluster (SSC) in one of the earliest phases of SSC formation ever observed. Its ionizing flux corresponds to several thousand O7 V star equivalents within the central (Crowther et al., 1999; Turner & Beck, 2004) and an infrared luminosity of (Crowther et al., 1999). Near-infrared observations with Hubble Space Telescope revealed the presence of a double star cluster in the nuclear region, separated by pc (Alonso-Herrero et al., 2004). There are indications that an interaction with M81 might have provoked the starburst (Kobulnicky et al., 1995).
NGC 5253 has also been studied in the mid-IR with the Infrared Space Observatory (ISO) by several authors, e.g., Crowther et al. (1999), Thornley et al. (2000) and Verma et al. (2003). With Spitzer’s increased sensitivity (Werner et al., 2004) and the smaller slit apertures, the IRS can continue where ISO left off. In this letter we report on the spatial variations of the physical conditions in the central region of NGC 5253, based on IRAC images and IRS (Houck et al., 2004a) spectral maps.
2. Observations and Data Reduction
The images were obtained on 2005 January 31 using IRAC (Fazio et al., 2004) at all four bands (m). The observations consist of 12 slightly dithered pointings of s exposures each. The data were pipeline processed by the Spitzer Science Center. Longward of m the IRAC images show only one compact cluster and no structure of the host galaxy. To assess what fraction of the total luminosity of the central region is provided by the central cluster we compare the flux within the central 44 pc (2 pixel) to the total flux within a radius of 330 pc for each channel. The results in Table 1 show the increasing dominance of the starburst nucleus in luminosity with wavelength. We subtracted the IRAC instrumental PSFs from the nucleus for all four channels, and the residuals suggest that the central cluster remains unresolved in the IRAC images, which is consistent with its very compact size (Turner & Beck, 2004).
| central flux | total flux | ||
|---|---|---|---|
| (m) | (MJy/sr) | (MJy/sr) | |
| 3.6 | 261612 | 657886 | 0.39 |
| 4.5 | 506916 | 784697 | 0.65 |
| 5.8 | 1164029 | 17187261 | 0.68 |
| 8.0 | 2686933 | 3784699 | 0.71 |
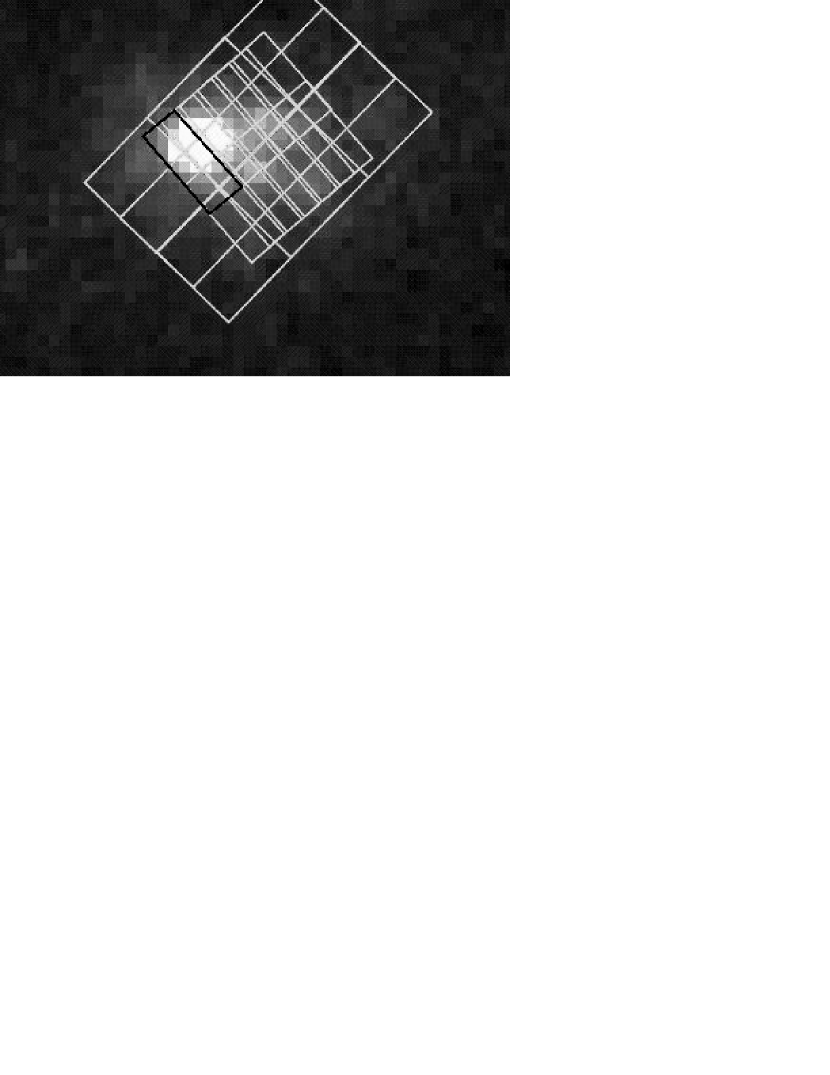
The mid-IR spectra were obtained on 2004 July 14, using high resolution modules () of the Infrared Spectrograph (IRS) in spectral mapping mode. In the SH (short-high) mode, the map consists of 12 different pointings, overlapping by half a slit width and about one third slit length, covering an area of . In LH (long-high) mode the map consists of only 6 different pointings, covering an area of . Fig. 1 shows the SH and LH slit positions overlaid on the IRAC image of the central region. Both maps are slightly off-center. Additional “sky” measurements, 6 arcmin from the nucleus were also taken. The basic processing of the data was performed with version 11.0 of the automated IRS pipeline at the Spitzer Science Center. The background was subtracted using the sky images. The spectra were extracted in ”full-slit” mode from pre-flat-fielded files using the IRS data reduction and analysis package SMART, version 5.5 (Higdon et al., 2004). The extracted spectra were flux calibrated with an empirically derived RSRF (relative spectral response function) of Lac. The spectral overlaps between orders were manually clipped, according to the local S/N. Finally, the SH spectra were scaled up by 16% to match the LH continuum fluxes at 19 m. This discrepancy in the fluxes is due to the difference between the SH and LH slit sizes.
3. Discussion
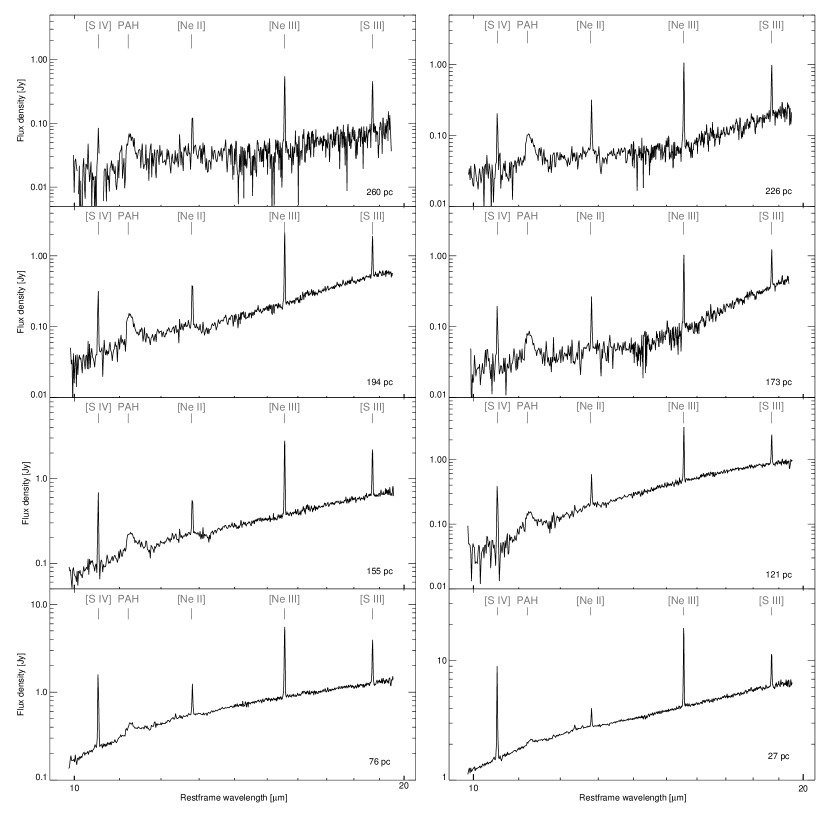
The complete m SH+LH spectrum at the most central position of our map is shown in Fig. 2. With a smooth continuum with no significant absorption features, and turnover in the slope around m, it is dominated by the strong emission lines of [SIV]m, [NeII]m, [NeIII]m, [SIII]m, [SIII]m and [SiII]m. Also detected are the signature of polycyclic aromatic hydrocarbons (PAH) at m and Hu at m up to a distance of pc. Fig. 3 shows eight representative SH spectra at decreasing radial distances, calculated from the central cluster to the center of each slit position. The remaining four spectra of our map are redundant and not shown to save space. The most prominent spectral features are labeled. The line fluxes for each radial position are listed in Table 2.

3.1. Gradients in the Radiation Field
With ionization potentials of 21.56 eV and 40.95 eV for Ne and Ne+, respectively, the [Ne III]/[Ne II] ratio is a good measure of the hardness of the radiation field, and traces the OB stars. Crowther et al. (1999) measured a relatively low [Ne III]/[Ne II] ratio of . However, the larger ISO-SWS slit apertures of and , centered on the nucleus, may have also picked up significant line flux at lower excitation from the surrounding galactic population. With the smaller IRS slit aperture of we can probe the influence of spatial resolution on the measured spectral diagnostics. The upper plot of Fig. 4 shows the [Ne III]/[Ne II] and [S IV]/[S III] ratios as functions of the distance to the central cluster. Both ratios decrease by a factor of four over 250 parsecs, indicating a significant softening of the UV radiation field with distance from the cluster core, and trace each other remarkably well, with the Ne ratio being about times higher at all distances. Our high [Ne III]/[Ne II] ratio at the central cluster is comparable to those observed in nearby H II regions like 30 Doradus and low-metallicity dwarf galaxies like II Zw 40 (Thornley et al., 2000). Rigby et al. (2004) modeled Ne line ratios for star clusters at low metallicity and showed that a peak ratio of 7.0 is consistent with an upper mass cutoff of , at an age of Myr.
3.2. Dependence of PAH Strength on the Radiation Field
It has often been asked if PAHs in low-metallicity starbursts appear to be weaker because of low abundance or because they get destroyed by the generally harder radiation fields in these environments (e.g., Wu et al. (2005); Engelbracht et al. (2005); O’Halloran et al. (2005); Houck et al. (2004b); Madden (2000)). Our high S/N spectra clearly reveal, for the first time, the presence of the m PAH feature in all SH positions on NGC 5253, which shows that PAHs can be present in a low metallicity environment. The center plot of Fig. 4 shows a steady increase of the PAH equivalent width (EW) with distance. We assume constant metallicity throughout the galaxy, as no known dwarf has steep metallicity gradients (Kobulnicky et al., 1999). In Fig. 4 we have investigated the correlation between the measured PAH strength and the “strength” of the UV radiation field, defined by the product of the hardness and the intensity of the radiation field, [Ne III]/[Ne II]([Ne III]+[Ne II]). The bottom plot shows the product between the UV field and the PAH strengths as a function of distance. This product stays almost constant out to a radial distance of 200 pc, meaning that the strength of the UV field and the strength of the PAH emission is strongly anti-correlated. The good anti-correlation over such a large distance (encompassing numerous H II regions) suggests that the photo-destruction of PAHs could be the dominant mechanism here. We note that PAH emission models (Li & Draine, 2001; Bakes et al., 2001) show that photoionization of hydrogen in PAHs can also cause a decrease in the relative PAH strength above m. However, we consider this effect unlikely since no ionization effect has been seen in other starburst galaxies (Brandl et al., 2006). For comparison, a low metallicity system like SBS 0335-052, where no PAHs have been detected, has a Ne ratio of 4.9 (Houck et al., 2004b) and some of the low metallicity systems with weak PAHs studied by O’Halloran et al. (2005) have a Ne ratio of . As seen in Fig. 4, these ratios correspond to a radial distance inside the PAH destruction zone in NGC 5253.
3.3. [O IV] Line Emission
With an excitation potential of 54.9 eV, the [O IV]25.89m line fills the wide energetic gap of mid-IR fine-structure lines between lines that can originate from massive stars and lines that likely require an AGN. It has been attributed to various mechanisms, including very hot stars (Schaerer & Stasinska, 1999; Morris et al., 2004) and energetic shocks for low-excitation starbursts (Lutz et al., 1998). Our high S/N spectra reveal a faint [O IV] line at two slit positions outside the central cluster, with fluxes of about W cm-2 at a S/N of 7.1. This is higher than the limits given by Crowther et al. (1999) (W), but below the upper limit of Verma et al. (2003) (W cm-2), and in reasonable agreement with the flux measured by Lutz et al. (1998) (W cm-2). Using the STARBURST99 code (Leitherer et al. 1999) assuming an instantaneous burst of star formation with a Salpeter (Salpeter, 1955) IMF at 1/5 solar metallicity, the observed OIV emission can be produced by roughly 125 WR stars (WC+WN), consistent with the wide range of O7 V star equivalents (Crowther et al., 1999; Turner & Beck, 2004) within the central . A detailed discussion is given in Martin-Hernandez et al. (2005). However, as the [OIV] emission is only observed in two LH slit positions off the nucleus, it is not obvious that the [OIV] line is predominantly photo-excited by the central WR stars. Other excitation mechanisms, such as shocks, need to be considered.

| distance | [SIV] | Hu | [NeII] | [NeIII] | [SIII] | [NeIII]/[NeII] | [SIV]/[SIII] |
|---|---|---|---|---|---|---|---|
| (pc) | |||||||
| m | m | m | m | m | |||
| EP=34.8 eV | EP=21.6 eV | EP=41.0 eV | EP=23.3 eV | ||||
| 27 | 37.50 0.21 | 2.11 0.53 | 5.63 0.14 | 47.40 1.21 | 16.79 0.58 | 8.41 | 2.23 |
| 30 | 33.22 0.84 | 1.57 0.28 | 5.90 0.16 | 40.87 1.90 | 17.24 0.52 | 6.93 | 1.93 |
| 76 | 8.80 0.21 | 0.43 0.02 | 3.51 0.08 | 16.94 0.50 | 7.91 0.24 | 4.83 | 1.11 |
| 121 | 2.25 0.32 | 0.32 0.10 | 2.02 0.09 | 8.41 0.31 | 4.54 0.16 | 4.17 | 0.50 |
| 135 | 7.01 0.45 | 2.62 0.17 | 12.18 0.33 | 6.30 0.18 | 4.65 | 1.11 | |
| 149 | 6.03 0.51 | 2.75 0.13 | 11.06 0.25 | 6.00 0.12 | 4.02 | 1.01 | |
| 155 | 3.37 0.24 | 2.58 0.23 | 8.74 0.14 | 4.98 0.09 | 3.39 | 0.68 | |
| 173 | 1.01 0.08 | 1.09 0.02 | 3.16 0.11 | 2.38 0.08 | 2.91 | 0.43 | |
| 194 | 1.77 0.04 | 2.17 0.14 | 6.27 0.09 | 4.03 0.09 | 2.89 | 0.44 | |
| 219 | 0.71 0.01 | 0.60 0.04 | 1.55 0.06 | 1.10 0.07 | 2.60 | 0.64 | |
| 226 | 1.18 0.18 | 1.36 0.08 | 3.28 0.11 | 2.35 0.09 | 2.42 | 0.50 | |
| 260 | 0.68 0.12 | 1.76 0.07 | 1.12 0.05 | 2.59 |
References
- Alonso-Herrero et al. (2004) Alonso-Herrero, A., Takagi, T., Baker, A. J., Rieke, G. H., Rieke, M., Imanishi, M., & Scoville, N. 2004, ApJ, 612, 222
- Bakes et al. (2001) Bakes, E. L. O., Tielens, A. G. G. M. & Bauschlicher, Jr., C. W. 2001, ApJ, 556, 501
- Beck et al. (1996) Beck, S.C., Turner, J. L., Ho, P. T. P., Lacy, J. H., & Kelly, D. M. 1996, ApJ, 457, 610
- Brandl et al. (2006) Brandl, B. R., et al., submitted
- Cresci et al. (2005) Cresci, G., Vanzi, L., & Sauvage, M. 2005, A&A, 433, 447
- Crowther et al. (1999) Crowther, P.A., Beck, S. C., Willis, A. J., Conti, P. S., Morris, P. W., & Sutherland, R. S. 1999, MNRAS, 304, 654
- Engelbracht et al. (2005) Engelbracht, C.W., Gordon, K. D., Rieke G. H., Werner, M. W., Dale, D. A., & Latter W. B. 2005, ApJL, 628, L29
- Fazio et al. (2004) Fazio, G. G. et al. 2004, ApJS, 154, 10
- Gibson et al. (2000) Gibson, B. K., et al. 2000, ApJ, 529, 723
- Higdon et al. (2004) Higdon, S. J. U., et al. 2004, PASP, 116, 975
- Houck et al. (2004b) Houck, J. R., et al. 2004, ApJS, 154, 211
- Houck et al. (2004a) Houck, J. R., et al. 2004, ApJS, 154, 18
- Kobulnicky et al. (1999) Kobulnicky, H. A. 1999, in IAU Symp. 193, Wolf-Rayet Phenomena in Massive Stars and Starburst Galaxies, ed. K. van der Hucht, G. Koenigsberger, & P. Eenens (San Francisco: ASP), 670
- Kobulnicky et al. (1999) Kobulnicky, H. A., Kennicutt, R. C., Jr., & Pizagno, J. L. 1999, ApJ, 514, 544
- Kobulnicky et al. (1995) Kobulnicky, H. A., & Skillman, E. D. 1995, ApJ 454, L121
- Li & Draine (2001) Li, A. & Draine, B. T. 2001, ApJ, 554, 778
- Lutz et al. (1998) Lutz, D., Kunze, D., Spoon, H. W. W., & Thornley, M. D. 1998, A&A, 333, L75
- Madden (2000) Madden, S. C. 2000, New A Rev, 44, 249
- Martin-Hernandez et al. (2005) Martin-Hernandez, N. L., Schaerer, D., & Sauvage, M. 2005, A&A, 429, 449
- Morris et al. (2004) Morris, P.W., Crowther, P. A., & Houck, J. R. 2004, ApJS, 154, 413
- O’Halloran et al. (2005) O’Halloran, B., Satyapal, S., & Dudlik, R. P. 2005, ApJ, accepted
- Rigby et al. (2004) Rigby, J. R., & Rieke, G. H. 2004, ApJ, 606, 237
- Salpeter (1955) Salpeter, E.E. 1955, ApJ, 121, 161
- Schaerer et al. (1997) Schaerer, D. & de Koter, A. 1997, A&A, 322, 598
- Schaerer & Stasinska (1999) Schaerer, D. & Stasinska, G. 1999, A&A, 345, L17
- Summers et al. (2004) Summers, L. K., Stevens, I. R., Strickland, D. K., & Heckman, T. M. 2004, MNRAS, 351, 1
- Thim et al. (2003) Thim, F., Tammann, G. A., Saha, A., Dolphin, A., Sandage, A., Tolstoy, E., & Labhardt, L. 2003, ApJ, 590, 256
- Thornley et al. (2000) Thornley, M. D., Schreiber, N. M. F., Lutz, D., Genzel, R., Spoon, H. W. W., Kunze, D., & Sternberg, A. 2000, ApJ, 539, 641
- Turner et al. (1998) Turner, J. L., Ho, P. T. P., & Beck, S. C. 1998, AJ, 116, 121
- Turner & Beck (2004) Turner, J. L. & Beck, S. C. 2004, ApJL, 602, L85
- Verma et al. (2003) Verma, A., Lutz, D., Sturm, E., Sternberg, A., Genzel, R., & Vacca, W. 2003, A&A, 403, 829
- Wu et al. (2005) Wu, Y., Charmandaris, V., Hao, L., Brandl, B. R., Bernard-Salas, J., Spoon, H. W. W., & Houck, J. R. 2005, in press (astro-ph/0510856)
- Werner et al. (2004) Werner, M., et al. 2004, ApJS, 154, 1