11email: wkollat@astro.physik.uni-goettingen.de
2 Department of Astronomy, The Ohio State University, 4055 McPherson Lab, 140 W. 18th Ave., Columbus, OH 43210, USA
Spectral line variability amplitudes in AGNs ††thanks: Based on observations taken at the German-Spanish Astronomical Center Calar Alto ††thanks: Based on observations obtained with the Hobby-Eberly Telescope, which is a joint project of the University of Texas at Austin, Pennsylvania State University, Stanford University, Ludwig-Maximilians-Universität München, and Georg-August-Universität Göttingen.
We present the results of a long-term variability campaign of very broad-line AGNs with line widths broader than FWHM 5000 kms-1. The main goal of our investigation was to study whether the widths of the optical broad emission lines are correlated with the optical intensity variations on timescales of years. Our AGN sample consisted of 10 objects. We detected a significant correlation between optical continuum variability amplitudes and H emission line widths (FWHM) and, to a lesser degree, between H line intensity variations and H equivalent widths. We add the spectroscopic data of variable AGNs from the literature to supplement our sample. The AGNs from other optical variability campaigns with different line-widths helped to improve the statistical significance of our very broad-line AGN sample. After including the data on 35 additional galaxies, the correlation between optical continuum variability amplitudes and H emission line widths becomes even more significant and the probability that this is a random correlation drops to 0.7 percent.
Key Words.:
galaxies: quasars: emission lines – galaxies: nuclei – galaxies: Seyfert – line: profiles –1 Introduction
Seyfert 1 galaxies and quasars vary on timescales of days to years in the optical (e.g. Peterson et al. peterson04 (2004), Kaspi et al.kaspi00 (2000)). The variablity amplitudes of their continuum fluxes range from a few percent to more than a hundred percent (e.g. de Vries et al. devries05 (2005)). Variations in the continuum from the radio to the gamma-ray range have different timescales (e.g. Peterson et al. peterson00 (2000)), which is a situation that has to be taken into account in variability studies. This makes it necessary to examine only the individual frequency ranges. Even though considerable effort has been made over the last years, several details of the physical processes leading to variability are still unknown (Peterson peterson01 (2001), Blandford blandford04 (2004), Horne et al. horne04 (2004) and references therein).
In an earlier extensive investigation, Giveon et al. (giveon99 (1999)) studied a sample of PG quasars with line widths in the range of full width at half maximum (FWHM) to 5000 km s-1. They searched for correlations between the measured variability properties and other parameters of the studied quasars. However, they did not look explicitly for correlations between the emission line width and other intrinsic parameters.
In this paper we focus on optical continuum variations and emission-line intensity variations in AGNs over timescales of years, which is comparable to the expected dynamical time scale of the broad-line region (BLR). Observed variations in the emission lines in the spectra of AGNs are caused by variations in the central ionizing source. In this paper we investigate whether there are correlations between the variability amplitudes in the continuum and properties of the spectral lines to gather information about the structure of the BLR.
Nearly nothing is known about the optical variability behavior of very broad-line AGNs because most studies have so far been concentrated on AGNs with FWHM to 5000 km s-1. However, one of the most variable Seyfert galaxies known so far is NGC 7603. This galaxy with emission-line widths of FWHM 6500 km s-1 varied by a factor of 5 to 10 in the optical continuum and in the Balmer lines over a period of 20 years (Kollatschny et al. kollatschny00 (2000)). Hence, we selected Seyfert galaxies with emission-line widths of more than 5000 km s-1. We investigate the variability behavior of a sample of ten Seyfert galaxies. In addition, we compare our results with results from earlier campaigns investigating AGNs with narrower emission-line widths ( to 5000 km s-1).
2 Observations
2.1 The spectroscopic variability sample
The broad emission lines in AGNs have typical line widths of more than 2000 kms-1 (Hao et al. hao05 (2005)). The so-called narrow-line Seyfert 1 galaxies (FWHM 2000 km s-1, e.g. Osterbrock, D., & Pogge, osterbrock85 (1985)) have been the subject of many papers in previous years (e.g. Williams et al. Williams02 (2002), Romano et al. Romano04 (2004)). On the other hand, 15 to 20 percent of all AGNs have line widths that are broader than 5000 kms-1, as seen in a line-width distribution of AGNs recently published by Hao et al. (hao05 (2005)), who analyzed the AGN spectra of the Sloan Digital Sky Survey.
Most of the variability studies of AGNs have so far been made for galaxies with line widths of less than 6000 kms-1. Nearly nothing is known about the long-term variability statistics of the spectral lines of very broad-line AGNs - except for 3C390.3 (e.g. Veilleux & Zheng veilleux91 (1991), Dietrich et al. dietrich98 (1998), O’Brien et al. OBrien98 (1998)).
We started a campaign of observing the long-term spectral variability of the very broad-line AGN class more than 10 years ago. We selected as many as possible bright ( 16), nearby northern AGNs of this very broad-line class from the literature (e.g. Osterbrock et al. osterbrock76 (1976), Apparao et al. apparao78 (1978), Smith smith80 (1980), Bond bond77 (1977)). Our main goal was to study the emission-line variability of very broad line AGNs with those telescopes in the 2 m to 4 m class that were available at this time. We had to include objects with higher redshifts (z0.05) because very broad-line AGNs are rare in the local universe. Our target AGNs include intrinsically luminous, as well as faint, AGNs.
Finally, a sample of ten AGNs was compiled, all having H emission-line widths of FWHM to 13 000 km s-1 (Table 1). For comparison we investigated two narrow-line Seyfert 1 galaxies with line-widths of less than 2000 kms-1) (Mrk 110, Ton 256).
The galaxies in our sample, their mean H line widths, their redshifts, as well as their apparent and absolute brightness (taken from the catalogue of Véron & Véron Veron01 (2001)) are given in Table 1. In addition, the [O iii]5007 line widths, the [OIII]/H line ratios derived from our spectra, the radio power, the references from which the radio data were selected, and the radio optical spectral indices are listed. The radio optical spectral index has been calculated by us using the formula
| (1) |
| Object | FWHM H | z | mv | MB | FWHM [OIII] | [OIII]/H | Ref. | ||
| [kms | [kms-1] | [W Hz-1] | |||||||
| (1) | (2) | (3) | (4) | (5) | (6) | (7) | (8) | (9) | (10) |
| 3C390.3 | 11530. | 0.056 | 15.4 | -21.6 | 799 | 0.57 | 24.659 | 0.43 | 1 |
| 4U0241+61 | 8720. | 0.044 | 12.2 | -25.0 | 814 | 0.32 | 28.607 | 0.91 | 2 |
| E1821+643 | 6230. | 0.297 | 14.2 | -27.1 | 854 | 0.29 | 24.755 | 0.04 | 3 |
| Mrk 876 | 7390. | 0.129 | 15.5 | -23.5 | 918 | 0.20 | 22.277 | -0.15 | 1 |
| Mrk 926 | 8510. | 0.047 | 13.8 | -23.1 | 766 | 0.78 | 20.754 | -0.40 | 1 |
| NGC 6814 | 7560. | 0.005 | 14.2 | -17.5 | 757 | 2.51 | 19.374 | -0.24 | 1 |
| OX 169 | 5010. | 0.211 | 15.7 | -24.7 | 1053 | 0.17 | 25.288 | 0.32 | 1 |
| PKS2349-14 | 5130. | 0.174 | 15.3 | -24.7 | 719 | 0.31 | 24.917 | 0.25 | 1 |
| NGC 7603 | 6560. | 0.0295 | 14.0 | -21.5 | 785 | 0.15 | 21.512 | -0.14 | 1 |
| V396HER | 12330. | 0.175 | 16.4 | -23.3 | 764 | 0.21 | 24.676 | 0.31 | 2 |
| Mrk 110 | 1670. | 0.0355 | 15.4 | -20.6 | 596 | 0.54 | 21.242 | -0.13 | 1 |
| Ton256 | 1460. | 0.131 | 15.4 | -23.5 | 635 | 1.25 | 22.514 | -0.11 | 1 |
2.2 Observations and data reduction
We took optical spectra of our galaxies over a period of 3 to 7 years. Details of the observations, such as the observing dates, the corresponding Julian dates, the telescopes we used, the wavelength coverage of the spectra, and exposure times, are listed in Table 2. In most cases we observed one spectrum per galaxy per year.
| Julian Date | UT Date | Telescope | Exp. time | |
| 2 400 000+ | [Å] | [sec.] | ||
| (1) | (2) | (3) | (4) | (5) |
| 3C 390.3 | ||||
| 48089 | 1990-07-17 | CA 3.5 | 3970 – 7300 | 3600 |
| 48475 | 1991-08-06 | CA 2.2 | 3360 – 8290 | 3300 |
| 48866 | 1992-09-01 | CA 2.2 | 3850 – 9150 | 3600 |
| 49595 | 1994-08-30 | CA 2.2 | 4520 – 8530 | 3600 |
| 4U 0241+61 | ||||
| 48475 | 1991-08-07 | CA 2.2 | 3360 – 8290 | 1800 |
| 48861 | 1992-08-27 | CA 2.2 | 3850 – 9150 | 3600 |
| 49596 | 1994-09-01 | CA 2.2 | 4520 – 8530 | 3600 |
| E 1821+643 | ||||
| 48095 | 1990-07-23 | CA 3.5 | 6050 – 9400 | 5280 |
| 48476 | 1991-08-07 | CA 2.2 | 5130 – 10800 | 3600 |
| 48813 | 1992-07-09 | CA 3.5 | 3670 – 9690 | 1200 |
| 48860 | 1992-08-25 | CA 2.2 | 3860 – 9150 | 3600 |
| 49597 | 1994-09-01 | CA 2.2 | 5960 – 10000 | 3300 |
| MRK 876 | ||||
| 48093 | 1990-07-20 | CA 3.5 | 4970 – 8310 | 6000 |
| 48474 | 1991-08-05 | CA 2.2 | 3350 – 8300 | 4500 |
| 48814 | 1992-07-10 | CA 3.5 | 3670 – 9690 | 1200 |
| 48862 | 1992-08-27 | CA 2.2 | 3860 – 9150 | 3000 |
| 49598 | 1994-09-02 | CA 2.2 | 4980 – 9000 | 2400 |
| MRK 926 | ||||
| 48090 | 1990-07-18 | CA 3.5 | 3970 – 7300 | 1500 |
| 48092 | 1990-07-20 | CA 3.5 | 6450 – 7320 | 4000 |
| 48478 | 1991-08-10 | CA 2.2 | 4070 – 5560 | 3600 |
| 48480 | 1991-08-11 | CA 2.2 | 5510 – 7630 | 3000 |
| 48816 | 1992-07-13 | CA 3.5 | 3670 – 5900 | 2400 |
| 49215 | 1993-08-16 | CA 2.2 | 3750 – 8170 | 1800 |
| 49577 | 1994-08-12 | CA 2.2 | 3800 – 9670 | 900 |
| 49596 | 1994-08-31 | CA 2.2 | 4520 – 8530 | 3000 |
| 50395 | 1996-11-07 | ESO 2.2 | 3810 – 7980 | 2400 |
| 50635 | 1997-07-05 | ESO 2.2 | 4100 – 7470 | 720 |
| NGC 6814 | ||||
| 48812 | 1992-07-09 | CA 3.5 | 3660 – 9690 | 6300 |
| 48866 | 1992-08-31 | CA 2.2 | 3850 – 9150 | 1800 |
| OX 169 | ||||
| 48093 | 1990-07-21 | CA 3.5 | 4970 – 8310 | 5400 |
| 48865 | 1992-08-30 | CA 2.2 | 3850 – 9150 | 3600 |
| 49598 | 1994-09-02 | CA 2.2 | 4980 – 9000 | 5400 |
| PKS 2349-014 | ||||
| 48094 | 1990-07-22 | CA 3.5 | 4970 – 8290 | 6000 |
| 48864 | 1992-08-30 | CA 2.2 | 3860 – 9160 | 3600 |
| 49598 | 1994-09-03 | CA 2.2 | 4980 – 9000 | 3600 |
| V396 Her | ||||
| 48093 | 1990-07-21 | CA 3.5 | 4970 – 8290 | 3600 |
| 48864 | 1992-08-29 | CA 2.2 | 3860 – 9160 | 3600 |
| 49596 | 1994-08-31 | CA 2.2 | 4520 – 8530 | 5450 |
| TON 256 | ||||
| 48094 | 1990-07-21 | CA 3.5 | 4970 – 8310 | 7200 |
| 48475 | 1991-08-06 | CA 2.2 | 3340 – 8290 | 4560 |
The spectra were obtained at Calar Alto Observatory in Spain with the 2.2 m and 3.5 m telescopes. Individual exposure times range from 15 minutes to 2 hours (see Table 2). In most cases a Boller & Chivens spectrograph was attached to the telescope, but several observations were recorded using the TWIN spectrograph at the 3.5 m telescope. The spectrograph slits had projected widths of 2 to 2.5 arcsec and 2 arcmin length. Typical seeing conditions were 1 to 2 arcsec. The slit was oriented in the north-south direction, in most cases, to minimize the impact of the light loss caused by differential refraction. We used different CCD detectors in the course of our monitoring program. Details of the CCD detectors we used are given in Table 3.
| Date | CCD | Dimension [Pixel] | Pixel Size | |
|---|---|---|---|---|
| [m] | [′′] | |||
| July 1990 | RCA #11 | 1024 640 | 15 | 0.58 |
| August 1991 | GEC #13 | 1155 768 | 22.5 | 1.32 |
| July 1992 | RCA #10 | 1024 640 | 15 | 0.56 |
| July 1992 | GEC #14 | 1155 768 | 22.5 | 0.84 |
| August 1992 | TEK #6 | 1024 1024 | 24 | 1.41 |
| September 1994 | TEK #13 | 1024 1024 | 24 | 1.41 |
| November 1996 | LORAL | 2048 2048 | 15 | 0.26 |
| July 1997 | LORAL | 2048 2048 | 15 | 0.26 |
In most cases, our spectra cover a wavelength range from 3800 Å to 7400 Å , typically (see Table 2) with a spectral resolution of 3 to 7 Å per pixel. HeAr spectra were taken after each object exposure for wavelength calibration. Various standard stars were observed for flux calibration. One spectrum for PKS 2349-14 was obtained with the 9.2m Hobby-Eberly Telescope (HET) at McDonald Observatory on August 24, 2004. We used the Marcario Low Resolution Spectrograph and the exposure time was 20 minutes. Details of the observing conditions with the HET can be found e.g. in Kollatschny et al. (kollatschny01 (2001)).
The reduction of the spectra (bias subtraction, cosmic ray correction, flat-field correction, 2D-wavelength calibration, night sky subtraction, flux calibration) was done in a homogeneous way with IRAF reduction packages 111IRAF is distributed by the National Optical Astronomy Observatories. We extracted spectra of the central 5 arcsec. The spectra have signal-to-noise ratios (S/N) of 20 to 40 in the continuum. Great care was taken to achieve a very accurate relative intensity calibration. All spectra were rebinned to the same spectral resolution and calibrated to the same absolute [O iii]5007 flux for each corresponding galaxy. Our absolute [O iii]5007 flux was obtained from those spectra that were taken under photometric conditions. In addition, the accuracy of our [O iii]5007 flux calibration was tested for all forbidden emission-lines over the entire spectrum. We calculated difference spectra for all our epochs with respect to the mean spectrum of our variability campaign. Thus we minimized the contamination by the host galaxy. The stellar Mg I b absorption feature at 5175 Å is very weak in all our AGN spectra except for NGC 6814 (see Figs. 2,3). Therefore, the relative contribution of the host galaxy flux to the ionizing continuum flux at 5100 Å should be less than 20 percent in our spectra. Corrections for small spectral shifts ( 0.5 Å) and for different scaling factors were executed by minimizing the residuals of the narrow emission lines in the difference spectra. We achieved a relative accuracy of 3 to 5 percent by means of the [O iii]5007 flux calibration.
3 Results
In Fig. 1 the spectra of PKS 234914 are shown to illustrate the range of spectral variations for the AGNs in our study.

Between 1990 and 1994, there was a sharp drop by more than 50 percent in the continuum flux, as well as in the broad emission-line intensities. A spectrum of PKS 2349-14 taken with the 9.2m Hobby-Eberly Telescope (HET) in 2004 is shown for comparison in Fig. 1. It appears that PKS 234914 as observed in 2004 has recovered the state that was measured in 1990.
We measured the rest frame continuum flux at 5100 Å and the integrated line intensities of the broad emission lines in the relative flux calibrated spectra of our sample. The wavelength boundaries we used for our continuum flux measurements at 5100 Å are given in Table 4. The underlying continuum of the H and H emission lines was interpolated between local minima on the short and long-wavelength sides of the lines (pseudo-continua). We integrated the total emission line fluxes above the continuum between the wavelength boundaries given in Table 4.
| Wavelength range [Å] | |||
|---|---|---|---|
| Object | Continuum | H | Pseudo-continuum |
| H | |||
| (1) | (2) | (3) | (4) |
| 3C 390.3 | 5368 – 5398 | 4968 – 5318 | 4800 – 5410 |
| 6628 – 7188 | 6552 – 7280 | ||
| 4U 0241+61 | 5268 – 5288 | 4998 – 5264 | 4800 – 5288 |
| 6598 – 7198 | 6400 – 7300 | ||
| E 1821+643 | 6626 – 6666 | 6200 – 6550 | 6150 – 6666 |
| 8098 – 8878 | 8050 – 9100 | ||
| Mrk 876 | 5740 – 5780 | 5362 – 5686 | 5330 – 5780 |
| 7030 – 7558 | 6900 – 7880 | ||
| Mrk 926 | 5335 – 5350 | 4978 – 5378 | 4750 – 5350 |
| 6700 – 7100 | 6472 – 7280 | ||
| NGC 6814 | 5112 – 5152 | 4798 – 4962 | 4650 – 5152 |
| 6310 – 6706 | 5950 – 6850 | ||
| OX 169 | 6152 – 6192 | 5798 – 6108 | 5740 – 6192 |
| 7742 – 8112 | 7625 – 8270 | ||
| PKS 2349-14 | 5966 – 6026 | 7346 – 7958 | 7240 – 8250 |
| 7346 – 7958 | 7240 – 8250 | ||
| V396 HER | 5982 – 6002 | 5518 – 5953 | 5518 – 6002 |
| 7347 – 8057 | 7300 – 7990 | ||
| Ton 256 | 5748 – 5812 | 5408 – 5564 | 5385 – 5812 |
| 7218 – 7582 | 7100 – 7700 | ||
The integration limits of the continuum and of individual broad emission lines are also shown in the mean AGN spectra (Figs. 2,3). The continuum region at 5100 Å is free of strong emission and/or absorption lines. The intensities of the continuum flux at 5100 Å and of the integrated Balmer line intensities are given in Table 5. The narrow line components were subtracted earlier.
| Jul. Date | F5100 | H | H | H / H |
|---|---|---|---|---|
| 2 400 000+ | ||||
| (1) | (2) | (3) | (4) | (5) |
| 3C 390.3 | ||||
| 48089 | 2.24 0.1 | 350 28 | 1910 230 | 5.46 0.66 |
| 48475 | 4.03 0.2 | 496 40 | 1830 220 | 3.69 0.44 |
| 48866 | 2.23 0.1 | 383 31 | 1800 220 | 4.70 0.57 |
| 49595 | 1.88 0.1 | 279 22 | 1310 160 | 4.70 0.57 |
| 4U 0241+61 | ||||
| 48475 | 0.79 0.1 | 36.8 4 | 546 76 | 14.84 2.07 |
| 48861 | 0.60 0.1 | 29.7 3 | 365 51 | 12.29 1.72 |
| 49596 | 0.71 0.1 | 34.2 3 | 476 67 | 13.92 1.96 |
| E 1821+643 | ||||
| 48095 | 6.67 1.0 | 1150 92 | 4630 560 | 4.03 0.49 |
| 48476 | 7.34 1.1 | 1050 84 | 4430 530 | 4.22 0.50 |
| 48813 | 6.87 1.0 | 1130 90 | 4310 520 | 3.81 0.46 |
| 48860 | 6.87 1.0 | 1150 92 | 4860 580 | 4.23 0.50 |
| 49597 | 8.17 1.2 | 1150 92 | 4790 570 | 4.17 0.50 |
| Mrk 876 | ||||
| 48093 | 3.32 0.2 | 366 29 | 1330 160 | 3.63 0.44 |
| 48474 | 3.55 0.2 | 323 26 | 1190 140 | 3.68 0.43 |
| 48814 | 4.06 0.2 | 396 32 | 1380 170 | 3.48 0.43 |
| 48862 | 4.28 0.2 | 399 32 | 1390 170 | 3.48 0.43 |
| 49598 | 4.15 0.2 | 341 27 | 1330 160 | 3.90 0.47 |
| Mrk 926 | ||||
| 48090 | 3.04 0.3 | 434 35 | 1400 170 | 3.23 0.39 |
| (2.29 0.2) | ||||
| 48092 | (2.03 0.2) | 1340 160 | ||
| 48478 | 4.11 0.4 | 503 40 | ||
| 48480 | (2.8 0.3) | 1610 190 | 3.20 0.38 | |
| 48816 | 2.94 0.3 | 469 37 | 1920 230 | 4.09 0.49 |
| (2.55 0.3 ) | ||||
| 49215 | 2.03 0.2 | 292 23 | ||
| 49577 | (1.35 0.1) | 761 91 | ||
| 49596 | 2.1 0.2 | 198 16 | 709 85 | 3.58 0.43 |
| 50395 | (1.36 0.1 ) | 685 82 | ||
| 50635 | (1.5 0.2) | 689 83 | ||
| NGC 6814 | ||||
| 48812 | 2.05 0.1 | 55.9 5 | 380 46 | 6.80 0.82 |
| 48866 | 3.45 0.2 | 42.7 3 | 360 42 | 8.43 0.98 |
| OX 169 | ||||
| 48093 | 1.10 0.1 | 88.7 4 | 374 30 | 4.22 0.34 |
| 48865 | 1.29 0.1 | 96.2 5 | 398 30 | 4.14 0.31 |
| 49598 | 1.31 0.1 | 94.1 5 | 396 30 | 4.21 0.32 |
| PKS 2349-014 | ||||
| 48094 | 1.42 0.1 | 147 12 | 512 15 | 3.48 0.10 |
| 48864 | 0.68 0.03 | 74.3 6 | 289 10 | 3.89 0.13 |
| 49598 | 1.59 0.1 | 120 10 | 306 37 | 2.55 0.31 |
| V396 Her | ||||
| 48093 | 0.79 0.04 | 45.9 4 | 203 24 | 4.72 0.56 |
| 48864 | 0.35 0.02 | 24.1 2 | 101 12 | 4.58 0.54 |
| 49596 | 0.47 0.02 | 31.3 3 | 120 15 | 4.42 0.52 |
| TON 256 | ||||
| 48094 | 1.00 0.1 | 144 12 | 680 80 | 4.19 0.50 |
| 48475 | 1.08 0.1 | 149 12 | 683 80 | 3.83 0.48 |
3.1 Light curves and mean spectra
The continuum light curves of our sample of very broad-line AGNs are shown in Figs. 2,3. The Julian Date (bottom), as well as year and month (top), of observations are given with the plots.


The continuum flux was measured at 5100 Å(rest-frame). The light curve of the continuum flux at 6200 Å is shown for Mrk 926 in addition, because at some epochs we only took spectra of the H region for this galaxy. The calculated mean spectra of the very broad-line AGNs are also presented in Figs. 2,3. We determined the line-widths (FWHM) of the broad emission lines and their equivalent values in addition to the continuum intensities. These results are given in Table 6.
3.2 Variability analysis
We determined the amplitudes of the continuum flux variations and of the broad emission-line intensities as the next steps. We concentrated on the fractional variations. A definition of the fractional variation is given by Rodríguez-Pascual et al. (rodriguez97 (1997)):
| (2) |
where F is the mean flux over the period of observations, the standard deviation, and the mean square value of the uncertainties associated with the fluxes . We list the statistics of the continuum and H line variations that we derived for our objects in Table 7.
| Object | Fvar F5100 | Fvar H | FWHM H | EQW H | F5100 | F5100 | H | H |
|---|---|---|---|---|---|---|---|---|
| [kms-1] | [Å] | |||||||
| (1) | (2) | (3) | (4) | (5) | (6) | (7) | (8) | (9) |
| 3C390 | 0.363 | 0.224 | 11531 1440 | 111 20 | 1.88 | 4.06 | 278.5 | 512.2 |
| 4U0241+61 | 0.118 | 0.037 | 8722 930 | 43 1 | 0.60 | 0.79 | 29.7 | 36.8 |
| E1821+643 | 0.128 | 0.020 | 6228 351 | 116 12 | 6.67 | 8.17 | 996.3 | 1150.8 |
| Mrk876 | 0.086 | 0.043 | 7385 448 | 79 9 | 3.32 | 4.28 | 323.0 | 398.7 |
| Mrk926 | 0.279 | 0.330 | 8505 150 | 143 26 | 2.03 | 4.11 | 198.1 | 502.7 |
| NGC6814 | 0.319 | 0.124 | 7557 353 | 25 13 | 1.95 | 3.45 | 42.7 | 56.5 |
| OX169 | 0.078 | 0.020 | 5008 294 | 59 4 | 1.10 | 1.31 | 88.7 | 96.2 |
| PKS2349-14 | 0.391 | 0.311 | 5132 1082 | 83 4 | 0.68 | 1.42 | 74.3 | 146.6 |
| V396HER | 0.415 | 0.319 | 12334 262 | 48 5 | 0.35 | 0.79 | 24.1 | 45.9 |
| Ton256 | 0.030 | 0.020 | 1458 18 | 108 4 | 1.0 | 1.08 | 143.7 | 149.3 |
For three of our galaxies (E1821+643, OX169, Ton256), we only get upper limits of the H line variations. In these cases the H variations were smaller than the error in Eq. 2. In this paper we focus only on the fractional variation of the continuum and of the H line.
In a few cases, the variability behavior of more than one emission line has been investigated: NGC5548, 3C390.3 (O’Brien et al. OBrien98 (1998); Dietrich et al. dietrich98 (1998); Peterson & Wandel peterson99 (1999)), Mrk110 (Kollatschny et al.kollatschny01 (2001)). When considering different emission lines in one AGN, the following trend was seen. The broader (FWHM) lines show stronger variability amplitudes, and the broader lines originate closer to the central black hole.
3.3 Correlation analysis and results
In the current study of broad-line AGNs, we are looking for correlations between the variability amplitudes of the optical continuum and the H emission-line flux, and (H), with the emission-line profile width and the equivalent width of H. The optical continuum and H intensity variations are plotted over the H line widths and their equivalent widths in Figs. 4–7. The linear fit we derived from the Pearson correlation is overlaid in each figure.


Besides the Pearson correlation coefficient
| (3) |
we calculated for each relation the Spearman’s rank-correlation coefficient
| (4) |
as well as the Kendall correlation coefficient
| (5) |
Here , , and are the associated probabilities for random correlations in percent (Bevington, Bevington92 (1992), Press et al. press92 (1992)). The Pearson correlation coefficient tests only a linear relation, while the Spearman rank-correlation coefficient and Kendall correlation coefficient test for a general monotonic relation (e.g. Press et al. press92 (1992)). The Kendall correlation coefficient is even more nonparametric than Spearman’s correlation coefficient. He uses only the relative ordering of ranks instead of using the numerical difference of ranks. Table 7 gives the results of our correlation analyses.
| F5100 vs FWHM | .637 | .636 | .511 | 4.8 | 5.9 | 4.0 |
|---|---|---|---|---|---|---|
| H vs FWHM | .192 | .179 | .143 | 68.0 | 69.4 | 65.2 |
| F5100 vs EQW | -.119 | -.127 | -.111 | 74.4 | 68.9 | 65.5 |
| H vs EQW | .466 | .500 | .333 | 29.2 | 23.8 | 29.3 |
Those galaxies showing no significant variations in the H line intensity (Table 6) were not considered for the H intensity correlation analysis.
We found a significant correlation between the fractional variations of the continuum and the H line width in our very broad-line AGN sample. The probability of being a random correlation is only 4 () or 6 () per cent. A correlation is said to be significant if the probability for a random correlation is less than 5 per cent (Taylor J. R., taylor96 (1996)).
The fractional variations in the H line intensity are poorly correlated with the H equivalent width (Table 7). No correlations were found between the the fractional variations in the H line intensity and the H line widths, as well as between the fractional variations of the continuum and H equivalent widths. About one half of our AGN sample shows stronger variations of the continuum than the other half (e.g. Fig. 6). The Spearman and Kendall tests may fail to detect correlations in case of bimodality. However, both halves show the same relation between the fractional variations of the continuum and H equivalent widths. Furthermore, Pearson’s correlation coefficient gives the same results as Spearman’s and Kendall’s tests.
Figure 8 shows the Balmer decrement (H/H) and its variations as a function of the continuum flux at 5100 Å.

Generally, the AGNs of our sample show Balmer decrements in the typical range of H/H 3 to 5. This is consistent with little or moderate reddening (2.8 to 3.1, case B). However, NGC 6814 and 4U024161 show pronounced Balmer decrements with H/H 7 to 14, respectively. In both objects the broad H component is very weak (Figs. 2,3). Considering the errors of the H and the H intensities (see Table 5), the Balmer decrement remained constant in most cases. This result is independent of absolute continuum and Balmer line fluxes. An expected anti-correlation of the Balmer decrement with the continuum flux variability cannot be confirmed by our sample. Such variations in the Balmer decrement as a function of the ionizing continuum flux can be explained by radiative transfer effects rather than by variation in the dust extinction. An increased optical depth in the Balmer lines can be induced by an increasing ionizing flux. The ionization front penetrates deeper into the gas in a radiation-bounded system. Calculations by Davidson & Netzer (davidson79 (1979)) showed that the theoretical H/H ratio varies as a function of the optical depth. However, a nearly constant Balmer ratio in Fig 8 that is independent of variations of the continuum cannot be explained in a simple way. A complex behavior of the Balmer decrement as a function of continuum intensity has been seen before, e.g. in the variable Seyfert galaxy NGC 7603 (Kollatschny et al. kollatschny00 (2000)).
An analysis of the fractional variations Fvar and the AGN luminosity, as well as redshifts, resulted in no significant correlation (see Sect. 4).
4 The variability analysis of further spectroscopic AGN samples
The correlation between the fractional continuum variations and the H line widths in our AGN sample motivated us to expand our sample and to test the relation on the published data from other campaigns investigating the optical variability of AGNs.
Kaspi et al. (kaspi00 (2000)) carried out an intense, long-term monitoring project of PG quasars. Their spectra were taken at the Wise Observatory and Steward Observatory. They published the continuum intensities, H fluxes, and H line widths (FWHM) of their PG quasars. The continuum and H fractional variability data of the PG quasars (in Tables 8,9) were calculated by us from the original data given by Kaspi et al. (kaspi00 (2000)). We determined the H equivalent line width from the H line fluxes and the continuum intensities.
| Object | z | mv | MB | FWHM [OIII] | Ref. | Ref. | |
|---|---|---|---|---|---|---|---|
| kms-1 | Col. 5 | W Hz-1 | Col. 7 | ||||
| (1) | (2) | (3) | (4) | (5) | (6) | (7) | (8) |
| PG0026 | 0.142 | 15.41 | -23.7 | 760 | 1 | 22.59 | 4 |
| PG0052 | 0.155 | 15.43 | -24.1 | 871 | 1 | 21.83 | 4 |
| PG0804 | 0.100 | 14.71 | -23.7 | 1513 | 1 | 21.94 | 4 |
| PG0844 | 0.064 | 14.50 | -22.1 | 1165 | 1 | 20.66 | 6 |
| PG0953 | 0.239 | 15.32 | -24.5 | 981 | 1 | 23.45 | 5 |
| PG1211 | 0.085 | 14.19 | -23.4 | 988 | 1 | 23.61 | 4 |
| PG1226 | 0.158 | 12.85 | -26.3 | 1582 | 1 | 26.54 | 4 |
| PG1229 | 0.064 | 15.30 | -21.7 | 827 | 1 | 20.99 | 4 |
| PG1307 | 0.155 | 15.11 | -23.5 | 845 | 1 | 22.30 | 5 |
| PG1411 | 0.089 | 14.01 | -22.9 | 1089 | 1 | 21.25 | 4 |
| PG1426 | 0.086 | 14.87 | -22.2 | 959 | 1 | 21.51 | 4 |
| PG1613 | 0.129 | 15.49 | -23.8 | 949 | 1 | 22.28 | 4 |
| PG1617 | 0.114 | 15.39 | -22.8 | 1107 | 1 | 22.50 | 5 |
| PG1700 | 0.292 | 15.12 | -25.2 | 1474 | 1 | 24.40 | 6 |
| PG1704 | 0.371 | 15.28 | -25.2 | 751 | 1 | 25.80 | 4 |
| PG2130 | 0.061 | 14.64 | -22.4 | 1044 | 1 | 21.46 | 4 |
| 3C 120 | 0.033 | 15.05 | -20.8 | – | 24.12 | 4 | |
| 3C 390.3 | 0.056 | 15.38 | -21.6 | 799 | 2 | 24.66 | 4 |
| Akn 120 | 0.032 | 13.92 | -22.2 | 490 | 3 | 22.43 | 5 |
| Fairall 9 | 0.047 | 13.83 | -23.0 | 425 | 3 | 22.96 | 5 |
| IC 4329A | 0.016 | 13.66 | -20.1 | 550 | 3 | 22.26 | 5 |
| Mrk 110 | 0.035 | 15.37 | -20.6 | 596 | 2 | 21.24 | 4 |
| Mrk 279 | 0.030 | 14.46 | -21.2 | 580 | 3 | 22.15 | 5 |
| Mrk 335 | 0.026 | 13.85 | -21.7 | 280 | 3 | 21.60 | 5 |
| Mrk 509 | 0.034 | 13.12 | -23.3 | 520 | 3 | 21.27 | 4 |
| Mrk 590 | 0.026 | 13.81 | -21.6 | 400 | 3 | 22.40 | 5 |
| Mrk 79 | 0.022 | 14.27 | -20.9 | 350 | 3 | 22.07 | 5 |
| Mrk 817 | 0.031 | 13.79 | -22.3 | 330 | 3 | 22.03 | 5 |
| NGC 3783 | 0.010 | 14.43 | -19.7 | 230 | 3 | 21.63 | 5 |
| NGC 4051 | 0.002 | 12.92 | -16.8 | 190 | 3 | 20.60 | 5 |
| NGC 4151 | 0.003 | 11.85 | -18.7 | 425 | 3 | 21.79 | 5 |
| NGC 5548 | 0.017 | 13.73 | -20.7 | 410 | 3 | 21.91 | 5 |
| NGC 7469 | 0.016 | 13.04 | -21.6 | 360 | 3 | 22.58 | 5 |
| Object | Fvar | Fvar | Ref. | FWHM H | Ref. | EQW H | Ref. | F5100 | F5100 | H | H | Ref. |
|---|---|---|---|---|---|---|---|---|---|---|---|---|
| F5100 | H | [kms-1] | [Å] | |||||||||
| (1) | (2) | (3) | (4) | (5) | (6) | (7) | (8) | (9) | (10) | (11) | (12) | (13) |
| PG0026 | 0.173 | 0.079 | 1 | 2100 140 | 2 | 35 4 | 1 | 1.96 | 4.34 | 98.2 | 154.2 | 1 |
| PG0052 | 0.199 | 0.114 | 1 | 3990 240 | 2 | 52 10 | 1 | 1.55 | 4.18 | 129.9 | 220.6 | 1 |
| PG0804 | 0.175 | 0.061 | 1 | 2984 51 | 2 | 91 15 | 1 | 4.65 | 9.05 | 570.9 | 718.2 | 1 |
| PG0844 | 0.105 | 0.096 | 1 | 2730 120 | 2 | 65 4 | 1 | 3.09 | 5.19 | 251.9 | 362.8 | 1 |
| PG0953 | 0.136 | 0.054 | 1 | 2885 65 | 2 | 59 8 | 1 | 1.72 | 2.85 | 139.8 | 176.6 | 1 |
| PG1211 | 0.134 | 0.121 | 1 | 1832 81 | 2 | 73 7 | 1 | 3.22 | 8.47 | 284.2 | 625.1 | 1 |
| PG1226 | 0.102 | 0.077 | 1 | 3416 72 | 2 | 51 6 | 1 | 21.6 | 33.7 | 1408 | 1929 | 1 |
| PG1229 | 0.107 | 0.125 | 1 | 3440 120 | 2 | 86 8 | 1 | 1.71 | 2.83 | 155.3 | 247.7 | 1 |
| PG1307 | 0.113 | 0.123 | 1 | 4190 210 | 2 | 78 9 | 1 | 1.62 | 2.77 | 147.4 | 242.4 | 1 |
| PG1411 | 0.105 | 0.050 | 1 | 2456 96 | 2 | 71 5 | 1 | 3.42 | 5.61 | 285.8 | 369.4 | 1 |
| PG1426 | 0.173 | 0.084 | 1 | 6250 390 | 2 | 54 6 | 1 | 3.66 | 8.08 | 269.1 | 376.5 | 1 |
| PG1613 | 0.123 | 0.060 | 1 | 7000 380 | 2 | 50 6 | 1 | 2.79 | 4.54 | 174.7 | 231.1 | 1 |
| PG1617 | 0.191 | 0.108 | 1 | 5120 850 | 2 | 76 17 | 1 | 1.03 | 2.23 | 100.0 | 165.9 | 1 |
| PG1700 | 0.060 | 0.021 | 1 | 2180 170 | 2 | 62 4 | 1 | 2.18 | 2.80 | 164.7 | 209.4 | 1 |
| PG1704 | 0.134 | 0.100 | 1 | 890 280 | 2 | 11 2 | 1 | 1.56 | 2.88 | 23.6 | 39.7 | 1 |
| PG2130 | 0.086 | 0.089 | 1 | 2410 150 | 2 | 95 9 | 1 | 4.19 | 6.36 | 400.1 | 595.9 | 1 |
| 3C 120 | 0.180 | 0.095 | 3 | 2205 185 | 3 | 83 13 | 4 | 2.7 | 6.4 | 269.6 | 444.6 | 4 |
| 3C 390.3 | 0.343 | 0.072 | 3 | 9630 804 | 3 | 107 15 | 5 | 1.03 | 2.70 | 151.29 | 266.66 | 5 |
| Akn 120 | 0.185 | 0.184 | 3 | 5284 203 | 3 | 90 8 | 4 | 6.6 | 12.7 | 570.8 | 1156.5 | 4 |
| Fairall 9 | 0.328 | 0.043 | 3 | 6901 707 | 3 | 98 5 | 5 | 5.31 | 7.88 | 409.16 | 631.31 | 5 |
| IC 4329A | 0.115 | 0.084 | 3 | 6431 6247 | 3 | 3.41 | 4.54 | 288.4 | 384 | 9 | ||
| Mrk 110 | 0.334 | 0.249 | 3 | 1521 59 | 3 | 118 24 | 4 | 1.6 | 5.7 | 212.1 | 581.2 | 4 |
| Mrk 279 | 0.092 | 0.058 | 3 | 3385 349 | 3 | 86 8 | 5 | 5.85 | 9.67 | 487.6 | 666.20 | 5 |
| Mrk 335 | 0.090 | 0.060 | 3 | 1629 145 | 3 | 94 7 | 4 | 6.5 | 10.1 | 699.5 | 936.5 | 4 |
| Mrk 509 | 0.181 | 0.106 | 3 | 2715 101 | 3 | 102 15 | 4 | 6.9 | 14.8 | 808.8 | 1466.2 | 4 |
| Mrk 590 | 0.187 | 0.286 | 3 | 1979 386 | 3 | 46 9 | 4 | 4.7 | 10.2 | 138.5 | 605.3 | 4 |
| Mrk 79 | 0.130 | 0.062 | 3 | 4219 262 | 3 | 74 9 | 4 | 5.2 | 10.0 | 467.2 | 671.2 | 4 |
| Mrk 817 | 0.144 | 0.166 | 3 | 3515 393 | 3 | 70 9 | 4 | 4.2 | 8.0 | 282.6 | 514.4 | 4 |
| NGC 3783 | 0.192 | 0.066 | 3 | 3093 529 | 3 | 82 7 | 5 | 9.68 | 14.68 | 952 | 1273 | 5 |
| NGC 4051 | 0.059 | 0.096 | 3 | 1072 112 | 3 | 44 3 | 5 | 10.75 | 15.02 | 370 | 589 | 5 |
| NGC 4151 | 0.057 | 0.061 | 3 | 4248 516 | 3 | 102 4 | 5 | 72.20 | 88.90 | 6290 | 8430 | 5 |
| NGC 5548 | 0.247 | 0.216 | 3 | 5421 200 | 3 | 85 12 | 5 | 4.89 | 17.46 | 262 | 1206 | 5 |
| NGC 7469 | 0.020 | 0.043 | 3 | 2169 459 | 3 | 51 1 | 5 | 18.39 | 20.39 | 709.41 | 853.8 | 5 |
| NGC 7603 | 0.427 | 0.538 | 6 | 6560 100 | 6 | 80 17 | 8 | 1.03 | 8.77 | 51 | 541 | 6 |
| Mrk 110 | 0.318 | 0.189 | 7 | 1670 50 | 7 | 132 26 | 8 | 1.53 | 5.93 | 266 | 624.5 | 7 |
Ref. 1: Calculated with data taken from
http://wise-obs.tau.ac.il/~shai/PG/ (Kaspi et al. kaspi00 (2000))
Ref. 2: Kaspi et al. (kaspi00 (2000))
Ref. 3: Peterson et al. (peterson04 (2004))
Ref. 4: Calculated with data taken from
http://www.astronomy.ohio-state.edu/~peterson/AGN/
(Peterson et al. peterson98 (1998))
Ref. 5: Calculated with data taken from
http://www.astronomy.ohio-state.edu/~agnwatch/data.html
Ref. 6: Kollatschny et al. (kollatschny00 (2000))
Ref. 7: Bischoff et al. (bischkoll99 (1999))
Ref. 8: Own calculations
Ref. 9: Winge et al. (winge95 (1995))
In big international projects such as the International AGN Watch campaign (e.g. Alloin et al. alloin94 (1994)), the Lovers of Active Galaxies program (e.g. Robinson robinson94 (1994)) and the Ohio State monitoring project (Peterson et al., peterson98 (1998)) about 30 AGNs have been investigated.
Peterson et al. (peterson04 (2004)) present the results of a thorough re-analysis of the entire AGN watch data, employing improved methods. From this paper we took the fractional optical continuum and H line intensities variations, as well as the H line widths of the AGNs and PG quasars (see Tables 8,9). We considered only data for those galaxies that were monitored for periods of more than one year. Furthermore we took only the average fractional variations for individual galaxies over many years. We measured the H equivalent widths of the AGNs in addition to the PG quasars (Table 9), using the original AGN watch data (Peterson et al. peterson04 (2004)), or we calculated it based on the published H and continuum intensity data (Peterson et al. peterson98 (1998)).
The fractional variation in the optical continuum of NGC 7469 was taken from Peterson et al. (peterson98 (1998)). Furthermore, the results of two other long-term monitoring projects of NGC 7603 and Mrk 110 have been put in Table 9. Spectroscopic results of these two AGNs have been published by Bischoff & Kollatschny (bischkoll99 (1999)) and Kollatschny et al. (kollatschny00 (2000)). The magnitudes MB and redshifts that we use in Figs. 9, 10 for the galaxies listed in Table 8, 9 have been taken from Veron & Veron (Veron01 (2001)).
4.1 Combined variability sample
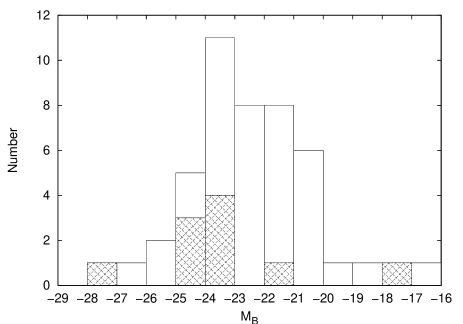
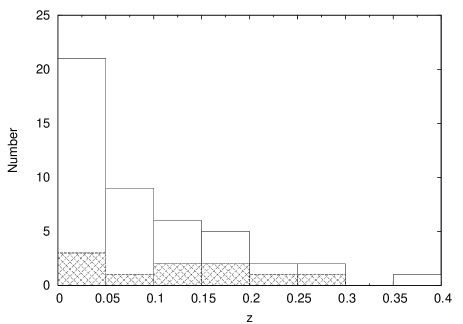
We combined the data for our variability sample of very broad-line AGNs with other AGN data taken from the literature (Table 8). Figure 9 shows the distribution of absolute B magnitudes of the combined AGN sample. In Fig. 10 we plot the redshift distribution of the combined AGN sample.
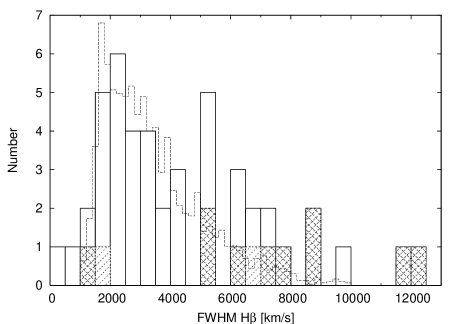
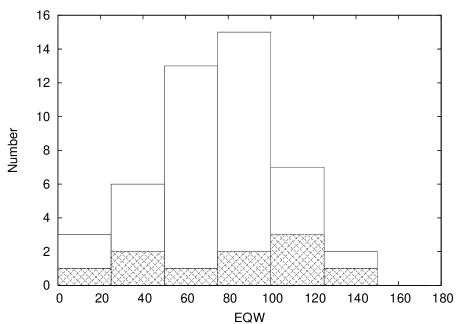
We show the H line widths distribution (FWHM) of the combined AGN sample in Fig. 11. We used a step-size of 500 kms-1. The cross-hatched bars give the distribution of the very broad-line AGN sample. The two single-hatched bars are based on Göttingen long-term variability studies of the galaxies Mrk 110 and NGC 7603. The relative distribution of the H line widths (FWHM) of AGNs derived from the Sloan Digital Sky Survey (SDSS) (Hao et al. hao05 (2005)) is superposed in Fig. 11. The H FWHM distribution of our combined variability AGN sample is representative of the H FWHM distribution of all SDSS AGNs, but with an excess of very broad-lined objects. Figure 12 then gives the H equivalent width distribution of the very broad-line AGN sample and of the comparison sample.
In general, the distributions of the H equivalent line widths, the absolute galaxy magnitudes, and the redshifts in the very broad-line AGN sample and the comparison sample are very similar. Since very broad-line AGNs are rare objects, their spectra had to be taken at slightly larger redshifts on average. Since the apparent magnitudes of the galaxies are similar in both variability samples, the absolute magnitudes of the very broad-line objects are therefore slightly brighter.
4.2 Correlation results of the combined sample
The line and continuum data of the combined AGN sample are given in Tables 6 and 9. The combined sample consists of 43 different galaxies. The galaxies Mrk 110 and 3C390.3 have been observed both by us (very broad-line AGN sample) and by other groups (see text). Therefore, their values are shown twice in Figs. 13 to 20. We computed a mean of their observed values which are used in the correlation analysis. The resulting correlation coefficients are given in Tables 10 and 11. There we consider only one value for each galaxy.
The optical continuum and H line intensity variations are plotted over the H line widths and their equivalent widths in Figs. 13 to 16 for the combined sample. Again we show the linear fit derived from the Pearson correlation for comparison.


Table 10 gives the results of our correlation analyses of the combined sample.
| F5100 vs FWHM | .553 | .409 | .300 | 0.0 | 0.8 | 0.5 |
|---|---|---|---|---|---|---|
| H vs FWHM | .322 | .157 | .114 | 4.2 | 32.7 | 29.9 |
| F5100 vs EQW | .156 | .125 | .079 | 31.8 | 41.6 | 45.7 |
| H vs EQW | .214 | .170 | .122 | 18.4 | 28.9 | 26.8 |
The combined AGN sample confirms and strengthens the correlation results
we got for the very broad-line sample just above:
- No correlation was found between the fractional variations
of the continuum and H equivalent widths.
A correlation mentioned by Giveon (giveon99 (1999)) for his sample of
Palomar-Green quasars cannot be confirmed by our results.
The H equivalent widths of Boroson and Green (boroson92 (1992))
used by
Giveon et. al (giveon99 (1999)) were taken one year before the start of
their variability campaign.
- The fractional variations in the H line intensities
are poorly correlated with the H
equivalent widths, as well as with the H line widths.
Pearson’s test gives a reasonably strong correlation for H variation
vs FWHM H, whereas the other tests do not. However,
Pearson’s correlation coefficient is a parametric statistic, and it may be
less useful if the underlying assumption of normality is violated.
- But a significant correlation resulted for the fractional variations of the
optical continua with the H line widths. The probability of being a
random correlation is 0.5 () only or 0.8 () per cent.
Next, we studied the relation of Fvar(5100) and Fvar(H) with redshift and luminosity for possible evolutionary effects (Table 11), and found no correlation between the fractional continuum variation with luminosities (see Fig. 17). There is no correlation between the fractional variations of the continuum in the rest-frame at 5100 Å and the AGN redshifts (72 () or 75 () per cent)(Fig. 18) .


| F5100 vs | .018 | .025 | .034 | 90.7 | 86.9 | 74.6 |
|---|---|---|---|---|---|---|
| H vs | -.100 | -.211 | -.155 | 53.3 | 18.1 | 15.3 |
| H EQW vs | -.217 | -.198 | -.139 | 16.2 | 19.9 | 19.0 |
| H FWHM vs | .205 | .090 | .061 | 18.7 | 56.2 | 56.4 |
| F5100 vs MB | .091 | .117 | .096 | 55.5 | 44.3 | 36.0 |
| F5100 vs z | -.108 | -.049 | -.037 | 48.6 | 74.8 | 72.3 |
| MBH vs FWHM H | .191 | .239 | .173 | 29.4 | 18.4 | 16.3 |
| MBH/L44 vs FWHM H | .509 | .398 | .294 | 0.3 | 2.7 | 1.8 |
We also tested whether there are any dependencies in the behavior of the
targets as a function of their radio power.
We found no correlation between the continuum
or H line intensity variations
with the radio power at 5 Ghz
(Table 11). Figure 19
e.g. shows the fractional variation of the continuum
at 5100 Å versus radio power at 5 Ghz.

Furthermore, there is no significant correlation between the H line widths (FWHM) or H equivalent widths with the radio power at 5 Ghz (Table 11). Figure 20 e.g. shows the H line width (FWHM) versus radio power at 5 Ghz.

5 Discussion and conclusion
First we discuss probable luminosity or redshift correlations before going into detail regarding the correlations of the continuum variations with the line-widths.
5.1 Redshift – variability correlations
So far, most of the information on AGN variability has been derived only from light curves in single bands. An average increase in variability with redshift of galaxies was announced by e.g. Cristiani et al. (christiani96 (1996)). Trevese & Vagnetti (Trevese02 (2002)) reanalyzed B and R light curves of PG quasars. They confirm the correlation between variability and redshift. But because B and R light curves correspond to different intrinsic wavelength bands in the quasar spectra, they explain the increase in the amplitudes with the increase in rest-frame frequency at higher redshifts. It is known that AGNs vary more in the blue than in the red. De Vries et al. (devries05 (2005)) for instance investigated the long-term quasar variability from Sloan Digital Sky Survey (SDSS) data, to find that the magnitude of the quasar variability is a function of wavelength. The variability increases toward the blue part of the spectrum.
In our present investigation, we derived the continuum variability amplitude from the AGN spectra in the rest-frame at 5100Å. There is no correlation between redshift and rest-frame continuum variability amplitude (Fig. 18). Only 5 galaxies in our sample have redshifts higher than 0.2. It would be useful to examine the spectral variability of other objects at larger distances.
5.2 Luminosity – variability correlations
Giveon et al. (giveon99 (1999)) found trends of an anti-correlation of variability amplitude with luminosity. De Vries et al. (devries05 (2005)) confirmed this trend in their long-term quasar variability study, showing that high-luminosity quasars vary less than low-luminosity quasars. They explain it with a scenario in which variations in AGNs caused by chromatic outbursts or flares have a limited absolute magnitude. In our variability study we also find the basic trend that more luminous objects are less variable (see Fig. 17), but this trend is not highly significant.
The fractional variability of the continuum of our very broad-line AGN sample shows either small or large variations. This suggests a bimodality for the very broad-line AGN sample. However, the bimodality of the fractional variations of the continuum disappears in the combined AGN sample.
5.3 X-ray – linewidth correlations
Many studies deal with correlations between different AGN properties. But not many detailed investigations exist that look for correlations between optical continuum variations and optical line widths. Fiore et al. (fiore98 (1998)) studied the X-ray variability properties of six PG quasars. They correlated the X-ray variability properties with optical line widths and found evidence that the three narrow-line AGNs of their sample show larger X-ray variability amplitudes than the three broader-line AGNs on timescales of 2 to 20 days. No differences were found on longer timescales. They propose that their correlation between X-ray amplitude variations and narrow/broad-line AGNs were caused by different L/ states, and suggest that narrow-line, steep X-ray spectrum AGNs emit close to the Eddington luminosity and have a relatively low-mass black hole.
We found no correlation between black hole masses and optical line widths (Table 11) or variability amplitudes (see next section). Our study is concentrated on long-term variations over years, on the one hand, and variations in the optical, on the other, contrary to the study of Fiore et al. (fiore98 (1998)). Variations in different frequency ranges may have completely different origins.
5.4 Optical variability – linewidth correlations
First of all, we tested whether there is a correlation between continuum variations and H equivalent widths. Giveon et al. (giveon99 (1999)) compared the long-term optical variability properties of PG quasars with many parameters. They found trends to an increase in continuum variability amplitudes with H equivalent width. As a possible, but unlikely, explanation for their trend, they discussed the possibility of different contributions of the emission lines to their variable broad-band fluxes. We tested the variability amplitude and H equivalent width correlation again for our samples of very broad-line and normal AGNs. In our study, the continuum flux was taken from the individual spectra and not from broad-band data. Our continuum flux is therefore independent of emission line contribution. We find no indication of a correlation between the continuum and H variability amplitudes with the H equivalent width.
But there is a significant correlation between AGN continuum variability amplitudes and H line widths for our combined AGN sample (see Table 7 and Fig. 13). This confirms the earlier result of our very broad-line sample. A relationship between these parameters has not been considered earlier by Giveon et al. (giveon99 (1999)).
The observed line width of the broad emission lines (including H)
in AGN spectra might be caused or
affected by different parameters simultaneously:
- Different central black-hole masses lead to different
Keplerian velocities of gravitationally bound emission-line clouds.
- The emission lines might originate at different radii with respect
to identical central black hole masses, again making
the assumption that their velocities are Keplerian.
- If the emission line region is connected with a central accretion disk,
the observed line width might be correlated with the inclination
of the disk (Kollatschny 2003a ) to our line-of-sight.
- Optical depth effects on line profiles produced in an accretion disk
wind (Murray & Chiang murray97 (1997)) might affect the profiles.
It has been shown that the observed single-peaked profiles in Mrk 110 are
consistent enough to be
generated in an accretion disk (Kollatschny & Bischoff kollatschny02 (2002))
indicating optical depth effects.
Optically thin lines generated in an accretion disk
should have double-peaked profiles.
The observed line-width in AGNs might be caused by a combination of these different effects in practice. The importance of the individual parameters could be different from galaxy to galaxy. Therefore, the strong significance of the correlation between H line width and continuum variations is surprising.
We tested whether the central black-hole mass is correlated with the width of the broad H line. By taking the black-hole mass data from the Peterson ’04 sample (peterson04 (2004)) and correlating them with the H line widths, we found no correlation (see Table 11). But the widths of the stellar absorption lines seem to be correlated with the central black-hole mass (Onken et al. onken04 (2004), Ferrarese & Merritt ferrarese00 (2000)).
Furthermore, we tested the significance of the correlation between H line width and black-hole mass-to-luminosity ratio. Figure 21 shows this relation and Table 11 gives their significance.

Wandel (wandel02 (2002)) has shown earlier that there is a significant correlation between these two parameters. He explains the close correlation between mass-to-luminosity ratio and line-width with the virial relation . But on the basis of the virial relation alone, it is difficult to understand why the correlation is far more significant than that of .
Comparing the significance of the correlation between black-hole mass-to-luminosity ratio and line width as a random correlation ( = 1.8 percent, Table 11) with our earlier correlation between optical continuum variability amplitudes and H emission line widths as a random correlation ( = 0.5 percent, Table 10), this relation is equal or even better.
Considering the influence of the inclination angle on broad emission-line widths there are indications that the line width of the broad emission lines in AGNs depends on the inclination angle of a central accretion disk (Wills & Browne wills86 (1986), Kollatschny 2003b ). But it is not easy to understand why the continuum variability of an edge on AGN should be stronger than the continuum variability of a face-on central source. Optical thickness effects might be important (Netzer, netzer87 (1987)).
Considering individual galaxies, it is known that broader emission lines originate closer to the center and show stronger variability amplitudes (e.g. Kollatschny et al. kollatschny01 (2001)). The central ionizing sources in AGNs - showing extreme flux variations over timescales of years - might excite BLR clouds over wider ranges in an accretion disk (and therefore produce lines with different widths) than those AGNs showing small-scale flux variations only.
In summary, our variability study showed that the most significant predictor of optical variability properties is the emission-line width. But the close correlation between these two parameters is not easy to explain.
Acknowledgements.
Part of this work was supported by the Deutsche Forschungsgemeinschaft, DFG.References
- (1) Alloin, D., Clavel, J., Peterson, B. M., Reichert, G. A., & Stirpe, G. M. 1994, in Frontiers of Space and Ground-Based Astronomy, ed. W. Wamsteker, M. S. Longair, & Y. Kondo (Dordrecht: Kluwer), 423
- (2) Apparao, K. M. V., et al. 1978, Nature, 273, 450
- (3) Bevington, P. R., & Robinson, D. K. 1992, Data Reduction and Error Analysis, New York: McGraw-Hill, 1992, 2nd ed.,
- (4) Blandford, R. 2004, In: Growing Black Holes: Accretion in a Cosmological Context, ed. Merloni, A. et al., ESO Astrophysics Symposia, Springer, 477
- (5) Bischoff, K., & Kollatschny, W. 1999, A&A, 345, 49
- (6) Bond, H. E., Kron, R. G., & Spinrad, H. 1977, ApJ, 213, 1
- (7) Boroson, T. A., & Green, R. F. 1992, ApJS, 80, 109
- (8) Christiani, S., Trentini, S., La Franca, F., et al. 1996, A&A, 306, 395
- (9) Davidson K., & Netzer H. 1979, Rev. Mod. Phys 51, 715
- (10) De Vries, W. H., Becker, R. H., White, R. L., & Loomis, C. 2005, Astron.J 129, 615
- (11) Dietrich, M., et al. 1998, ApJS, 115, 185
- (12) Ferrarese, L., & Merritt, D. 2000, ApJ 539, L9
- (13) Fiore, F., Laor, A., Elvis, M., Nicastro, F., Giallongo, E. 1998, ApJ 503, 607
- (14) Giveon, U., Maoz, D., Kaspi, S., Netzer, H., &Smith, P. S.1999, Mon.Not.RAS, 306, 637
- (15) Gregory, P. C., & Condon, J. J. 1991, ApJS, 75, 1011
- (16) Hao, L., Strauss, M. A.; Tremonti, C. A., et al. 2005, Astron.J 129, 1783
- (17) Ho, L. C. 2002, ApJ, 564, 120
- (18) Horne, K., Peterson, B.M., Collier, S.J. & Netzer, H. 2004, PASP 116, 465
- (19) Kaspi, S., Smith, P.S., Netzer, H., Maoz, D., Jannuzi,B.T., & Giveon, U. 2000, ApJ 533, 631
- (20) Kellermann, K. I., Sramek, R., Schmidt, M., Shaffer, D. B., & Green, R. 1989, AJ, 98, 1195
- (21) Kollatschny, W. 2003, A&A, 407, 461
- (22) Kollatschny, W. 2003, A&A, 412, L61
- (23) Kollatschny, W., & Bischoff, K. 2002, A&A, 386, L19
- (24) Kollatschny, W., Bischoff, K., & Dietrich, M. 2000, A&A, 361, 901
- (25) Kollatschny, W., Bischoff, K., Robinson, E.L., Welsh, W.F., & Hill, G.J. 2001, A&A, 379, 125
- (26) Kolman, M., Halpern, J. P., Shrader, C. R., & Filippenko, A. V. 1991, ApJ, 373, 57
- (27) Magorrian, J., et al. 1998, AJ, 115, 2285
- (28) Murray, N., & Chiang, J. 1997, ApJ, 474, 91
- (29) Netzer, H. 1987, MNRAS, 225, 55
- (30) O’Brien, P. et al. 1998, ApJ, 509, 163
- (31) Onken, C. A , Ferrarese, L. , Merritt, D. et al. 2004, ApJ 615, 645
- (32) Osterbrock, D., Koski, A. T., & Phillips, M. M. 1976, ApJ 206, 898
- (33) Osterbrock, D., & Pogge, R. 1985, ApJ 297, 166
- (34) Peterson, B.M. 2001, Advanced Lectures on the Starburst-AGN Connection, Proceedings of a conference held in Tonantzintla, Puebla, Mexico, Ed. Itziar Aretxaga et al., Singapore: World Scientific, p.3
- (35) Peterson, B.M., Polidan, R.S., & Pogge, R. 2000, Probing the Physics of Active Galactic Nuclei by Multiwavelength Monitoring, ASP Conf. Ser. 224, San Francisco
- (36) Peterson, B.M., Wanders, I., Bertram, R., et al. 1998, ApJ 501, 82
- (37) Peterson, B.M., & Wandel, A. 1999, ApJ 521, L95
- (38) Peterson, B.M., et al. 2004, ApJ, 613, 682
- (39) Press, W. H., Teukolsky, S. A., Vetterling, W. T., & Flannery, B. P. 1992, Numerical Recipes, Cambridge University Press, 1992, 2nd ed.
- (40) Robinson A., 1994, The LAG Spectroscopic Monitoring Campaign: An Overview. In: Gondhalekar P.M., Horne K., Peterson B.M. (eds.) Reverberation Mapping of the Broad-Line Region in Active Galactic Nuclei, ASP Conf. Ser. 69, San Francisco, p. 147
- (41) Rodríguez-Pascual P.M., Alloin D., Clavel J., et al., 1997, ApJS 110, 9
- (42) Romano, P., et al. 2004, APJ, 602, 635
- (43) Smith, H. E. 1980, ApJ, 241, L137
- (44) Taylor J. R. 1996, An introduction to error analysis, University science books, 1996, 2nd ed.
- (45) Trevese, D., & Vagnetti, F. 2002, ApJ, 564, 624
- (46) Veilleux, S, & Zheng, W. 1991, ApJ, 377, 89
- (47) Veron-Cetty, M. P., & Veron, P. 2001, A Catalogue of Quasars and Active Nuclei, VizieR Online Data Catalog, 7224, 0
- (48) Wandel, A. 2002, ApJ 565, 762
- (49) Williams, R. J., Pogge, R. W., & Mathur, S. 2002, AJ, 124, 3042
- (50) Winge, C., Peterson, B. M., Horne, K., Pogge, R. W., Pastoriza, M. G., & Storchi-Bergmann, T. 1995, ApJ, 445, 680
- (51) Wills, B. J. & Browne, I. W. A. 1986, ApJ 302, 56
- (52) Xu, C., Livio, M., & Baum, S. 1999, AJ, 118, 1169