The AGN Outflow in the HDFS Target QSO J2233-606
from a High-Resolution VLT/UVES Spectrum11affiliation: Based on public data released from the UVES commissioning
at the VLT/Kueyen telescope, ESO, Paranal, Chile.
Abstract
We present a detailed analysis of the intrinsic UV absorption in the central HDFS target QSO J2233-606, based on a high-resolution, high S/N (25 – 50) spectrum obtained with VLT/UVES. This spectrum samples the cluster of intrinsic absorption systems outflowing from the AGN at radial velocities 5000 – 3800 km s-1 in the key far-UV diagnostic lines - the lithium-like CNO doublets and H i Lyman series. We fit the absorption troughs using a global model of all detected lines to solve for the independent velocity-dependent covering factors of the continuum and emission-line sources and ionic column densities. This reveals increasing covering factors in components with greater outflow velocity. Narrow substructure is revealed in the optical depth profiles, suggesting the relatively broad absorption is comprised of a series of multiple components. We perform velocity-dependent photoionization modeling, which allows a full solution to the C, N, and O abundances, as well as the velocity resolved ionization parameter and total column density. The absorbers are found to have supersolar abundances, with [C/H] and [O/H] 0.5 – 0.9, and [N/H] 1.1 – 1.3, consistent with enhanced nitrogen production expected from secondary nucleosynthesis processes. Independent fits to each kinematic component give consistent results for the abundances. The lowest-ionization material in each of the strong absorbers is modeled with similar ionization parameters. Components of higher-ionization (indicated by stronger O vi relative to C iv and N v) are present at velocities just redward of each low-ionization absorber. We explore the implications of these results for the kinematic-geometric-ionization structure of the outflow.
Subject headings:
galaxies: quasars: absorption — galaxies: quasars: individual (QSO J2233-606)1. Introduction
Active galactic nuclei (AGN) often show mass outflow as blueshifted absorption in their restframe UV and X-ray spectra. Many recent studies have explored the potential global effects of AGN outflows on all scales of their environment: from influencing the growth of the central supermassive black hole (Blandford & Begelman, 1999, 2004), the evolution of the host galaxy (Silk & Rees, 1998; Scannapieco & Oh, 2004), the luminosity function of quasars (Wyithe & Loeb, 2003), and the magnetization and chemical enrichment of galactic gas (Furlanetto & Loeb, 2001) and the intergalactic medium (Cavaliere, Lapi, & Menci, 2002). It is unclear if the outflows seen as UV/X-ray absorption are related to these global phenomena, or if they are connected to other AGN components showing evidence for bulk outflow motion such as the relativistic jets seen in radio observations and the emission-line gas.
Measured ionic column densities provide the basis for physical interpretation of AGN outflows. Detailed UV spectral studies have shown measurements of these crucial parameters are often not straightforward. Analyses of absorption doublets and multiplets show the absorbers typically only partially occult the background emission sources (e.g., Hamann et al., 1997; Barlow & Sargent, 1997), with potential complex scenarios involving different covering factors for different background emission sources (Ganguly et al., 1999; Gabel et al., 2003), velocity-dependent covering factors (e.g., Arav et al., 1999), and possibly inhomogeneous distributions of absorbing material (de Kool et al., 2002a; Arav et al., 2005). Detailed spectral studies of rich absorption line spectra at high spectral resolution and high signal-to-noise (S/N) are needed to deconvolve these effects from the observed absorption lines, and thereby determine the total column density, ionization, and chemical abundances of the outflow via modeling.
The quasar absorption-line spectrum of QSO J2233-606 (hereafter J2233) has been intensively observed and studied due to its location in the center of the Hubble Deep Field South (HDFS; Ferguson 1998), its high redshift (=2.238), and relative brightness (17.5) (Sealey et al., 1998; Savaglio, 1998; Outram et al., 1999; Prochaska & Burles, 1999; Cristiani & D’Odorico, 2000; Kim et al., 2001). In addition to the rich intervening absorption spectrum, these observations have revealed several “associated” absorption systems (Sealey et al., 1998; Savaglio, 1998; Outram et al., 1999; Petitjean & Srianand, 1999). These have been interpreted as outflowing material associated with the QSO in J2233 due to their partial line-of-sight coverage of the compact AGN emission, relatively broad widths, and proximity in redshift to the host galaxy (2.198 – 2.21). Petitjean & Srianand (1999) presented an analysis of the (rest-frame) UV associated absorption in J2233 using high-resolution optical spectra and supplementary long observations with the Hubble Space Telescope (HST) obtained as part of the HDFS program, which sampled lines spanning a large range of ionization. Their photoionization modeling of one kinematic component (2.198) showed that in addition to a relatively low-ionization region giving the H i, C iv, and N v absorption, a high-ionization zone is needed to reproduce the strong Ne viii absorption. They found this component was consistent with having approximately solar metallicity, with qualitative evidence for the N/C abundance ratio enhanced relative to the solar value. They also found ion-dependent covering factors and suggested this may be due to a smaller covering factor of the emission-line region than the continuum source (see also Outram et al., 1999).
J2233 was observed for a total of 14 hours with VLT/UVES as part of a large program to study intervening systems in quasar absorption spectra (Kim et al., 2001). We present here a detailed analysis of the absorption-line properties and physical conditions in the associated absorption systems based on this spectrum. Our study is outlined as follows: in §2, we review the observational details and present the intrinsic absorption spectrum from these observations. In §3, we make use of the broad spectral coverage which includes the CNO lithium-like doublets and H i Lyman series lines at high resolution and high S/N to solve for the individual covering factors of the emission-line and continuum sources and the velocity-dependent ionic column densities. In §4, we incorporate velocity-dependent photoionization modeling of each kinematic component to highly constrain the models and derive the full solution to the physical conditions (total column density and ionization) and chemical abundances of the outflow. In §5, we explore the implications of this analysis for the outflow’s geometric, kinematic, and ionization structure.
2. VLT/UVES Observations and the Intrinsic Absorption in J2233
J2233 was observed with VLT/UVES for a total of 50.4 ks between 1999 October 8 – 16 during the Commissioning of UVES (we refer the reader to Cristiani & D’Odorico 2000 and Kim et al. 2001 for full details of the observations). These observations used the dic1 346580 (28.8 ks) and dic2 437860 (21.6 ks) settings of UVES, giving full spectral coverage between 3060 – 10000 Å. The data were processed with the ESO-maintained MIDAS ECHELLE/UVES package, as described in Kim et al. (2001). The reduced spectrum was resampled to 0.05 Å bins and normalized locally using a 5th order polynomial fit. The resulting final spectrum used in the analysis had resolving power ranging from 30,000 – 50,000 and S/N between 25 – 50 for the spectral regions of interest, with increasing values towards longer wavelength.
The UVES spectrum covers the rest wavelengths of a host of key diagnostic far-UV lines for intrinsic absorbers, including the CNO lithium-like doublets (O vi 1032,1038, N v 1238,1242, C iv 1548,1551) and Lyman series lines which are ubiquitous in intrinsic UV absorption spectra, as well as a number of less common lines that probe lower ionization (e.g., C iii 977, Si iv 1393,1403, N iii 991) and lower abundances (e.g., S vi 933,944, P v 1118,1128). This is the first high-resolution spectrum of J2233 that spans all these lines with the same instrument and in the same epoch. The UVES spectrum is also of significantly higher quality than the previous observations: it has about twice the resolution and 4 – 5 times higher S/N at the C iv lines, twice the S/N at N v and Ly, and six times better resolution and 2 – 5 times higher S/N than the HST/STIS G430M grating observation of the O vi/Ly spectral region (see Table 1 in Petitjean & Srianand 1999).
| Component | Velocityaa Centroid velocity and FWHM are for C iv 1548 for components 1 – 3 and O vi 1032 for components 4 –6. | FWHMaa Centroid velocity and FWHM are for C iv 1548 for components 1 – 3 and O vi 1032 for components 4 –6. | Linesbb Detected lines in each kinematic component in VLT/UVES spectrum. |
|---|---|---|---|
| km s-1 | km s-1 | ||
| 1 | -4805 | 56 | O vi, N v, C iv, Ly, Ly |
| 2 | -4137 | 171 | O vi, N v, C iv, Ly, Ly |
| 3 | -3971 | 131 | O vi, N v, C iv, Lycc Ly contaminated with Ly forest. |
| 4 | -3830 | 55 | O vi |
| 5 | -3705 | 50 | O vi |
| 6 | -3634 | 32 | O vi |
Figure 1 shows the associated absorption spectra for several key diagnostic lines in the UVES spectrum, plotted on velocity scale with respect to the restframe of the AGN. We also include the Ne viii 770,780 doublet observed with the Space Telescope Imaging Spectrograph (STIS) using the E230M grating as part of the HDFS observations (Ferguson, 1998). Figure 1 shows three strong absorption components centered at 4800, 4150, and 3950 km s-1 (hereafter components 1, 2 and 3, respectively), identified as associated systems in earlier observations based on the partial line-of-sight covering factors inferred from the doublet lines (Outram et al., 1999; Savaglio, 1998; Petitjean & Srianand, 1999). They are also distinguished from intervening absorbers in the high-resolution of the UVES spectrum by their relatively large widths, as seen for example by comparison with the Ly forest lines in Figure 1. These absorbers exhibit absorption, in increasing strength, in the C iv, N v, and O vi doublets; they are not detectable in the lower ionization lines C iii or the Si iv doublet. Though the STIS spectrum has substantially lower S/N and there is potential contamination from intervening absorption, Ne viii also appears strong in components 1 and 3, and possibly component 2. Ly is present in all three components, and weaker than in the CNO doublets; Ly is detected in component 1, with a potential weak notch present in component 2, while component 3 is contaminated with intervening Ly forest absorption. The higher order Lyman lines are in a low S/N region of the UVES spectrum, but there is no detectable absorption in these lines within the limits of the noise. There are three additional relatively weak systems seen in the O vi doublet (and possibly Ne viii) just redward of component 3 (components 4 – 6 at 3850, 3700, and 3625 km s-1; Petitjean & Srianand, 1999). These systems are not detectable in absorption in any other lines. Table 1 summarizes the kinematic properties and lines present in each kinematic component.


3. Velocity-Dependent Ionic Column Densities and Covering Factor Solutions
3.1. Fitting Formalism
The observed intrinsic absorption troughs are a convolution of line-of-sight covering factor () and optical depth (). These factors must be deconvolved in order to obtain ionic column densities for modeling the ionization and abundances of the outflows; additionally, the covering factors derived from this separation give important constraints on the absorption-emission geometry. With the two lines of an absorption doublet, single values for and can be derived at each velocity (e.g., Hamann et al., 1997; Barlow & Sargent, 1997); however, complex structure in the absorber (e.g., de Kool et al., 2002a; Arav et al., 2005) or the background emission sources (e.g., Ganguly et al., 1999; Gabel et al., 2003) requires more than two lines to obtain the full solution. In particular, if continuum and line emission both underly the absorption features, the individual emission sources will in general have different covering factors, with implications for the doublet solution and relative values between different lines (see §3 in Gabel et al., 2005a).
We applied a global fitting approach to determine the velocity-dependent covering factors and column densities of the outflow in J2233, following the method outlined in Gabel et al. (2005a). This approach allows for treatment of different covering factors for the continuum and emission-line sources by simultaneously fitting the observed absorption lines from multiple ions. The general absorption equation to solve for the normalized intensity of the line is:
| (1) |
where the individual emission source contributes a fraction to the total intrinsic intensity and has covering factor (Ganguly et al., 1999; Gabel et al., 2005a). Here we have assumed that a single, uniform column density for each ion occults all emission sources. The effective covering factor for each line is the intensity-weighted combination of the individual covering factors,
| (2) |
For components 1 – 3 in the J2233 outflow, there are up to 8 detected lines available to constrain the absorption parameters (fewer where lines are contaminated with other absorption): the C, N, O doublets, Ly, and Ly. We assumed all ions share the same covering factors of the continuum and emission line sources ( and ), and simultaneously fit the individual covering factors and C iv, N v, O vi, and H i column densities. These parameters were solved in each velocity bin of the absorption profiles using equation 1 via the Levenberg-Marquardt non-linear least-squares minimization technique (additional details are given in Gabel et al., 2005a). We limited our search of the covering factor parameter space to the physically meaningful range, 01. Regions of contamination with other absorption were omitted from the fitting. This included the far blue wing of component 1 N v 1242 and red wing of component 3 N v 1238 due to blending of these lines, and obvious intervening Ly forest lines: at 4240 and 4140 km s-1 in N v 1238 and 4030 km s-1 in Ly (see Figure 1).
A source of modeling uncertainty is the intrinsic flux levels of the continuum and BLR emission; the VLT/UVES spectrum is not flux-calibrated and thus the intrinsic shape of the AGN emission cannot be determined from these data. Therefore, to determine the relative contributions, and , we adopted results from previous observations of J2233. For O vi and Ly, we used the HDFS STIS G430M spectrum obtained in 1998 October. For the longer wavelength lines, we used published results from earlier ground-based observations: Ly and N v were from data in Outram et al. (1999) obtained between 1997 August – 1998 August and C iv from a spectrum in Savaglio (1998) obtained in 1997 October. Based on these published results, our adopted contributions from the BLR for fitting were: 0.15 for O vi ; 0.3 for C iv ; 0.4 for N v and Ly; and 0.1 for Ly. A caveat is that since these observations were obtained at previous epochs (the UVES spectrum was obtained in 1999 October), there may have been variability in the intrinsic emission that could affect our results. However, we believe this effect will be minimal since high-luminosity QSOs like J2233 do not typically exhibit strong variability over timescales of a few years. For example, in a recent analysis of the 2500 QSOs in the SDSS database having multiple observations separated by more than 50 days, Whilhite et al. (2005) found only 12% exhibited significant variability. Additionally, HST/STIS observations of J2233 obtained a year apart had identical fluxes (see Figure 2 in Petitjean & Srianand, 1999).
3.2. Results
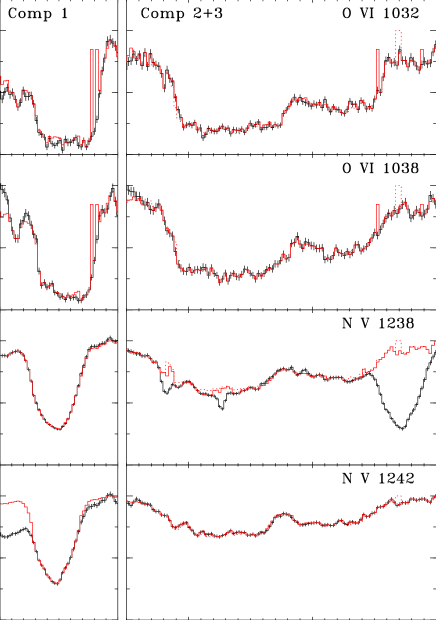
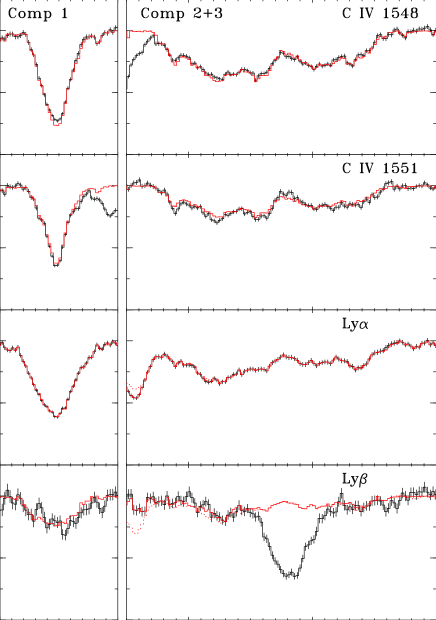
The results of the fits for the covering factors and optical depths are shown in Figures 2 and 3, respectively. The plotted error bars represent the formal 1 statistical errors in the best-fit parameters, corresponding to values giving 1, and were computed from the diagonal elements of the covariance matrix for the optimal fit (Bevington 1969); they do not include any uncertainties associated with the intrinsic flux levels. For cases where the covering factor solution is a boundary value (0,1), no covariance matrix elements are computed since it is not a minimum in the solution; for these cases, we estimated uncertainties by deriving solutions for models keeping the parameter fixed, and finding the value giving 1 from the best-fit solution at the boundary value. For 3, an absorption line can be considered to be saturated – for these large optical depths, changes in affect the absorption depths less than the uncertainties in the flux levels. Thus, we adopt solutions giving 3 as lower limits of 3. This occurs over much of the core of the component 1 O vi profile, and over a narrower region of the core of N v in this component. The fits in several bins in O vi in components 2 and 3 also reach these large values of , mostly corresponding to the peaks in the profiles in the other ions. In Figure 4, the absorption profile fits (red), derived by inserting the best-fit solutions into equation 1, are compared with the observed profiles. Most of the absorption in all lines is fit well by this model. In §4.5, we explore some of the minor discrepancies in the fit and their implications for our fitting assumptions and subsequent analysis.

Figure 2 shows the continuum source covering factor is near unity for all velocity bins in components 1 and 2. Component 3 only partially occults the continuum source, with 0.75. The BLR emission is partially occulted in component 1, peaking at 0.55 in the core and decreasing sharply in the wings of the profile. In components 2 and 3, the BLR coverage is low, with 0 at better than the 2 level at nearly all velocities. Results are summarized in Table 2. The overall covering factor solutions give compelling support for the assumptions made in the calculations. Since each velocity bin provides an independent solution, the similarity in the individual solutions across each kinematic component supports the distinction of the continuum and BLR coverage as a major factor in the formation of the observed troughs. If this were instead an artificial distinction, it seems unlikely that the same result for would be obtained over the numerous bins associated with each component, particularly since they exhibit a range of optical depths for each ion and optical depth ratios between ions. These results are also consistent with the general picture of the AGN emission geometry, in which the BLR is much more extended than the compact UV continuum source (further implications of these results are treated in §5).
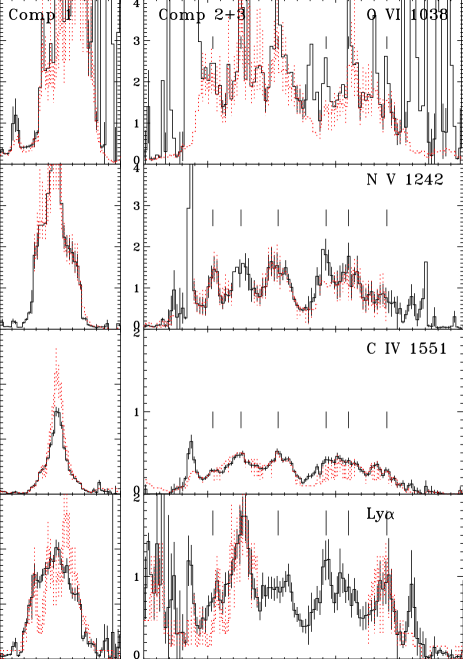
In Figure 3, interesting substructure in the optical depth profiles is revealed in components 2 and 3. The relatively broad features break down into a series of narrow subpeaks in , with coincident kinematic structure seen in the different ions. We note some of the substructure in the optical depth profiles coincides with the fluctuations in the solution in Figure 2. Thus, to test if the structure in the solutions is an artifact of the minimization fitting, we also fit the absorption constraining 0 at all velocities. Resulting fits to the profiles are plotted in Figure 4 (dotted red histograms), showing similarly good fits over most of the absorption. The resulting profiles of this fit show similar overall structure as the solutions shown in Figure 4 with a free parameter, indicating this structure is likely real. Component 1 is seen to have velocity-dependent ionization structure; C iv and N v exhibit a narrow peak at 4810 km s-1, in contrast with O vi, which is strong (saturated) over a broader range of velocities extending redward to 4740 km s-1. H i lacks the sharp narrow peak in the core, exhibiting a relatively broad base of absorption over the profile. We integrated the optical depth profiles over velocity, and computed total ionic column densities associated with each kinematic component. Results are summarized in Table 2.
| Aaa Intrinsic absorption kinematic component (see Table 1). | bb All column densities, , are in units 1014 cm-2; O VI, N V, C IV, and H I were measured from the global-fit solutions (§3). | cc Derived continuum () and emission-line () covering factors at the core velocities of each component. | cc Derived continuum () and emission-line () covering factors at the core velocities of each component. | ||||
|---|---|---|---|---|---|---|---|
| 1dd Heavy saturation in O vi at 4800 – 4750; N v saturated at 4820 – 4790. | 13 | 7 | 1.4 | 1.1 | 0.1 | 0.95 – 1 | 0.55 |
| 2 | 19 | 6.5 | 1.4 | 1.0 | 0.1 | 0.9 – 1 | 0 – 0.2 |
| 3 | 15 | 5.7 | 1.2 | 0.8 | 0.1 | 0.65 – 0.75 | 0 – 0.2 |
Our measurements can be compared with those of Petitjean & Srianand (1999), who present results only for component 1. The H i measurements are similar (within 20%), however, our C iv column density is only about half their measured value, while N v is at least two times greater, with saturation at some velocities. Additionally, we find O vi is heavily saturated over much of the profile (see Figures 1 and 3) giving only a lower limit on its column density; this was not discernible in the HST/STIS G430M spectrum used in the Petitjean & Srianand (1999) study due to the limited S/N.
4. Derivation of the Abundances, Ionization, and Total Column Density in the Outflow
4.1. Modeling Methodology and Input Parameters
To determine the physical conditions and abundances in the outflow in J2233, we compare the measured ionic column densities derived in §3 with predictions from models computed with the photoionization code Cloudy (Ferland et al., 1998). A model is specified by the spectral energy distribution (SED) of the ionizing continuum, the total hydrogen column density () and elemental abundances in the absorber, and the ionization parameter (), which gives the ratio of the density of H-ionizing photons at the face of the absorber to the gas number density, .
In components 1 – 3 in the J2233 outflow, model constraints are available from measurements of C iv, N v, O vi, and H i. To fully model these four ions, five parameters must be specified for the adopted SED: , , and the abundances of C, N, and O relative to H, thus the solution for a single measurement of these ions is underconstrained. However, the high-resolution of the column density solutions derived in §3 can be utilized to give additional model constraints thereby allowing the full solution of the absorber properties. In the most straightforward model, the elemental abundances will be the same throughout the absorber; thus we model the column densities measured in each velocity bin of an absorption component and link the solutions for all velocities by requiring the C, N, and O abundances to be the same at all velocities. Given the highly resolved absorption profiles, this greatly increases the number of constraints for the models, which allows the fitting of the abundances and gives the velocity-dependent solution of the physical conditions ( and ) in individual absorption components. Another advantage of this method compared with modeling integrated column densities over a component is that regions of line saturation can be isolated.
We adopted the SED used in Gabel et al. (2005b) for our modeling, which consists of a broken power law () in the ionizing continuum, with 1.4 and 0.7 over energy intervals 0.0136 – 0.6 and 0.6 – 50 keV, respectively. The ionizing continuum used in the calculations is a source of uncertainty; a study by Laor (1999) shows that the SED for quasars may be somewhat steeper than the one adopted for our modeling, which is typical for lower luminosity AGN. We have done extensive testing with different SEDs to explore its effect and find it does not significantly change our main results on the ionization and abundances in the outflow.
We computed a grid of photoionization models in , for solar elemental abundances (Grevesse & Anders, 1989). We then fit the absorbers by minimizing the value in comparing the measured ionic column densities with the grid of model predictions. The , associated with each of the velocity bins are free parameters, with all velocity bins constrained to have the same CNO abundances relative to H. The abundances are introduced into the fit via a linear scale factor of the metal ionic column densities predicted by the solar metallicity grid of models. This is possible since all the absorbers considered here are optically thin to the EUV ionizing radiation (i.e., the He ii ionization edge), thus the total ionic column densities scale simply with the abundances of their parent element. In each velocity bin, there are measurements of ionic column densities (up to four, depending on whether there is contamination or saturation present); the summation of these over velocity gives the total number of model constraints in each component. This gives 2 3 free parameters, to be modeled with constraints. The best-fit solution is then the set of velocity-dependent , values and the C, N, and O abundances that minimize from:
| (3) |
where the measured column density of the ion in the velocity bin is compared with the model column densities from the grid , is the scale factor relative to solar abundances, and the measurement uncertainty. For bins that are consistent with being saturated within noise limits (adopted to be 3), we set the upper to a large value to effectively treat these as lower limits to the column densities.


4.2. Abundance Solutions
We have fit each of components 1–3 individually with this method, as well as the combined absorption from all components (i.e., constraining all kinematic components to have the same abundances). The analysis indicates super-solar abundances in all kinematic components, with generally consistent results for each element in each component. The solutions for each component individually are [C/H]=0.6-0.7, [N/H]=1.1-1.2, [O/H]=0.5-0.7, given as the log of the abundance ratio to hydrogen relative to solar values. Thus C and O are enhanced by a factor of 3 – 5 relative to solar values, with additional overabundance of N consistent with scaling indicative of enhanced secondary production in massive stars (e.g., Hamann & Ferland, 1999, and references therein). These results can be compared with the study by Petitjean & Srianand (1999), who found qualitative evidence for enhanced [N/C], but no strong indication of supersolar C and O abundances based on their modeling. Figures 5 and 6 show the abundance solutions graphically for the independent fits to component 1 and components 2+3, respectively. This shows the 2-D (contour) projections of the 3-D volume for the CNO abundances. The minimum reduced value for the component 1 fit was 1.5, and for components 2+3 0.25. The low reduced value for components 2 and 3 may indicate the uncertainties derived in our column density fitting are overly conservative for these components. For each 2-D contour projection, the abundance of the other element was held fixed at its best-fit value.
4.3. Velocity-Dependent Solution
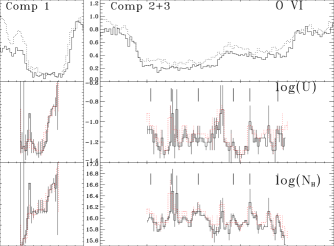
Figure 7 shows the solutions to and as a function of outflow velocity. The error bars represent values giving twice the minimum value from equation 3 with the abundances fixed at their best-fit values. Component 1 is seen to have fairly constant ionization structure (1.2) over the blue-wing, and through the core of the component. The total hydrogen column density increases from the outer wing, and levels off to a constant value over the central 50 km s-1 in the core of the profile. In the red-wing, the total column and ionization increase sharply towards lower outflow velocity. This can be seen in the absorption profiles, where O vi remains strong (saturated), while the other lines decrease. At 4770 km s-1, the ionization parameter has increased to log()0.4 and 1017 cm-2, and by 4750 km s-1, there are only lower limits on these parameters due to the very weak absorption in the lower ionization lines. This may be due to the superposition of two distinct physical components, or could represent real physical velocity-dependent structure in the flow. For components 2 and 3, the physical conditions in the absorbers are not strongly velocity-dependent, with 1.3 – 1.0. The total H column density does exhibit evidence for similar narrow substructure as the individual ionic column densities (§3), with 30% fluctuations. To test if this structure is an artificat of the solutions, in which strong fluctuations occur due to effects of large optical depths (near the saturation limit), we have also computed models after binning the initial spectra by a factor of two. These results are plotted as grey, dotted histograms on Figure 7 for comparison, showing that much of the narrow structure is present in these smoothed solutions.

We have generated synthetic absorption profiles for other lines observed in J2233 using the predicted ionic column densities from the photoionization model solutions and the covering factor solutions. These are shown in Figure 8 for key lines in the HST/STIS spectra and C iii 977 in the VLT/UVES spectrum. Given the limited S/N in the STIS E230M spectrum (N iv 765, O iv 787, and Ne viii 770) and the low-resolution of the O v 630 observation (G140L), it is difficult to derive strong conclusions from the HST observations; however, it is clear that the Ne viii is far underestimated by these models, requiring a higher ionization component as demonstrated in the analysis by Petitjean & Srianand (1999). A similar situation was found in the case of QSO PG 0946+301 from a detailed analysis of the highly constrained BAL by Arav et al. (2001a) - an additional high-ionization absorber coincident in velocity with the other UV lines was needed to reproduce the observed Ne viii absorption. The other lines in J2233 are consistent with the observations, with the possible exception of N iv 765 in component 2 which may be overestimated. The model predictions for C iii 977 are also seen to be consistent with the observations. Additionally, absorption from the Si IV 1393,1403 doublet is predicted to be negligible in these models and consistent with the tight upper limits on the Si IV column densities from the UVES spectrum (see Figure 1). We note that for the parameters derived here, these UV absorption systems will produce negligible X-ray warm absorber features.
4.4. High-Ionization Components 4 – 6
Here we derive constraints on components 4 – 6. With only O vi detectable in the UVES spectrum, there are not enough constraints to solve for the individual covering factors. However, comparison of the depths of the doublet members reveal the weak component 4 just redward of component 3 has low covering factor. Though uncertainties from the doublet solution are rather large for weak features like this (see Gabel et al., 2005a), it requires that the continuum source is only partially covered (i.e., even if the BLR is fully unocculted), with at least as low as the value derived for component 3. The effective covering factors for components 5 and 6 are larger, consistent with 0.8 – 1. We note that these solutions should be taken with caution due to possible contamination with the Ly forest, and with no other lines for confirmation.
To constrain the physical conditions in these absorbers, we measured O vi column densities using the doublet solution (Hamann et al., 1997), and derived upper limits on H i, N v, and C iv. This gives lower limits on , via photoionization modeling. The ionization in all three components is substantially higher than components 1 – 3. Adopting the abundances derived above for components 1 – 3 implies log() 0.25, 0, and 0.4 and log() 17.7, 18.4, 17 for components 4 – 6 respectively, but the values could be substantially greater. Upper limits on , come from the H i upper limit, giving log() 0.5, log() 19.7 for each component. Assuming the features in the Ne viii STIS spectrum are real for these components, the implied column densities are consistent with the upper range.
4.5. Implications of More Complex Absorption Scenarios
As described in §3.1, our solution to the absorption parameters (,) involved some simplifying assumptions. Specifically, we assumed: (1) the covering factors are identical for all ions (separately for the continuum and BLR sources), and (2) the absorption column density for each ionic species is uniformly distributed over the occulted fraction of the background emission (i.e., it is a perfect step-function in our sightline to the emission regions). We explore the implications of these assumptions in more detail below.
Ion-Dependent Covering Factors
The assumption that all ions have the same covering factors was invoked in our global fitting to increase the number of fitting constraints so that the individual continuum and BLR covering factors could be solved. The results from this fitting matched the observed profiles well overall (see Figure 4), indicating the assumption is not too far off. However, there are some discrepant regions in the fit which may signify a more complex absorption-emission geometry in the J2233 outflow; primarily, the absorption strength in the C iv blue (red) doublet member is systematically underestimated (overestimated) over the core region of component 1 and in some regions of component 2.
To explore this further, we have computed column densities and covering factors for each doublet/Ly-Ly pair individually using insight from our global fitting. Specifically, we fixed the continuum covering factor at the average value for each kinematic component from the global fitting ( 1, 0.92, 0.75 for components 1, 2, and 3 respectively; see Figure 2), and then solved for and separately for each ion line pair by applying analysis to equation 1. We believe this is the best approach to explore ion-dependent covering factors since the BLR is much larger than the UV continuum source, thus differences in covering factors between ions would most likely be due to affects of BLR coverage. For 1 uncertainties in these parameters, we adopted the maximum offsets from the best-fit solutions which give 2, since there are two lines being fit. Solutions can only be obtained at velocities where both members of the line pair are uncontaminated with other absorption. Bins that are saturated (we adopted 3) have only lower limits on their column densities. In Figure 3, we plot the column density profiles derived from this analysis. The primary differences of these solutions are that the C iv column density is somewhat larger in component 1 (and equivalently is lower), by up to 50%, and the associated 1 uncertainties for all ions are generally larger than in the global-fit solutions. Figure 3 shows that most of the narrow substructure in the optical depth profiles in components 2 and 3 described in §3.2 is still present in the individual ion solutions.
To test the potential affect of ion-dependent covering factors on our photoionization modeling results, we did the analysis described in §4.1 using the column densities derived individually for each ion in component 1 (most of components 2 and 3 have no solutions for either N v or H I due to contamination; see Figure 3). The results for the abundances are presented in Figure 5, showing the values as dotted contours. The carbon and nitrogen abundances derived from this model are about a factor of 1.5 times greater than the solutions using the global-fit column densities, whereas the oxygen abundance is similar. We note that since O vi is saturated over a large portion of the component 1 profile and thus has only lower limits on the column density, this may lead to an underestimate of the oxygen abundance.
Inhomogeneous Absorption
Another assumption we have made in our measurements is that the absorber is a perfectly homogeneous slab, with uniform column densities spanning the occulted portion of the background emission. More complicated distributions of outflow material, with a continous range of optical depths distributed with different covering factors (i.e., an inhomogeneous absorber), were first explored by de Kool et al. (2001). More recently, Arav et al. (2005, hereafter AK05) and Sabra & Hamann (2006, hereafter SH06) presented detailed analyses of inhomogeneous absorber (IA) distributions and their implications for observed absorption troughs. Results from these studies indicate inhomogeneous absorption will not have a large affect on our modeling results and conclusions for the outflow in J2233, as described below.
In AK05, it was shown that for lines from the same ionic level that have different optical depths (e.g., doublet line pairs or Lyman series lines), cases where the observed residual fluxes in the two line troughs are finite and equal in high S/N spectra (i.e., non-black saturation in the traditional partial coverage models), cannot be explained straightforwardly by IA models. Instead, they require a sharp edge in the distribution of absorber material, consistent with the homogeneous partial coverage model. Specifically, using simple functional forms for the absorber material (power-law and Gaussian distributions), AK05 showed that “shallow” distributions (i.e., power-laws with small spectral indices or Gaussians with relatively large parameters) cannot produce finite but equal residual fluxes for any conditions, and steep distributions require unrealistically high values for peak optical depths (see their Figures 2 and 3). The more general calculations of SH06, which allowed non-zero minimum bounds on the optical depth distribution, alleviated the peak requirements somewhat for cases of low residual fluxes. However, even for these calculations, there is no way to obtain an absorption profile for a single line pair that gives equal residual fluxes at some velocities but different fluxes at others unless the functional form of the distribution of material is velocity-dependent across the component (e.g., see the models with 0.9 for the HPC models in Table 1 of SH06). This is precisely the case observed in the troughs of J2233, for example in O VI and N V in component 1. Such a situation seems physically implausible. Thus we conclude that the IA models as presented in the detailed studies of AK05 and SH06 do not provide a natural interpretation for the J2233 outflow.
Finally, we note SH06 have shown that even for cases where inhomogeneous absorption does apply, the mean optical depths derived by assuming homogeneous partial coverage are very similar to the mean values for IA distributions for most cases (they diverge somewhat for strongly peaked distributions). Thus, the solutions from the homogeneous partial covering analysis are generally representative of the inhomogenous distributions (for cases that are not saturated), once the mean optical depths are accounted for by averaging over the unocculted and occulted regions. It has yet to be shown, however, the implications for photoionization models which are done assuming a slab of uniform column density.
5. Implications for the Global Nature of the J2233 AGN Outflow
Here we synthesize the above results on the kinematics, geometry, ionization, and abundances to explore the global nature of the outflow in J2233.
5.1. Chemical Enrichment
Determining abundances in quasar outflow systems serves as a probe of the chemical evolution of the universe, with implications for the timing and mechanisms for nucleosynthesis and distribution of metals on galactic and intergalactic scales. Analysis of intrinsic narrow absorption-line systems provides the best means for probing the abundances of QSO environments: BAL lines are typically heavily saturated and blended preventing determination of ionic column densities, whereas observed emission-lines sample the integrated flux over a large spatial region, and thus likely sample a large range of physical conditions. Evidence for near-solar or super-solar abundances has been found in associated absorbers in several other high redshift ( 2–4) QSOs (see references in Hamann & Ferland, 1999; D’Odorico et al., 2004), although this is often not definitive due to limited quality of spectra. Additionally, linking these results to QSO outflows is uncertain in many cases since they lack other properties that would indicate the absorbers are intrinsic to the AGN.
As shown in §4.2 and Figures 5 and 6, all three outflow components in J2233 with available fitting constraints have supersolar abundances, with enhanced N enrichment: 3–5 for C and O, and N/H scaling roughly as . The similarity in results derived independently in each kinematic component gives strong support for this finding. Additionally, the enhanced N abundance relative to C and O supports the general finding of high abundances in the absorbers, since secondary CNO nucleosynthesis becomes important after the system has reached near solar metallicity, based on observations and chemical enrichment simulations (e.g., Hamann & Ferland, 1993; Vila-Costas & Edmunds, 1993). The advanced chemical processing implied by our detailed fitting indicates the host galaxy of J2233 underwent vigorous star formation at an early epoch, before 2.2. Given the finding of high metallicity in associated absorbers in other bright, distant QSOs, this supports the evolutionary scenario in which massive galactic nuclei undergo rapid, extensive star formation at early times, with most chemical enrichment occurring before at least 2–3 (Hamann & Ferland, 1999, and references therein). A subsequent or coeval QSO phase may then distribute the enriched gas to the host galaxy, and possibly IGM, via an outflow. The finding of distances of AGN outflows from the nucleus on kpc scales or greater (de Kool et al., 2001; Hamann et al., 2001) supports this general model that QSO winds can seed their environments with metals.
5.2. Kinematic-Geometric-Ionization Structure
The detailed results of our absorption fitting and modeling reveal correlations in the kinematic, geometric, and ionization structure in the J2233 outflow. For example, our analysis in §3 (Figure 3) shows the covering factors of the individual kinematic components with low-ionization absorption are correlated with outflow velocity. To summarize, the highest velocity absorber, component 1, fully occults the continuum source and covers 60% of the BLR, component 2 is consistent with full continuum coverage but little or no BLR coverage, while component 3 only partially occults the continuum source (70%).
One interpretation of this trend is that the absorption region size increases with outflow velocity, at least as projected on the sky against the background AGN emission (i.e., in the transverse dimension, ). If the absorbers in our sightline to the nuclear emission have a uniform density filling their entire volumes (i.e., filling factor 1), e.g., if each component is a single “cloud” or continuous flow region, then the expression relating the H column density to the volume density and radial thickness of the absorber is . Since the integrated for the low-ionization regions are similar for components 2 and 3 and somewhat greater for component 1, if the radial dimensions of the absorbers follow the same trend as the transverse sizes in the scenario described above (e.g., for a cloud-like geometry), then the volume densities decrease with outflow velocity. Furthermore, the similarity in ionization parameter for the low-ionization material in each component (§4, Figure 7) implies their products are similar via the expression for given in §4.1. Combining these results would imply a correlation between outflow velocity and for the components in J2233 if all of the above assumptions apply. Qualitatively, this result is consistent with the predictions from dynamical models which have continuous acceleration of a radial outflow. Another interpretation of the correlation is that outflow regions with higher velocity have moved further across our sightline to the emission sources.
5.2.1 Geometric Constraints
The distance of the absorber from the central ionizing source () has important implications for assessing the total energy and mass flux associated with the outflow. The most direct and accurate way of determining is by measurement of the volume density in the absorbers, , from excited level absorption (e.g., de Kool et al., 2001, 2002b, 2002c; Gabel et al., 2005b), but the presence of these diagnostic lines in AGN outflows is rare. They are not detectable in the spectrum of J2233 within the noise limits; this is due to the relatively low-ionization of the species giving excited level UV absorption (e.g., Si ii* 1260, C ii* 1336, C iii* 1175) compared with the ionization state of the outflow. However limits on and the geometrical structure of the outflow can still be explored based on indirect arguments involving other measurable quantities.
For example, if the filling factors of the absorbers are unity as described above, then combining the expressions for and the ionization parameter (§4.1) following Turner et al. (1993) gives the geometrical parameters and in terms of the parameters derived from photoionization models, the H-ionizing photon flux, and constants:
| (4) |
The photon flux can be estimated from the luminosity distance to J2233 (20 Gpc for 71 km s-1 Mpc-1, 0.27, 0.73; Spergel et al., 2003) and integration of our model SED over the ionizing continuum, giving 31057 s-1.
We can use the covering factors derived for the BLR (§3) and the size of the BLR to constrain the projected transverse size () of the absorption regions in our sightline to the background AGN emission. Using the relation (; e.g., Wandel et al., 1999), this gives 1 pc for component 1 (0.5), and smaller for components 2 and 3 (0). If the radial sizes of the absorption regions are similar to these limits on the transverse sizes, , consistent with a cloud-like geometry, then equation 4 implies 50 kpc if the filling factor of the absorbing medium is unity. This large distance seems improbable, requiring the presence of extremely small structure relative to its distance from the nucleus, with just the right line-of-sight geometry to partially cover the AGN emission. However, similar results have been implied in analysis of other QSO outflows (e.g., Hamann et al., 2001). Alternatively, if the outflow has a thin shell geometry (), it could be considerably closer in to the nucleus; this model was adopted by Steenbrugge et al. (2005), for example, to explain the X-ray absorption in NGC 5548. Another alternative is that the volume filling factor of the absorption material in our line-of-sight is small (i.e., it is highly clumpy). In this case, the effective radial thickness of the absorber is proportional to , placing the outflow closer to the nucleus for a given : ratio. We note that very low volume filling factors appear to be a generic feature of QSO outflows seen in the UV, and its implications and requirements on dynamical models was recognized early on in the study of these systems (e.g., Weymann et al., 1985; Arav et al., 1994).
5.2.2 Narrow Kinematic Substructure and Velocity-Dependent Ionization
An interesting feature of the outflow in J2233 is the prevalence of narrow kinematic structure seen in the absorbers. This is directly apparent in the clustering of distinct kinematic components 2 – 6, which combine at adjacent velocities to give continuous absorption over 500 km s-1. Also, the detailed fitting and modeling in §3 and 4 revealed the relatively broad component 2 and 3 absorbers are comprised of a series of narrow peaks in column density ( 25 – 50 km s-1). Further, component 1 shows strong velocity-dependent ionization differences: the red-wing is of significantly higher ionization, with saturated O vi absorption and weak or negligible absorption from lower-ionization species. This may be interpreted as the superposition of two physically distinct components, partially overlapping in velocity space.
Similar clustering in velocity of multiple, relatively narrow components is commonly seen in QSO outflows. For example, many BALQSOs show narrow substructure in some of the weaker lines coinciding in velocity with or adjacent to the broad troughs (e.g., Voit et al., 1993; Arav et al., 1999; de Kool et al., 2001; Arav et al., 2001b). In a recent multi-epoch study of QSO HS 1603+3820, Misawa et al. (2005) found a cluster of partially overlapping narrow components had become deeper and more blended, appearing almost as a BAL trough. These results indicate we are seeing a number of distinct absorption regions in our line-of-sight to the AGN emission, either different stream lines associated with continuous outflows or distinct clouds. Perhaps there is a continuous distribution of absorption widths associated with AGN outflows, ranging from the narrow components seen in J2233 to the classical BAL troughs, with the observed width related to the details of the outflow mechanism or orientation of our sightline to the nucleus. The clustering in velocity suggests the distinct regions are related, possibly determined by the details of their origin or driving mechanism. It is interesting that the low-ionization component 1 and 3 absorbers in J2233 both have higher ionization absorption at adjacent, lower outflow velocities. Similar structure was seen in the QSO 2359-1241 absorber, and was taken as evidence for ionization stratification in a disk wind by Arav et al. (2001b). In contrast, Voit et al. (1993) found some objects show the opposite trend, with low-ionization absorption coinciding in velocity with the low-velocity region of BAL troughs.
6. Summary
We have presented a detailed analysis of the intrinsic UV absorption in the central HDFS target, QSO J2233-606. Our analysis is based on a high-resolution ( 30,000 - 50,000), high S/N ( 25 – 50) spectrum obtained with VLT/UVES. This spectrum samples the cluster of intrinsic absorption systems outflowing from the AGN at radial velocities 5000 – 3800 km s-1 in the lithium-like CNO doublets and H i Lyman series lines, which serve as key diagnostics to determine the covering factors, column densities, ionization state, and abundances of the outflow.
We fit the absorption troughs as a function of radial velocity using a geometric model which assumes independent line-of-sight covering factors for the individual background emission sources (continuum and emission-line) and the same covering factors for all ions. The solution reveals:
-
1.
There is a trend of increasing covering factor for components with greater outflow velocity: component 1 at 4950 km s-1 occults the entire continuum source and 55% of the BLR; component 2 at 4150 km s-1 covers the continuum source, but little or none of the BLR; component 3 at 3950 km s-1 only partially covers the continuum source (70%).
-
2.
Narrow kinematic substructure in the ionic column densities is prevalent. The red-wing of component 1 is highly ionized, having saturated O vi and weak absorption from lower ionization species compared with the core of this component. Components 2 and 3 break down into a series of subpeaks in , seen consistently in the solutions to different ions.
We performed detailed photoionization modeling to determine the metal abundances and physical conditions in the absorbers. Ionic column densities were simultaneously fit for all velocities of each component by constraining the abundances in each velocity bin to be the same. This technique greatly increased the number of modeling constraints, allowing a fit to the individual elemental abundances of C, N, and O relative to H, as well as the velocity-dependent ionization parameter and total column density. Our analysis shows:
-
1.
All absorption components have supersolar metal abundances, with [C/H] and [O/H] 0.5 – 0.9, and [N/H] 1.2. This is consistent with the Z2 scaling of N predicted from secondary CNO nucleosynthesis. Consistent results are found for independent fits to each component individually.
-
2.
The lowest ionization material in each of components 1 – 3 has similar ionization (log() 1.2). Higher ionization gas is required at the same velocities to account for the Ne viii absorption, as shown also by Petitjean & Srianand (1999). The redwing of component 1, and components 4 – 6 which lie just redward of of component 3, have ionization parameters at least 5 – 10 times greater than the low-ionization component 1 – 3 gas.
We are grateful to the ESO Archive for providing public access to data obtained with VLT/UVES. Support for this work was provided by NASA through grants AR-09536.08-A and NAG5-12867. We thank G. Ferland for making his photoionization code Cloudy publicly available and C. Markwardt for providing access to his optimization software. We also thank the referee for insightful comments that lead to an improved paper.
References
- Arav et al. (2005) Arav, N., et al. 2005, ApJ, 620, 665
- Arav et al. (2001a) Arav, N., et al. 2001, ApJ, 561, 118
- Arav et al. (2001b) Arav, N., et al. 2001b, ApJ, 546, 140
- Arav et al. (1999) Arav, N., Becker, R. H., Laurent-Muehleisen, S. A., Gregg, M. D., White, R. L., Brotherton, M. S., & de Kool, M. 1999, ApJ, 524, 566
- Arav et al. (1994) Arav, N., Li, Z.-Y., & Begleman, M. C. 1994, ApJ, 432, 62
- Barlow & Sargent (1997) Barlow, T. A., & Sargent, W. L. W. 1997, AJ, 113, 136
- Bevington (1969) Bevington, P. R. 1969, Data Reduction and Error Analysis for the Physical Sciences, pp 242-245
- Blandford & Begelman (2004) Blandford, R, D., & Begelman, M. C. 2004, MNRAS, 349, 68
- Blandford & Begelman (1999) Blandford, R, D., & Begelman, M. C. 1999, MNRAS, 303, L1
- Cavaliere, Lapi, & Menci (2002) Cavaliere, A., Lapi, A., & Menci, N., 2002, ApJ, 581, L1
- Cristiani & D’Odorico (2000) Cristiani, S. & D’Odorico, V. 2000, AJ, 120, 1648
- D’Odorico et al. (2004) D’Odorico, V., Cristiani, S., Donatella, R., Granato, G. L., Danese, L. 2004, MNRAS, 351, 976
- de Kool et al. (2002a) de Kool, M., Korista, K. T., & Arav, N. 2002, ApJ, 580, 54
- de Kool et al. (2002b) de Kool, M., Becker, R. H., Arav, N., Gregg, M. D., & White, R. L. 2002, ApJ, 570, 514
- de Kool et al. (2002c) de Kool, M., Becker, R. H., Gregg, M. D., White, R. L., & Arav, N. 2002, ApJ, 567, 58
- de Kool et al. (2001) de Kool, M., Arav, N., Becker, R., Laurent-Muehleisen, S. A., White, R. L., Price, T., Gregg, M. D. 2001, ApJ, 548, 609
- de Kool & Begelman (1995) de Kool, M. & Begelman, M. C. 1995, ApJ, 455, 448
- Ferguson (1998) Ferguson, H. C. 1998, Space Telescope Science Institute Newletter Vol. 15, No. 3, 6
- Ferland et al. (1998) Ferland, G. J., Korista, K. T., Verner, D. A., Ferguson, J. W., Kingdon, J. B., & Verner, E. M. 1998, PASP, 110, 761
- Furlanetto & Loeb (2001) Furlanetto, S. R. & Loeb, A. 2001, ApJ, 556, 619
- Gabel et al. (2005a) Gabel, J. R., et al. 2005, ApJ, 623, 85
- Gabel et al. (2005b) Gabel, J. R., et al. 2005, ApJ, 631, 741
- Gabel et al. (2003) Gabel, J. R., et al. 2003a, ApJ, 583, 178
- Ganguly et al. (1999) Ganguly, R., Eracleous, M., Charlton, J. C., & Churchill, C. W. 1999, AJ, 117, 2594
- Grevesse & Anders (1989) Grevesse, N. & Anders, E. 1989 in Cosmic Abundances of Matter, ed. C. J. Waddington (New York: AIP), 1
- Hamann et al. (2001) Hamann, F. W., Barlow, T. A., Chaffee, F. C., Foltz, C. B., & Weymann, R. J. 2001, ApJ, 550, 142
- Hamann & Ferland (1999) Hamann, F. & Ferland, G. 1999, ARA&A, 37, 487
- Hamann et al. (1997) Hamann, F., Barlow, T. A., Junkkarinen, V., & Burbidge, E. M. 1997, ApJ, 478, 80
- Hamann & Ferland (1993) Hamann, F. & Ferland, G. 1993, ApJ, 418, 11
- Hewett & Foltz (2003) Hewett, P. C., & Foltz, C. B. 2003, AJ, 125, 1784
- Kim et al. (2001) Kim, T.-S., Cristiani, S., & D’Odorico, S. 2001, A&A, 373, 757
- Laor (1999) Laor, A. 1999, in ASP Conf. Ser. 162, Quasars and Cosmology, ed. G. Ferland & J. Baldwin (San Francisco: ASP), 55
- Misawa et al. (2005) Misawa, T., et al. 2005, ApJ, 629, 115
- Outram et al. (1999) Outram, P. J., et al. 1999, MNRAS, 305, 685
- Petitjean & Srianand (1999) Petitjean, P. & Srianand, R. 1999, A&A, 345, 73
- Prochaska & Burles (1999) Prochaska, J. X. & Burles, S. M. 1999, AJ, 117, 1957
- Sabra & Hamann (2006) Sabra, B. & Hamann, F. 2006, ApJ, in press
- Savaglio (1998) Savaglio, S. 1998, AJ, 116, 1055
- Scannapieco & Oh (2004) Scannapieco, E., & Oh, S. P., 2004, ApJ, 608, 62
- Sealey et al. (1998) Sealey, M. K., Drinkwater, J. M., Webb, J. K. 1998, ApJ, 499, L135
- Silk & Rees (1998) Silk, J., & Rees, M. J., 1998, A&A 331, L1S
- Spergel et al. (2003) Spergel, D. N., et al. 2003, ApJS, 148, 175
- Steenbrugge et al. (2005) Steenbrugge, K. C., et al. 2005, A&A, 569, 584
- Turner et al. (1993) Turner, T. J., Nandra, K., George, I. M., Fabian, A. C., & Pounds, K. A. 1993, ApJ, 419, 127
- Vila-Costas & Edmunds (1993) Vila-Costas, M. B. & Edmunds, M. G. 1993, MNRAS, 265, 199
- Voit et al. (1993) Voit, G. M., Weymann, R. J., & Korista, K. T. 1993, ApJ, 413, 95
- Wandel et al. (1999) Wandel, A., Peterson, B. M., & Malkan, M. A. 1999, ApJ, 526, 579
- Weymann et al. (1985) Weymann, R. J., Turnshek, D. A., & Christiansen, W. A. 1985, in Astrophysics of Active Galaxies and Quasi-stellar Objects, ed. J. Miller (Oxford: Oxford Univ. Press), 333
- Whilhite et al. (2005) Whilhite, B. C., et al. 2005, ApJ, 633, 638
- Wyithe & Loeb (2003) Wyithe, S. J. B., & Loeb, A., 2003, ApJ, 595, 614