Host Galaxies of Hard X-ray Selected Type-2 Active Galactic Nuclei at Intermediate Redshifts11affiliation: Based on observations made with the University of Hawaii 2.2 m telescope.
Abstract
We study properties of the host galaxies of 15 hard X-ray selected type-2 active galactic nuclei (AGNs) at intermediate redshifts (0.050.6) detected in surveys. The absorption corrected hard X-ray luminosities range from 1042 erg s-1 to erg s-1. We took the -band image of these AGNs with the University of Hawaii 2.2 m telescope. Thanks to the intrinsic obscuration of nuclear light, we can decompose the galaxies with a spheroid component and a disk component. The resulting spheroid luminosities correlate with ; higher (lower) X-ray luminosity AGNs tend to reside in luminous (less luminous) spheroids. It is also found that the hosts of luminous AGNs show a large spheroid-to-disk luminosity ratio (1), while those of less luminous AGNs spread between 0 and 1. The correlation between and spheroid luminosity indicates that the relation between mass of a supermassive black hole (SMBH) and spheroid luminosity (BS-relation) at the intermediate redshifts. BS-relation agrees with that in the local universe, if the Eddington ratio of 0.24 is adopted, which is a mean value determined from our type-1 AGN sample at similar redshifts through the broad-line width and continuum luminosity. The present study demonstrates the effectiveness of using type-2 AGNs at high redshifts to study their host properties.
1 Introduction
It is now widely accepted that masses of supermassive black holes (SMBHs) located at the centers of galaxies correlate with spheroid (bulge) luminosities (or masses) of the host galaxies very tightly (hereafter we call it “BS-relation”; e.g., Kormendy and Richstone 1995; Magorrian et al. 1998; Ferrarese & Merritt 2000; Gebhardt et al. 2000; Marconi & Hunt 2003). The tightness of the BS-relation suggests an evolutional link between SMBHs and their spheroid components of the hosts. Marconi et al. (2004) and Shankar et al. (2004) showed that a local black hole mass function derived from a spheroid luminosity function by using the BS-relation agrees with that expected from AGN relics estimated from the history of mass accretion onto BHs during AGN phases. This suggests that all local spheroids (bulges) have central BHs and have experienced an AGN phase (or phases) during its life. Marconi et al. (2004) also suggested that the cosmic mass accretion history onto BHs has a similar redshift dependence to the cosmic star formation rate history, indicating that the mass accretion rate onto a SMBH is proportional to the star formation rate in terms of cosmological time scale. These results suggest the co-evolution of SMBHs and spheroids of host galaxies.
Using a highly complete hard X-ray selected AGN sample, Ueda et al. (2003) revealed that the comoving number density of AGNs with high X-ray luminosities shows a peak at higher redshift than that of low X-ray luminosity ones. This indicates “anti-hierarchical” or “down-sizing” nature of AGN evolution. More recently, the same tendency has been confirmed both in a study of soft X-ray selected type-1 AGNs (Hasinger et al. 2005) and that of hard X-ray selected AGNs (La Franca et al. 2005). Hard X-ray luminosities represent masses of central SMBHs if the ratio of the X-ray luminosity to the Eddington luminosity (Eddington ratio) is constant. From the co-evolution scenario of SMBHs and spheroids, it is thus suggested that low X-ray luminosity AGNs reside in late-type galaxies having a small spheroid component, while high X-ray luminosity AGNs reside in early-type galaxies having a luminous spheroid. If this is the case, the number density evolution of AGNs indicates that more massive spheroid galaxies and BHs both formed at earlier epoch.
A direct approach to examine the co-evolution of SMBHs and spheroids is to determine BS-relation at and compare it with the local relation. Host galaxies of type-1 AGNs have been studied extensively (e.g., Sanchez et al. 2004; Jahnke et al. 2004). It is not easy, however, to examine morphologies and luminosities of host galaxies, particularly of their spheroid (bulge) components, because the presence of a dazzling nucleus prevents us from examining a host galaxy precisely. Meanwhile, type-2 AGNs make a suitable sample to study structure of host galaxies thanks to its intrinsic obscuration of a bright nucleus. According to the AGN unification model, type-1 and type-2 AGNs are intrinsically the same population; the only difference is the viewing angle to a nucleus surrounded by dusty obscuring material. Hence, examining the properties of the host galaxies of type-2 AGNs should be useful for understanding those of the whole AGN population.
However, since previous AGN surveys were mainly conducted in UV/optical or soft X-ray bands, detection of obscured AGNs (type-2 AGNs) has been difficult due to extinction and absorption. Hard X-ray surveys have much less bias against obscured AGNs. Akiyama et al. (2000) and Akiyama et al. (2003) completed optical follow-up observations of hard X-ray sources detected with at a flux limit of erg cm-2 s-1 (2–10 keV), providing us with a unique type-2 AGN sample at intermediate redshifts (). In this paper, we use this type-2 AGN sample to examine the relation between X-ray luminosity, spheroid luminosity, and bulge-to-total luminosity ratio (B/T ratio).
The sequence of the article is as follows. In Section 2 we describe the sample used in the analysis. The observation and data reduction are summarized in Section 3. In Section 4, we explain the procedure of two-dimensional surface brightness fitting. The results are presented in Section 5, and summary is given in Section 6. Throughout this paper, we adopt a cosmological parameter set of km s-1 Mpc-1, , and , and the Vega system for magnitudes unless otherwise noted.
2 Sample
We utilize two hard X-ray ( keV) selected samples, the Large Sky Survey (ALSS) and Medium Sensitivity Survey in the northern sky (AMSSn). The ALSS covers a contiguous area of 5 deg2 near the north Galactic pole with the flux limit of about 10-13 erg s-1 cm-2 in the 2–10 keV band (Ueda et al. 1999). Thirty-four sources were detected above 2 keV with the Solid-state Imaging Spectrometer, among which 33 sources were optically identified into 30 AGNs, 2 clusters of galaxies, and 1 Galactic star (Akiyama et al. 2000). The AMSSn is a serendipitous source survey with the Gas Imaging Spectrometer (Ueda et al. 2001). From a survey area of 70 deg2 with a flux limit of 10-13 erg s-1 cm-2 (2–10 keV), all but one of 87 hard X-ray selected sources were identified with 78 AGNs, 7 clusters, and 1 Galactic object (Akiyama et al. 2003). Because these AGNs are selected in the hard X-ray band, they are not biased to unabsorbed AGNs, except for Compton thick AGNs. It is worth emphasizing that the completeness of the sample is almost 100%, and hence we can make a statistically fair sample of AGNs at intermediate redshifts.
For our study, we select only type-2 AGNs from the identified sources. The definition of “type-2” AGNs we adopt is the ordinary criteria; neither H nor H broad emission lines are seen in the optical spectrum. Two objects (NE04 and NO53) are included to our sample based only on the absence of the H broad emission lines, because their H emission line is not covered in the optical spectra taken. Although the absence of broad line(s) could depend on the signal-to-noise ratio, we confirm that these AGNs show absorption of cm-2 in the X-ray band, thus supporting their identification as type-2 AGNs. We do not include X-ray absorbed “type-1” AGNs (i.e., with optical broad emission lines), which tend to have a bright nucleus in the optical band. The number of the total type-2 AGNs obtained from the ALSS and AMSSn is 15. The basic properties of the sample are summarized in Table Host Galaxies of Hard X-ray Selected Type-2 Active Galactic Nuclei at Intermediate Redshifts11affiliation: Based on observations made with the University of Hawaii 2.2 m telescope.. The -band magnitude ranges between 14.8–20.6 mag, and the absorption-corrected X-ray luminosity ranges from 1042.7 erg s-1 to 1044.8 erg s-1 (2–10 keV). Their redshifts distribute from 0.05 to 0.6 with a median redshift of 0.22. Figure 1 shows the plot of X-ray luminosity against redshift for this sample.
The possible contribution from a nuclear point source (via direct light and/or scattered light from the nucleus) is negligible in the optical band in our sample. A part of the sources show Mg5175, Ca H , and Ca K absorption lines in the spectra, indicating that the optical luminosity is likely to be dominated by stars in the host galaxy. Furthermore, 10 objects in this sample have photometric data from the Sloan Digital Sky Survey (SDSS), by which we can examine their spectral energy distribution (SEDs). Figure 2 shows typical examples of the resultant SEDs. These SEDs are similar to that of elliptical or Sbc galaxies, suggesting that the contribution from a nuclear component is small. To evaluate this quantitatively, we fit the SEDs with a combined spectral model of a galaxy and an AGN. Here we use three template spectra of Elliptical, Sbc, and Scd (Coleman, Wu, & Weedman 1980) to reproduce the host galaxy spectra, and a mean QSO spectrum by Elvis et al. (1994) to reproduce the nucleus spectrum with AV = 0–30 mag by employing the extinction curve of Milky Way (Allen 1996). The fitting results are also shown in Figure 2; the contribution from the nucleus is less than 10% at -band. Small nuclear contribution (%) is also confirmed for the other objects that have SDSS photometric data.
3 Observations and Data Reductions
Optical imaging observations were made during the period from 2004 April 16 to April 19 and on December 10 with the Orthogonal Parallel Transfer Imaging Camera (OPTIC, Tonry et al. 2004) attached to the University of Hawaii 2.2 m (UH88) telescope. The OPTIC can compensate for real time image motion by moving collected charges in the CCD array in response to on-chip guide stars. One pixel corresponded to 0′′.14, giving a field of view of arcmin2. In the April observing run, about 20 targets were observed. The integration time of each frame was 600s–900s in -band and the total exposure time was 600s–1800s. The typical seeing size (FWHM) was 1′′.5, and the sky condition was not photometric. In the December observing run, we observed one target. The integration time of each frame was 600s in -band and the total exposure time was 1800s. The typical seeing size was 0′′.8. The sky condition was photometric, and Landolt standard stars were also observed for the photometric calibration. Since the observing conditions for the spring run were bad, we again made observations on 2005 May 12 and 13 at UH88 with Tek2048 CCD to obtain images of most of the spring targets. One pixel of this CCD corresponded to 0′′.22, giving a field of view of 7.57.5 arcmin2. The integration time of each frame was 600s900s in -band, and the total exposure time was 600s–1800s. The typical seeing size was 0′′.8 during the observations. Since the sky condition was photometric on the first night, we observed standard stars on that day. A journal of the observations is given in Table Host Galaxies of Hard X-ray Selected Type-2 Active Galactic Nuclei at Intermediate Redshifts11affiliation: Based on observations made with the University of Hawaii 2.2 m telescope..
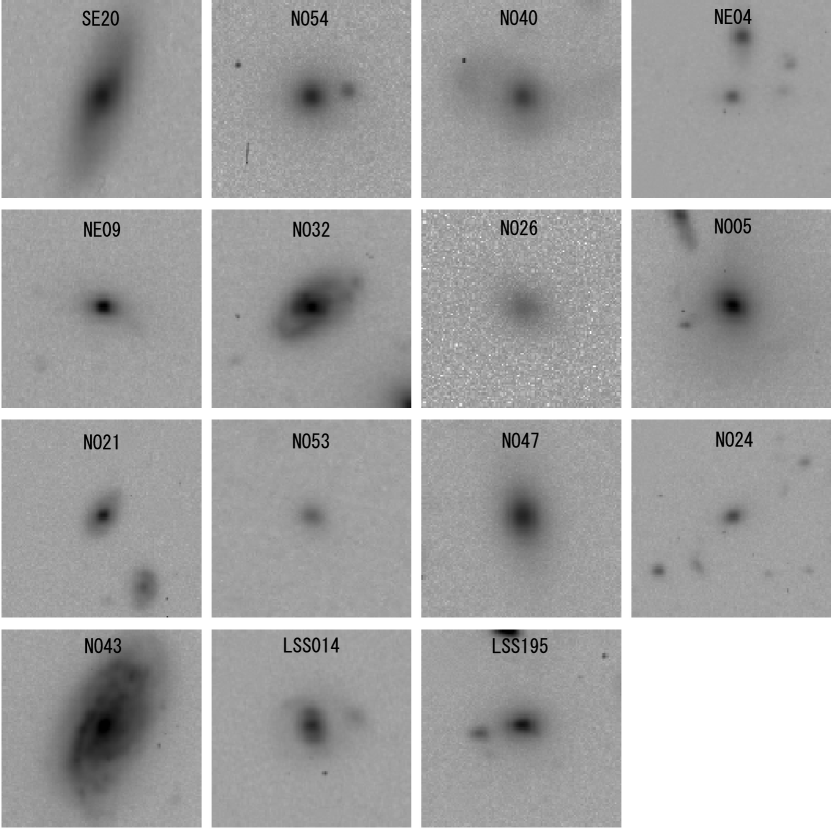
We reduced the data taken with the OPTIC by standard procedure except for flat fielding, for which we created custom flat fields by convolving the average dome flat frames with a shift pattern of charges in each exposure. For the reduction of the data taken with Tek 2048, we took standard procedure. We subtracted bias values estimated with a median of the overscan region. Bias-subtracted object frames were divided by flat frame, which was taken from a median frame of normalized dome flat frames. A sky background was determined as the mode value of 300 pixels 300 pixels around a target, and was subtracted from the image. By using the positions of bright stars in a frame, 1–3 frames for each target with a small offset were scaled and combined into one frame by taking a median value. The resulting images of the targets are shown in Figure 3.
Photometric calibration was made for the data taken in 2004 December and 2005 May. The photometry of standard stars was performed with the “PHOT” task in the IRAF package111IRAF is distributed by the National Optical Astronomy Observatory, which is operated by the Association of Universities for Research in Astronomy, Inc. (AURA), under cooperative agreement with the National Science Foundation.. After examining the growth curve of the targets, we set an aperture size to three times the FWHM of each object, which is appropriate to derive the total magnitude by avoiding contamination from nearby objects. The uncertainty of the obtained zero point of magnitude is 0.03 mag. For the objects for which SDSS data are available, we calculate the -band magnitudes from the SDSS -band magnitudes by using the transformation in the SDSS web page222http://www.sdss.org/dr4/algorithms/sdssUBVRITransform.html#Lupton2005, i.e.,
| (1) |
where the last term 0.212 corresponds to the AB magnitude of Lyrae at the band. We confirm that the -band magnitudes converted from the SDSS data agree with our photometric results within 0.2 mag. For the remainder objects, we adopt -band magnitudes given by Akiyama et al. (2003) and Watanabe et al. (2004); these values were derived by converting and magnitudes in the APM catalog into and magnitudes. The -band magnitudes obtained in this way are summarized in Table Host Galaxies of Hard X-ray Selected Type-2 Active Galactic Nuclei at Intermediate Redshifts11affiliation: Based on observations made with the University of Hawaii 2.2 m telescope.. Finally, we derived K-corrected absolute -band magnitudes using model spectra fitted to SEDs for the objects for which SDSS data are available, and the Sbc template spectrum for the remainders. The resultant absolute magnitudes are also listed in Table Host Galaxies of Hard X-ray Selected Type-2 Active Galactic Nuclei at Intermediate Redshifts11affiliation: Based on observations made with the University of Hawaii 2.2 m telescope..
4 Surface Brightness Fitting
We performed two-dimensional fitting to the -band images to determine spheroid (bulge) and disk luminosities by using the “GALFIT” program (ver 2.0.3, Peng et al. 2002). The model consists of three components, a de Vaucouleurs spheroid (bulge), an exponential disk, and a nuclear point-like component which may be present even in type-2 AGNs. A point spread function (PSF) was constructed by stacking stellar images of 1–3 bright (but not saturated) stars in the same image that contains the AGN, and is used as the nuclear component. The model of the spheroid and disk components are convolved with this PSF to incorporate the seeing effect. The fitting parameters are a position that is common for the three components, magnitudes of each component, scale lengths, ellipticities, and position angles for the spheroid and disk components.
To search for the best-fit parameters, we employed the least square method. Considering possible systematic errors, we set a constant fractional error in each pixel regardless of the photon counts. Objects close to the target, if any, were masked out. To converge the fit efficiently, we took two steps. First, we derived a position, a total magnitude, an ellipticity, and a position angle of a target galaxy, by using the IMEXAM task in IRAF, to be used as initial parameters. We set 1 kpc and 3 kpc for the scale length of a spheroid and a disk, respectively, and a B/T ratio of 0.5. With this initial guess, fitting was performed without a nuclear component, since the nuclear luminosity can be regarded to be small compared with the host galaxy luminosity as zeroth-order approximation. In the second step, we iterate the fitting by including a nuclear component, whose flux was initially set to be 10% of the total flux.
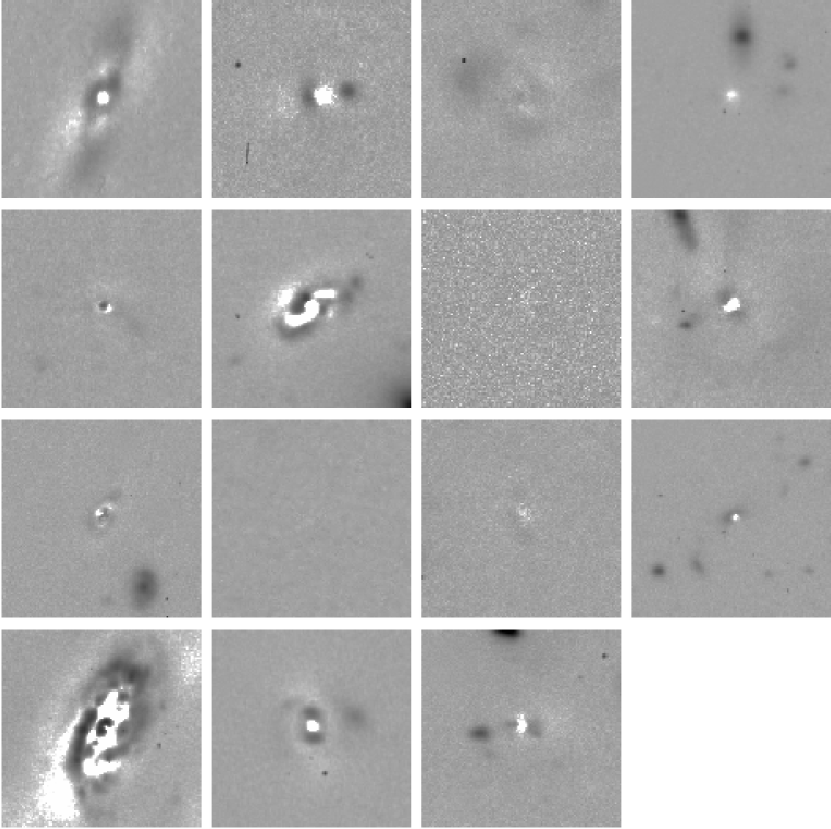
The obtained best-fit parameters are summarized in Table 2. Figure 4 shows the radial surface-brightness profile together with the best-fit model. We note that NO26 is not clearly decomposed to a spheroid and a disk component because of the large seeing size. The residual images of the fitting are shown in Figure 5. Asymmetric structures, such as a bar or an arm, are seen in some objects. Some objects show a hint for the presence of companions. Since no redshift data are available for them, however, the physical relation is not certain.
We performed simulation to confirm the robustness of our results and to evaluate the uncertainties in the best-fit parameters. For each object, we produced simulated images of the galaxy consisting of the three components, a spheroid, a disk, and a nucleus, assuming the best-fit parameters. The images were convolved with the same point spread function as the actual observations. The background was taken from a blank sky region in the observed image. By adding Poisson noise in the photon counts, we produced 50 simulated images per object with different random numbers. Also, to evaluate possible systematic errors caused by the complexity in the background, we repeated the simulation by selecting other blank sky regions in the observed image. Then, we performed image fitting to the simulated images according to the same procedure applied to the actual data, and compared the output parameters with the input values. The distribution of the output parameters give us an estimate of the uncertainty in the parameters including both statistical and systematic errors.
Based on this study, we conservatively estimate the uncertainties in the spheroid magnitude to be 0.2 mag for most of the objects. The objects NO43 and NO26 show larger errors, 0.5 mag and 0.3 mag, respectively. This is because NO43 has a very weak spheroid component compared with the disk component, making the coupling from the nuclear component quite significant. As mentioned above, the seeing condition of NO26 was extremely poor (1′′.5), which causes similar difficulty in separating different galactic components. The uncertainties of the B/T ratio are found to be 0.1 for NO26, and 0.05 for the rest (NO43 is a disk dominated object, hence error of its B/T ratio is small). We take into account these uncertainties in the following discussions.
5 Relation between the AGN and Host Properties
5.1 Correlation between X-ray luminosity and spheroid luminosity
In Figure 6 we plot the absolute magnitudes of spheroid components against absorption-corrected X-ray luminosities in the rest-frame 2–10 keV band. As seen from the figure, the absolute magnitudes correlate with the hard X-ray luminosities; i.e., high (low) X-ray luminosity AGNs reside in more (less) luminous spheroid components. If we assume that the Eddington ratio is constant, this correlation indicates the presence of a BS-relation at similar to that in the local universe. The mass of a SMBH, , can be derived from the X-ray luminosity as
| (2) |
where is the Eddington ratio and is a bolometric correction factor, for which we adopt 30 from a mean spectrum of quasars compiled by Elvis et al. (1994).
To estimate , we utilized type-1 AGNs from the ALSS and AMSSn sample. Their redshifts and hard X-ray luminosities range from 0.1 and 0.7, and from 1043 to 1045 erg s-1, respectively, which are almost the same as those of our type-2 AGNs. According to the unified scheme, we can expect that the Eddington ratio should be same between the type-1 and type-2 AGNs in average. Figure 7 shows the correlation between the and black hole mass of the type-1 AGNs. The masses are derived through the Kaspi relation (Kaspi et al. 2000) from the velocity width of H broad line and continuum luminosity summarized in Akiyama et al. (2000, 2003). Overall, there is a good correlation between the two, with a scatter of 0.5 dex around the mean value of , being consistent with other studies (e.g., Kollmeier et al. 2005). This result supports our assumption that the Eddington ratio can be regarded to be constant in our sample at first-order approximation.
Now we derive a BS-relation of the type-2 AGNs by converting into assuming . The upper ordinate of Figure 6 shows the mass of SMBHs thus obtained. The solid line represents the best-fit BS-relation,
| (3) |
where is the -band spheroid absolute magnitude. McLure & Dunlop (2002) also show the presence of a BS-relation for a sample of inactive galaxies, type-1 quasars, and Seyfert galaxies at by using HST imaging data, described as , with a cosmological parameter set of km s-1 Mpc-1 and . Our BS-relation (equation 3) is converted to with the cosmological parameter set they adopted, hence both relations agree with each other within the uncertainty. Studying host galaxies of type-1 AGNs at such redshift range is not easy, and generally HST images are needed to derive the spheroid luminosities. Our study demonstrates that studying AGN hosts at intermediate redshifts is possible even with a ground-based telescope, if we utilize a type-2 AGN sample.
To compare our results of - relation with other studies made for type-1 AGNs, we also plot the samples of Schade et al. (2000) and Dunlop et al. (2003) in Figure 6 by open circles and open squares, respectively. Schade et al. (2000) studied the host galaxies of soft X-ray selected type-1 AGNs at by using the HST images. We converted the monochromatic luminosity at 2 keV given in Schade et al. (2000) into by assuming an X-ray spectrum of . Dunlop et al. (2003) also studied the host galaxies of type-1 AGNs at with the HST data. The conversion from the -band nuclear luminosity into the is made with the relations (Ueda et al. 2003), in the optical band, and in the X-ray band. As seen in Figure 6, the distribution of our sample agrees well with that of the Dunlop et al. (2003) sample. However, it is significantly different from that by Schade et al. (2000); the spheroid luminosities against in the Schade et al. (2000) sample are systematically higher, and have a larger scatter than in our sample, particularly in the low X-ray luminosity range. The cause for the different distribution is not clear. Since it is suggested that low luminosity AGNs tend to have lower Eddington ratios with a larger scatter than high luminosity QSOs (e.g., Kollmeier et al. 2005), it might be possible that the sample of Schade et al. (2000) includes objects with lower Eddington ratios, while our sample does not contain such objects.
5.2 The correlation between B/T and nuclear luminosities
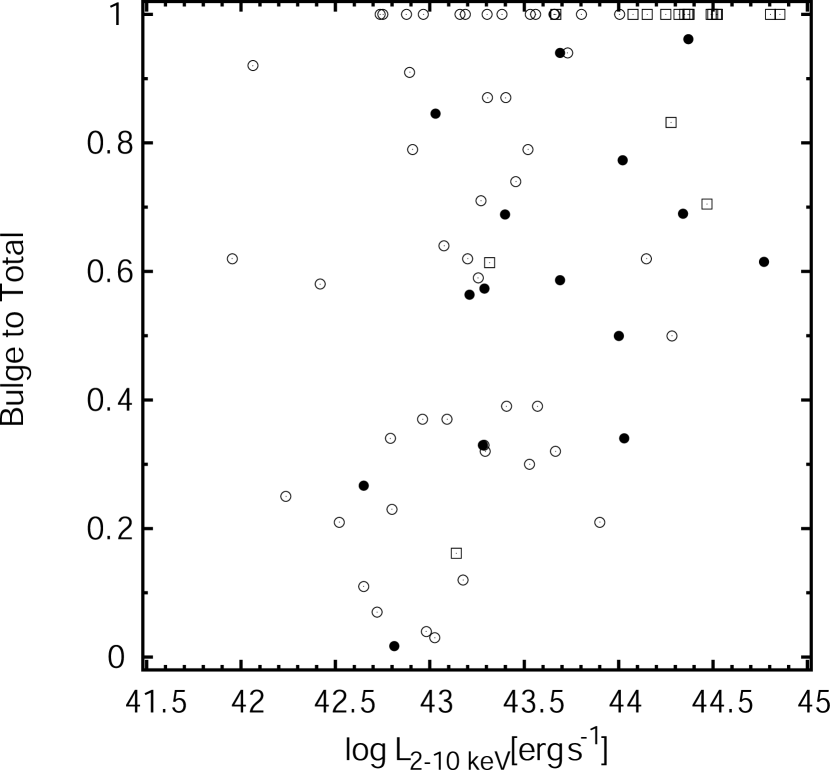
The spheroid-to-total luminosity ratio (B/T ratio) is a key parameter representing the morphology type of host galaxies. We plot the B/T ratio against for our sample by filled circles in Figure 8, where the total luminosity refers to a sum of the best-fit model spheroid luminosity and disk luminosity. As noticed from the figure, high X-ray luminosity AGNs resides only in galaxies with the large B/T ratio, while low X-ray luminosity AGNs reside in those with the B/T ratio of 0–1.0. If we take the total luminosity as the total integrated magnitude instead of taking the sum of the best-fit model luminosities, the values of B/T change about less than 0.05 (and up to to 0.1 for a few objects). Thus the trend does not change. We also plot the results of Schade et al. (2000) and Dunlop et al. (2003) in Figure 8 by open circles and open squares, respectively. The distribution of both samples is similar to that of our sample; no AGNs reside in a region of high X-ray luminosity and low B/T ratio. Some objects of Schade et al. (2000) and Dunlop et al. (2003) show the B/T ratio of unity. This is because they added a disk component to a model only when an observed image could not be well reproduced with a spheroid plus a nuclear component. Thus, if the same fitting method as used in this paper were applied to their data, the B/T ratio would become slightly lower than unity. Similarly, some objects with a high B/T ratio of our sample (NO54, NE04, and NE09) could be reproduced without a disk component. Their spheroid luminosities become slightly higher, but these are within uncertainties of the surface brightness fitting. In fact, B/T ratios do not change so much and the correlation between B/T ratio and still holds.
6 Summary
We study properties of the host galaxies of 15 hard X-ray selected type-2 AGNs at intermediate redshifts with a median redshift of 0.22), obtained from optical identification (ALSS, AMSSn) of the sources detected in surveys. Spheroid (bulge) and disk luminosities of the host galaxies were derived by two-dimensional surface brightness fitting. We found the correlation between and spheroid luminosity, implying the presence of the BS-relation at the intermediate redshifts. We estimated the Eddington ratios from type-1 AGNs in our original sample of ALSS and AMSSn, and found that the ratios distribute from 0.1 to 1.0 with the mean value of 0.24. Adopting the mean Eddington ratio of 0.24, we derived a BS-relation at the intermediate redshifts, which agrees with the BS-relation at the similar redshifts obtained by McLure and Dunlop (2002). The BS-relation obtained by McLure and Dunlop (2002) and thus that obtained here show almost no evolution from the BS-relation obtained at . Tamura et al. (2006) compared the BS-relation by McLure and Dunlop (2002) with those for local galaxies by converting the photometric band, and showed that the BS-relation almost agrees with local relations in -band (Marconi and Hunt 2003; Ferrarese and Merritt 2000) and in -band (Merritt and Ferrarese 2001). We also examined the distribution of B/T ratio against , and found that B/T ratios of the X-ray luminous AGNs have large B/T ratios close to 1.0, and those of less luminous AGNs have B/T ratios of 0 to 1.
Since we do not examine host galaxies of AGNs at , it is unknown whether the BS-relation is hold at the higher redshifts or not. Studies for estimation of s with Kaspi relation (Kollmeier et al. 2005) show that Eddington ratios are between 0.1 – 1 for AGNs at , and suggest that nuclear luminosity of AGNs would roughly correlate s. Meanwhile, BS-relations at higher redshift are rather controversial. Shields et al. (2003) show that the BS-relation of AGNs does not evolve from to 0. Akiyama (2005) and Peng et al. (2005) show that s of higher redshift QSOs () are larger than those expected from BS-relation in local universe. Furthermore, Borys et al. (2005) claim the inverse tendency, i.e., is smaller than that expected from BS-relation in local universe for hard X-ray detected submillimeter galaxies (). Thus, there is no consensus on the BS-relation at the higher redshift. One of causes of this difference in estimating BS-relation at high redshift is a difficulty of decomposition of a spheroid component for AGNs. Making a sample of type-2 AGNs at such high redshift will reduce the difficulty much.
In this study, we demonstrate the effectiveness of using type-2 sample in examining hosts, particularly spheroid components, at intermediate redshifts. AGN surveys at higher redshifts have been in progress with and satellites and their optical and near infrared(NIR) follow-up. In near future, we will obtain samples of type-2 AGNs in high redshift universe. For such targets, NIR imaging employing (laser guide) adaptive optics with ground-based 8-10m class telescopes is expected to be powerful tools to study host galaxies of high redshift QSOs.
References
- Akiyama et al. (2000) Akiyama, M., et al. 2000, ApJ, 532, 700
- Akiyama et al. (2003) Akiyama, M., Ueda, Y., Ohta, K., Takahashi, T., & Yamada, T. 2003, ApJS, 148, 275
- Akiyama (2005) Akiyama, M. 2005, ApJ, 629, 72
- Allen. (1976) Allen, D. A. 1976, MNRAS, 174, 29
- Borys et al. (2005) Borys, C., Smail, I., Chapman, S. C., Blain, A. W., Alexander, D. M., & Ivison, R. J. 2005, ApJ, 635, 853
- Allen. (1976) Coleman, G. D., Wu, C.-C., & Weedman, D. W. 1980, ApJS, 43, 393
- Dunlop et al. (2003) Dunlop, J. S., McLure, R. J., Kukula, M. J., Baum, S. A., O’Dea, C. P., & Hughes, D. H. 2003, MNRAS, 340, 1095
- Elvis et al. (1994) Elvis, M., et al. 1994, ApJS, 95, 1
- Ferrarese and Merritt (2000) Ferrarese, L., & Merritt, D. 2000, ApJ, 539, L9
- Gebhardt (2000) Gebhardt, K., et al. 2000, ApJ, 543, L5
- Hasinger et al. (2005) Hasinger, G., Miyaji, T., & Schmidt, M. 2005, A&A, 441, 417
- Jahanke et al. (2004) Jahnke, K., Kuhlbrodt, B., & Wisotzki, L. 2004, MNRAS, 352, 399
- Kaspi et al. (2000) Kaspi, S., Smith, S. P., Netzer, H., Maoz, D., Jannuzi, T. B., & Giveon, U. 2000, ApJ, 533, 631
- Kollmeier et al. (2005) Kollmeier A. J., et al. 2005, in submitted (astro-ph/0508657)
- Kormendy & Ricstone (1995) Kormendy, J., & Richstone, D. 1995, ARA&A, 33, 581
- La Franca et al. (2005) La Franca, F., et al. 2005, ApJ, 635, 864
- Magorrian (1998) Magorrian, J., et al. 1998, AJ, 115, 2285
- Marconi & Hunt (2003) Marconi, A., & Hunt, K. L. 2003, ApJ, 589, L21
- Marconi et al. (2004) Marconi, A., Risaliti, G., Gilli, R., Hunt, L. K., Maiolino, R., & Salvati, M. 2004, MNRAS, 351, 169
- Merritt & Ferrarese (2001) Merritt, D., Ferrarese, L. 2001, MNRAS, 320, 30L
- Mclure & Dunlop (2002) Mclure, R. J., & Dunlop, J. S. 2002, MNRAS, 331, 795
- Peng et al. (2002) Peng, Y. C., Ho, C. L., Impey, D. C., & Rix, H. 2002, AJ, 124, 266
- Peng et al. (2005) Peng, Y. C., Impey, D. C., Ho, C. L., Elizabeth, J. B., & Rix, H. 2005, ApJ, in press, (astro-ph/0509155)
- Sanchez et al. (2004) Sanchez, S. F., et al. 2004, ApJ, 614, 586
- Schade et al. (2000) Schade, J. D., Boyle, B. J., & Letawsky, M. 2000, MNRAS, 315, 498
- Shankar et al. (2004) Shankar, F., Salucci, P., Granato, G. L., De Zotti, G., & Danese, L. 2004, MNRAS, 354, 1020
- Shields et al. (2003) Shields, G. A., Gebhardt, K., Salviander, S., Wills, B. J., Xie, B., Brotherton, M. S., Yuan, J., & Dietrich, M. 2003, ApJ, 583, 124
- Tamura et al. (2006) Tamura, N., Ohta, K., & Ueda, Y. 2006, MNRAS, 365, 134
- Tonry et al. (2000) Tonry, J. L., Burke, B. E., Luppino, G., & Kaiser, N. 2004, Scientific Detectors for Astronomy, ed. Amico, P., Beletic, J. W., Beletic, J. E., (Kluwer Academic Pub), 395
- Ueda et al. (2003) Ueda, Y., Akiyama, M., Ohta, K., & Miyaji, T. 2003, ApJ, 598, 886
- Ueda et al. (2001) Ueda, Y., Takahashi, T., Makishima, K., & Ohashi, T. 2001, ApJS, 133, 1
- Ueda et al. (1999) Ueda, Y., Takahashi, T., Ohashi, T., & Makishima, K. 1999, ApJ, 524, L11
- Watanabe et al. (2004) Watanabe, C., Ohta, K., Akiyama, M., & Ueda, Y. 2004, ApJ, 610, 128


| Name | ID | aaRest-frame absorption corrected 2–10 keV luminosity. Absorption correction was done with the best fit absorbed power law model, details are described in Akiyama et al. (2003) | FWHM | Observed Period | Instrument | Photometry | |||
|---|---|---|---|---|---|---|---|---|---|
| [erg s-1] | [mag] | [mag] | [arcsec] | ||||||
| 1AXG J0335161505 | SE20 | 0.122 | 43.28 | 17.46 | -21.39 | 0.78 | Dec/2004 | OPTIC | (1) |
| 1AXG J0900533856 | NO54 | 0.229 | 44.02 | 17.88 | -22.36 | 0.84 | Apr/2004 | OPTIC | (4) |
| 1AXG J1221557525 | NO40 | 0.239 | 43.69 | 17.40 | -23.12 | 1.0 | Apr/2004 | OPTIC | (2) |
| 1AXG J1236052613 | NE04 | 0.459 | 44.37 | 19.50 | -22.89 | 0.93 | May/2005 | Tek2048 | (3) |
| 1AXG J1423532247 | NE09 | 0.282 | 44.34 | 16.80 | -24.16 | 0.81 | May/2005 | Tek2048 | (2) |
| 1AXG J1441093520 | NO32 | 0.077 | 42.65 | 16.31 | -21.25 | 0.82 | May/2005 | Tek2048 | (4) |
| 1AXG J1443015208 | NO26 | 0.212 | 43.69 | 17.38 | -22.72 | 1.5 | May/2005 | OPTIC | (4) |
| 1AXG J1503391016 | NO05 | 0.095 | 43.29 | 16.35 | -21.80 | 0.77 | May/2005 | Tek2048 | (4) |
| 1AXG J1515243639 | NO21 | 0.324 | 44.03 | 18.14 | -23.09 | 0.78 | May/2005 | Tek2048 | (4) |
| 1AXG J1601180844 | NO53 | 0.606 | 44.77 | 20.57 | -23.32 | 0.97 | Apr/2004 | OPTIC | (4) |
| 1AXG J1635383809 | NO47 | 0.099 | 43.03 | 17.66 | -20.60 | 1.1 | Apr/2004 | OPTIC | (3) |
| 1AXG J1707302353 | NO24 | 0.245 | 44.00 | 19.46 | -21.10 | 0.81 | May/2005 | Tek2048 | (4) |
| 1AXG J1749436823 | NO43 | 0.051 | 42.81 | 14.96 | -21.85 | 0.72 | May/2005 | Tek2048 | (1) |
| AX J1308402955 | LSS014 | 0.164 | 43.21 | 17.48 | -21.98 | 0.95 | May/2005 | Tek2048 | (4) |
| AX J1317583257 | LSS195 | 0.214 | 43.40 | 17.58 | -22.59 | 0.90 | May/2005 | Tek2048 | (4) |
References. — Photometric data derived from (1) this work, (2) Akiyama et al. (2003), (3)Watanabe et al. (2004), and (4)SDSS magnitudes with conversion of equation (1) in the text.
| ID | |||||
|---|---|---|---|---|---|
| [mag] | [kpc] | [mag] | [kpc] | [mag] | |
| SE20 | -20.18 | 3.55 | -20.95 | 5.33 | -18.31 |
| NO54 | -22.04 | 5.05 | -20.71 | 24.24 | -18.71 |
| NO40 | -22.49 | 7.26 | -22.11 | 15.24 | -19.55 |
| NE04 | -22.75 | 5.01 | -19.26 | 23.12 | -20.20 |
| NE09 | -23.71 | 1.45 | -22.84 | 7.42 | -20.86 |
| NO32 | -19.80 | 1.09 | -20.90 | 2.46 | -15.33 |
| NO26 | -22.57 | 10.70 | -19.58 | 20.75 | -19.80 |
| NO05 | -21.19 | 1.96 | -20.87 | 9.69 | -6.59 |
| NO21 | -21.88 | 0.84 | -22.60 | 4.46 | -19.22 |
| NO53 | -22.70 | 2.48 | -22.19 | 9.74 | -20.60 |
| NO47 | -20.41 | 2.52 | -18.56 | 9.43 | -14.54 |
| NO24 | -20.24 | 1.81 | -20.24 | 35.79 | -18.49 |
| NO43 | -17.55 | 0.31 | -21.97 | 2.78 | -17.72 |
| LSS014 | -21.25 | 4.14 | -20.97 | 4.14 | -19.37 |
| LSS195 | -22.11 | 3.03 | -21.25 | 7.27 | -19.57 |