Clusters of Galaxies at : The Spitzer Adaptation of the Red-Sequence Cluster Survey
Abstract
As the densest galaxy environments in the universe, clusters are vital to our understanding of the role that environment plays in galaxy formation and evolution. Unfortunately, the evolution of high-redshift cluster galaxies is poorly understood because of the “cluster desert” that exists at . The SpARCS collaboration is currently carrying out a 1-passband () imaging survey which, when combined with the pre-existing deg2 Spitzer SWIRE Legacy Survey data, will efficiently detect hundreds of clusters in the cluster desert using an infrared application of the well-proven cluster red-sequence technique. We have already tested this 1-color (z) approach using a 6 deg2 “pilot patch” and shown it to be extremely successful at detecting clusters at . The clusters discovered in this project will be the first large sample of “nascent” galaxy clusters which connect the star-forming proto-cluster regions at 2 to the quiescent population at . The existing seven-passband Spitzer data (3.6, 4.5, 5.8, 8.0, 24, 70, 160 m) will allow us to make the first measurements of the evolution of the cluster red-sequence, IR luminosity function, and the mid-IR dust-obscured star-formation rate for clusters.
1. Introduction
Galaxy clusters are unique, high-density regions in the universe and are therefore important testbeds for theories of galaxy formation and evolution. Within the last decade, significant amounts of observational resources have been invested in finding clusters to 1 using X-ray (Rosati et al. 1998; Pierre et al. 2004) and optical (Gladders & Yee 2000; Gilbank et al. 2004) techniques. Simultaneously, surveys which employ the Lyman-break technique have begun to uncover a population of vigorously star-forming proto-cluster regions at (e.g., Kurk et al. 2004; Ouchi et al. 2005; Steidel et al. 2005). Tantalizingly, the crucial stages in cluster galaxy evolution, where star-forming Lyman- galaxies transform into the quiescent early-type population seen at 1 (Blakeslee et al. 2003; Holden et al. 2004) appear to occur in the hard to access redshift range , the “cluster desert”. Currently, there are fewer than 15 spectroscopically-confirmed clusters at 111NASA Extragalactic Database (NED) (with the highest-redshift being ; Stanford et al. 2005)
2. The (Infrared) Cluster Red-Sequence Method
The Cluster Red-Sequence (CRS) technique requires imaging in only two filters which span the break feature in early types, and is a well-tested and observationally efficient method for detecting clusters (Gladders & Yee 2005; Wilson, Muzzin & Lacy 2005). The CRS algorithm selects clusters by using the fact that the cluster galaxy population is dominated by ellipticals and that they lie along a linear relation in the color-magnitude plane. If two filters that span the rest-frame break are used to construct the color-magnitude diagram, cluster ellipticals are always the brightest, reddest galaxies at a given redshift, and therefore provide significant contrast with the field. The original technique was first developed by Gladders & Yee and is being used very successfully to target clusters in the range where the blue-red filter combination spans the break.
Fig. 1 shows the observed spectral energy distribution (SED) of an early type at and . Also shown are the portions of the SED sampled by the , , , and [3.6] passbands. At , the 4000Å-break is shifted into the infrared (IR). To carry out a cluster survey at requires deep IR observations over a large area - observations that are very difficult to obtain from the ground.
The only deep, large area (tens of square degrees) IR dataset currently available (or indeed available for the foreseeable future) is the Spitzer SWIRE Legacy Survey222http://swire.ipac.caltech.edu/swire/swire.html.
3. The SpARCS Survey
The SWIRE Survey is comprised of six fields, and is well-suited to searching for high redshift clusters. Four fields (34.2 deg2) are accessible from the North, and two fields (14.8 deg2) from the South (totalling 49 deg2). Rich clusters are very rare so it is important to search over as large an area as possible. We expect to find only about 30 rich clusters (Abell Class 1) in the entire SWIRE survey.
Our collaboration, SpARCS333http://spider.ipac.caltech.edu/staff/gillian/SpARCS (The Spitzer Adaptation of the Red-Sequence Cluster Survey) has developed an IR adaptation of the two-filter cluster red-sequence technique which utilizes IRAC’s channel as the “red” filter (Fazio et al. 2004). A good choice of “blue” filter (better than e.g., or ), is the filter. This is because samples blueward of rest-frame at , and yet becomes only as blue as rest-frame at .
Fig. 2 shows red-sequence models constructed using the code of Bruzual & Charlot (2003), assuming a galaxy undergoing a burst of star-formation at and evolving passively thereafter. Based on these models, we can detect early types to .
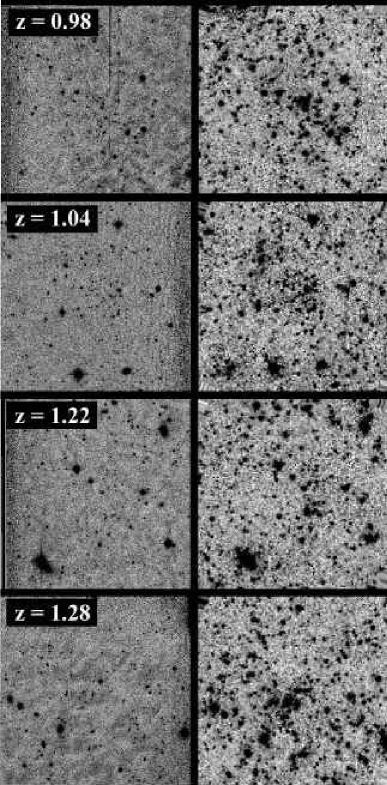
To date, we have combined 6 deg2 of MegaCam and SWIRE [3.6] data in the XMM-LSS field, and detected about 70 moderately-rich clusters at . Figs. 3 & 4 show examples of clusters at . We are currently extending this analysis to the remaining SWIRE fields.
Science Goals
By searching for clusters over 50 deg2, our aim is to detect a representative sample of clusters at . This will allow the study of cluster galaxy evolution over a range of cluster richnesses and redshifts.
We plan to measure the IR luminosity function (e.g., Muzzin, Wilson & Lacy 2005, 2006), the mid-IR dust-obscured star-formation rate (using the SWIRE data), the red-sequence, and the relative color distribution. In particular, the evolution of the color distribution will allow us to study the star-formation properties of the cluster galaxies as a function of mass and redshift and understand how the star-forming proto-cluster regions at connect to the quiescent clusters at . Furthermore, by measuring the evolution of both the IR luminosity function and the slope, scatter and color of the red-sequence to higher redshift than previous studies, we hope to put precise constraints on the epoch when stellar mass is assembled in cluster galaxies (Holden et al. 2004; Kodama et al. 2004).
Our goal is to release our cluster catalogs to the community as soon as possible, so that this sample can serve as a basis for numerous other science projects which require follow-up observations (e.g. mass determination, enrichment history).
Acknowledgments.
This work is based in part on archival data obtained with the Spitzer Space Telescope, which is operated by the Jet Propulsion Laboratory, California Institute of Technology under a contract with NASA. Support for this work was provided by NASA. This work was also based on observations obtained with MegaPrime/MegaCam, a joint project of CFHT and CEA/DAPNIA, at the Canada-France-Hawaii Telescope (CFHT) which is operated by the National Research Council (NRC) of Canada, the Institut National des Science de l’Univers of the Centre National de la Recherche Scientifique (CNRS) of France, and the University of Hawaii. This work is based in part on data products produced at TERAPIX and the Canadian Astronomy Data Centre as part of the Canada-France-Hawaii Telescope Legacy Survey, a collaborative project of NRC and CNRS.
References
- Blakeslee et al. (2003) Blakeslee, J. P., et al. 2003, ApJ, 596, 143
- Bruzual & Charlot (2003) Bruzual, G., & Charlot, S. 2003, MNRAS, 344, 1000
- Fazio et al. (2004) Fazio, G. G., et al. 2004, ApJS, 154, L10
- Gilbank et al. (2004) Gilbank, D. G., et al. 2004, MNRAS, 348, 551
- Gladders & Yee (2000) Gladders, M. D., Yee, H. K. C., 2000, AJ, 120, 2148
- Gladders & Yee (2005) Gladders, M. D., Yee, H. K. C., 2005, ApJS, 157, 1
- Holden et al. (2004) Holden, B. P. et al. 2004, AJ, 127, 2484
- Kodama et al. (2004) Kodama, T. et al. 2004, MNRAS, 250, 1005
- Kurk et al. (2004) Kurk, J. D., et al. 2004, A&A, 428, 817
- Muzzin, Wilson & Lacy (2005) Muzzin, A., Wilson, G., & Lacy, M. 2005, to appear in “Spitzer Space Telescope: New Views of the Universe”, ed. Armus L., (astro-ph/0503640)
- Muzzin, Wilson & Lacy (2006) Muzzin, A., Wilson, G., & Lacy, M. 2006, in prep.
- Ouchi et al. (2005) Ouchi, M., et al. 2005, 620, L1
- Pierre et al. (2004) Pierre, M. et al. 2004, JCAP, 9, 11
- Rosati et al. (1998) Rosati, P. et al. 1998, ApJL, 492, L21
- Stanford et al. (2005) Stanford, S. A., et al., 2005, ApJ, 634, L129
- Steidel et al. (2005) Steidel, C. C., et al. 2005, ApJ, 626, 44
- Wilson, Muzzin & Lacy (2005) Wilson, G., Muzzin, A., Lacy, M. 2005, to appear in “Spitzer Space Telescope: New Views of the Universe”, ed. Armus L., (astro-ph/0503638)